Global Overview & Australia Where is our multispeed economy at - and where to from here? Alan Oster - Group Chief Economist - nabtrade
←
→
Page content transcription
If your browser does not render page correctly, please read the page content below
Global Overview
                                             &
                                         Australia

                Where is our multispeed economy at - and where to from here?

                              Alan Oster – Group Chief Economist

Date: August 2019

 1     Footer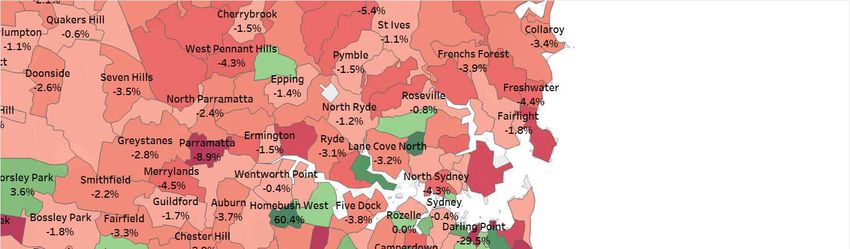
Global and Local - Macroeconomic summary.
 Global growth slowing – especially in Emerging market economies but also advanced economies ex the US
 (Europe and Japan). Trade disputes one factor and risk of further escalation.
      US also slowing but not crashing. Tariffs likely to slow growth further and see further cuts following July
      action (September and October). China OK with 6% growth reasonable – again with policy stimulus.

 Domestic growth was good through the first half of 2018, but has slowed substantially and continues into
 July. Confidence up on election and rate cuts – but didn’t last.
      Critical weakness is consumers (especially discretionary consumption as budgets remain tight) and
      construction related to house price falls. These are core views in our forecasts. Rate cuts affect next
      year not now and tax cut very small impact
      But infrastructure, public consumption, LNG exports and broader investment will maintain growth in near
      term (2019). Beyond that more focus on the consumer;
      We are still weaker than RBA on GDP – in ‘through the year’ terms we are 2.0% in 2019 and 2 to 2¼%
      in the out years. RBA is still expecting growth of around 2¾% through out the forecasting period.

 Inflation has surprised on downside and continues to track lower. A concern for an inflation targeting central
 bank. Wages growth will still be slow and price competition in retail intense.

 Outlook for rates has changed a bit in the last few months with latest data flow;
      NAB – After cuts in June and July we expect another cut in November. And haven’t ruled out
      non conventional policy next year.
      Basically with very low inflation and signs that the labour market is weakening the RBA needs to
      act now. We also think that additional fiscal stimulus will be needed in late 2019.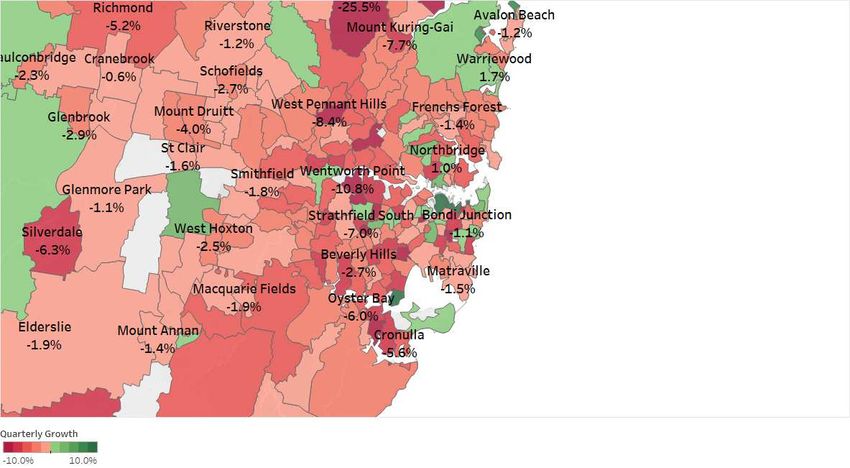
Our global leading indicator suggests that global economy has weakened.
- That trend looks likely to continue. Trade and technology important here.
                                         NAB Leading Indicator: GLOBAL y/y %
                 7.0
                                                                                    NABLEAD

                 6.0                                                                WGDP

                 5.0

                 4.0
           %ge

                 3.0

                 2.0

                 1.0

                 0.0
                       Dec-10

                                Dec-11

                                           Dec-12

                                                    Dec-13

                                                             Dec-14

                                                                      Dec-15

                                                                               Dec-16

                                                                                           Dec-17

                                                                                                    Dec-18

                                                                                                             Dec-19
       Our global leading indicator – is based on Baltic shipping, global airfreight, metal
       prices, Asian leading index and yield curves in major economies.
3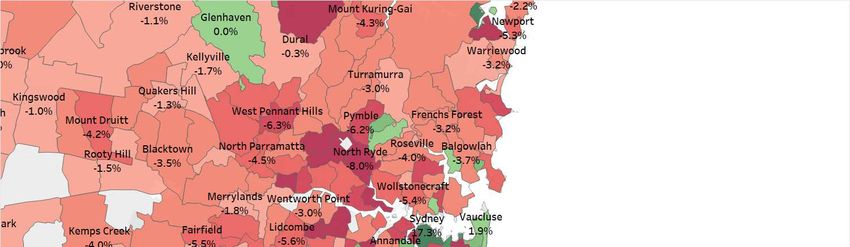
US economy weakening forward path has seen Fed doing insurance cuts.
But fear of global weakness and tariff chaos has seen markets getting very bearish on
rates – up to 4 more cuts.
    We now expect growth of around 2.3% in 2019 - with a weak patch in H2 2019 and into
    2020;
    While labour market is strong we are looking at below potential growth from late 2019
    which will probably see unemployment bottom around 3.6%;
    And inflation less a risk. Tariffs likely to lower growth further (now around 1.6% in 2020);
    Hence we think the Fed will be cutting twice more in H2 2019 (September and October);
    Market has two cuts in late 2019 and approaching 1% by late 2020 (another 4 cuts).

          2.5

           2

          1.5

                                                                     Fed Funds Mid Point
           1
                                                                     Market Forecasts

          0.5

           0

4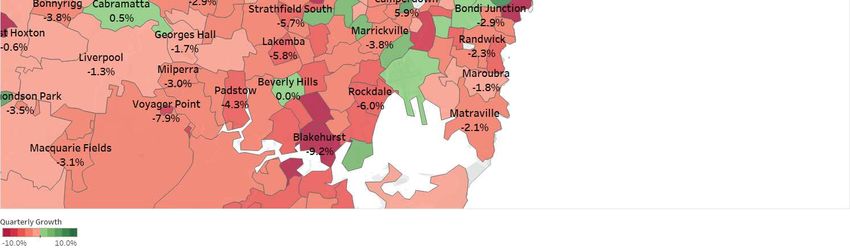
Global economic forecasts. - After above trend growth in 2018, 2019 looks slower –
includes tariff effects. But a touch higher in 2020 and 2021 – mainly due to India
and emerging markets.

                              2018       2019        2020        2021
        US                     2.9        2.2        1.7          1.8
        Euro-zone              1.9        1.1        1.2          1.4
        Japan                  0.8        1.2        0.3          0.9
        UK                     1.4        1.2        1.2          1.5
        Canada                 1.9        1.4        1.5          1.7
        China                  6.6        6.3        6.0          5.8
        India                  6.8        6.3        7.0          7.1
        Latin America          1.0        0.6        1.7          2.4
        Other East Asia        4.1        3.5        3.7          3.8
        Australia              2.8        1.7        2.3          2.3
        NZ                     2.9        2.4        2.6          2.5
        Global                 3.6        3.1        3.3         3.5

5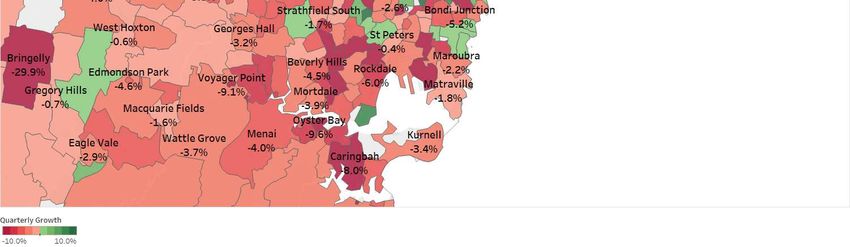
Currency model. USD .68+/- 5c. - Roughly now where model expects and global
uncertainty (trade wars) likely to push AUD down to mid 60s before moving back to
around 70c by end 2020 and a touch higher into 2021. USD safety play important.
                                          Currency Model*
                                                   Model* and AUD / USD
        AUD/ USD                                                                                                            AUD / USD
       1.2

                                                       AUD ACTUAL & FORECASTS

       1.1
                                                       Plus X2 Std Dev

        1                                              Minus X2 Std Dev

       0.9

       0.8

       0.7

       0.6

       0.5

       0.4
         Feb-85    Feb-88   Feb-91   Feb-94   Feb-97      Feb-00          Feb-03   Feb-06   Feb-09   Feb-12   Feb-15   Feb-18   Feb-21

     • Model driven by: commodity prices; US TWI – as                                                Forecasts:
       measure of USD strength; long and short run rates;                                            End 2019 = 65c AUD/USD
       relative unemployment; relative equity markets and VIX.                                       End 2020 = 70c AUD/USD
6                                                                                                    End 2021 = 72c AUD/USD
Business Confidence – has tracked down but then enjoyed a post election bounce and
talk of rate cuts. - But hasn’t been maintained in the face of below average conditions…

             Net Balance                                                                                     Net Balance

        20                                                                                                                 20

        17
                                                              Business Confidence                                          17

        14                                                                                                                 14

                                                        Long run average confidence reading
        11                                                                                                                 11

         8                                                                                                                 8

         5                                                                                                                 5

         2                                                                                                                 2

        -1                                                                                                                 -1

        -4                                                                                                                 -4

        -7                                                                                                                 -7

        -10                                                                                                                -10
         2012M12      2013M08   2014M04   2014M12   2015M08    2016M04   2016M12   2017M08    2018M04   2018M12

7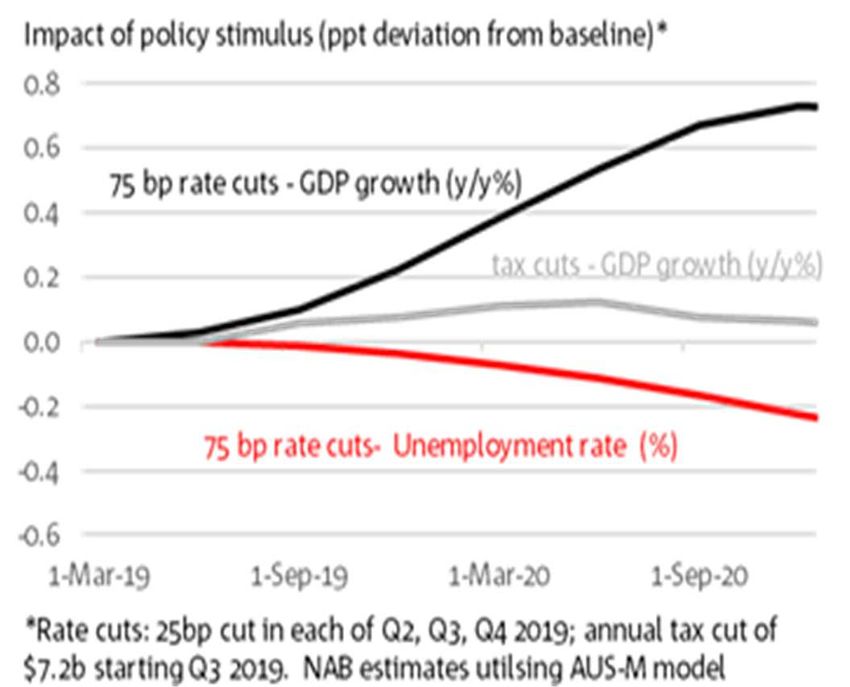
On business outcomes, have seen large falls recently – over last 6 months.
The trend is telling. - Fundamentally private sector momentum has come off a lot and it
is still moving lower in trend terms in July.

             Net Balance                                                                                     Net Balance

        20                                                                                                                 20
                                                            Business Conditions
        17                                                                                                                 17

        14                                                                                                                 14
                                                      Trend
        11                                                                                                                 11

         8                                                                                                                 8

         5                                                                                                                 5

                                                                      Long run average conditions reading
         2                                                                                                                 2

        -1                                                                                                                 -1

        -4                                                                                                                 -4

        -7                                                                                                                 -7

        -10                                                                                                                -10
         2012M12    2013M08   2014M04   2014M12   2015M08   2016M04      2016M12   2017M08    2018M04   2018M12

8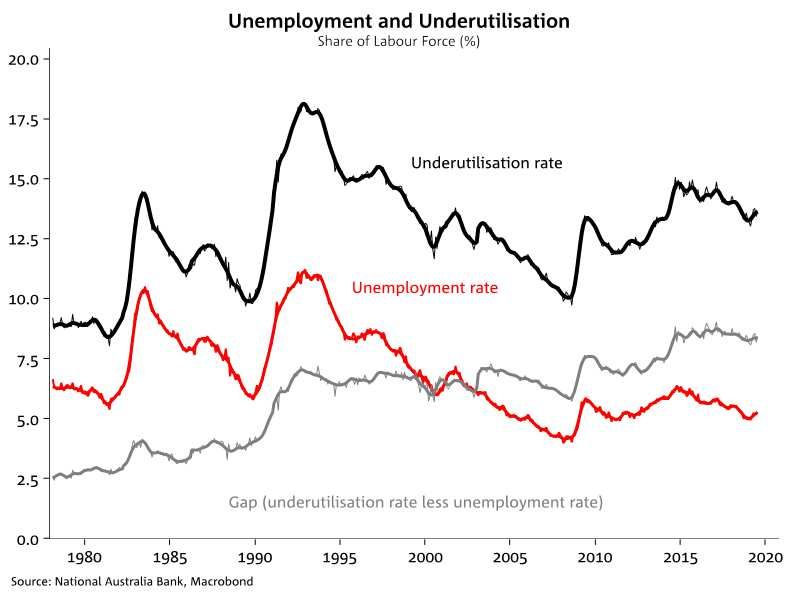
Loss of momentum broadly based. But driven by retail/wholesale, manufacturing and
general services. - Construction has fallen a lot but better trend starting to reverse.

        35.0                                                                                                                      35

                                                                                                   Mining

        25.0                                                                                                                      25

                                                                           General Services

        15.0                                                                                                                      15
                                                                                                                           Construction

         5.0                                                                                                                      5

         -5.0                                                                                                                     -5

                                                                                                                         Manufacturing

        -15.0                                                                                                                     -15

        -25.0
                                                                                                                    Retail        -25

        -35.0                                                                                                                     -35
           2012M06 2012M12 2013M06 2013M12 2014M06 2014M12 2015M06 2015M12 2016M06 2016M12 2017M6 2017M12 2018M06 2018M12 2019M06

9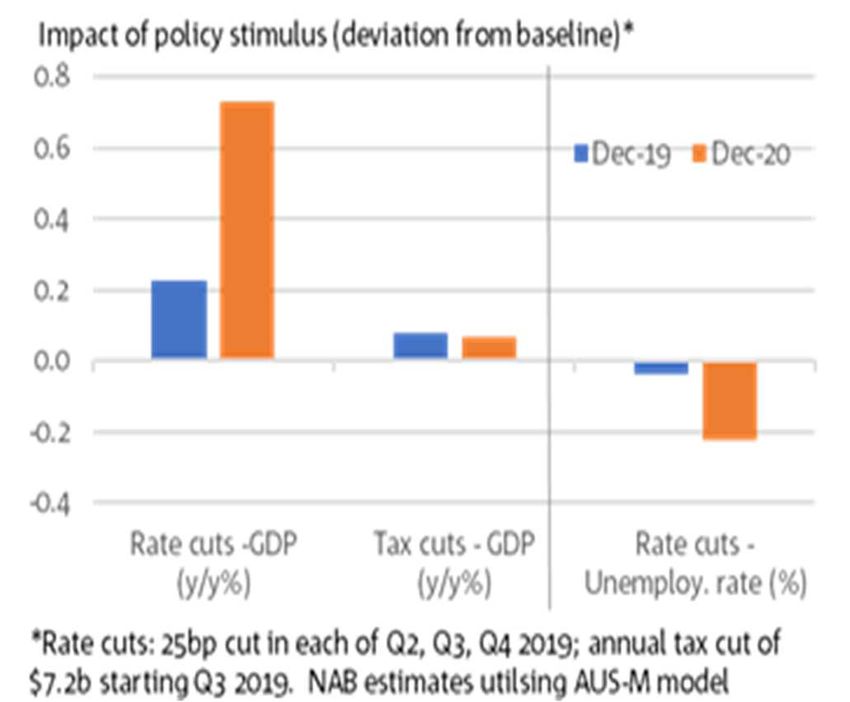
Another way to show the loss of momentum in the private sector and the offset in public
demand - is from the National Accounts.

10
There has been much talk about the impact of recent rate cuts (and another in prospect
by late 2019. Plus tax cuts etc.
- However macro impact of rate cuts mainly 2020 and fiscal impact is small.
     On rate cuts we included the recent cuts and assumed another cut in late 2019.
     The fiscal policy shock (allowing around $7.5bn in tax cuts in 2019/20. Not unexpectedly the
     impact even by late 2020 is very modest at around 0.15 points to y/y growth – the tax cuts to
     GDP are small and tax multipliers reduce the expenditure effect even further.
     These scenarios do however point to a positive impact on house prices – and we now
     expect house prices in Sydney and Melbourne to bottom (rather than fall further).

11
Consumers are under the pump.
They are still very cautious re debt - and budgets have been crunched by utility prices.
As a result discretionary retail suffers – and getting worse in March 2019.
CONSUMER SPENDING PATTERNS
(NET BALANCES FROM NAB CONSUMER BEHAVIOUR SURVEY)
30
20
10
0
-10
-20
-30
Q3'14
Q4'14
Q1'15
Q2'15
Q3'15
Q4'15
Q1'16
Q2'16
Q3'16
Q4'16
Q1'17
Q2'17
Q3'17
Q4'17
Q1'18
Q2'18
Q3'18
Q4'18
Q1'19
Transport/ Food/ Medical/Children Household /Personal Goods/ Home Improvements
Utilities Paying off Debt
Total
12Australian wages growth stuck below pre-GFC levels
– a critical problem and why both sides of politics have tax cuts.
Traditional relationships say wages should be going up…
But underutilisation of labour really important.
13And the gap between - underutilisation of labour and unemployment remains. 14
Core inflation very low on the back of low wages growth and poor conditions in retailing
(and online competition) – and likely to head lower. As an inflation targeting central
bank, raises questions for RBA. Not back to bottom of target till 2021.

                                                CORE CPI V Headline Inflation
                                                   12 Mths to %
      5.0                                                                                                                                                             5.0

      4.5                                                                                                                                                             4.5

                                                                                                  Actual plus Forecasts           Headline RHS
      4.0                                                                                                                                                             4.0

      3.5                                                                                                                                                             3.5

      3.0                                                                                                                                                             3.0

      2.5                                                                                                                                                             2.5

      2.0                                                                                                                                                             2.0

      1.5                                                                                                                                                             1.5

      1.0                                                                                                                                                             1.0

      0.5                                                                                                                                                             0.5

      0.0                                                                                                                                                             0.0
            Mar-05

                     Mar-06

                              Mar-07

                                       Mar-08

                                                Mar-09

                                                         Mar-10

                                                                  Mar-11

                                                                           Mar-12

                                                                                    Mar-13

                                                                                             Mar-14

                                                                                                       Mar-15

                                                                                                                Mar-16

                                                                                                                         Mar-17

                                                                                                                                  Mar-18

                                                                                                                                           Mar-19

                                                                                                                                                    Mar-20

                                                                                                                                                             Mar-21
15
16
0
50
100
150
200
250
Dec-95
Jun-96
Dec-96
Jun-97
Dec-97
Jun-98
Dec-98
Jun-99
Dec-99
Jun-00
Dec-00
Jun-01
Dec-01
Jun-02
SYDNEY
Dec-02
Jun-03
Dec-03
Jun-04
Dec-04
MELBOURNE
Jun-05
Dec-05
Jun-06
Dec-06
Jun-07
BRISBANE
Dec-07
Jun-08
On house prices – first an historical perspective:
Dec-08
Jun-09
Dec-09
ADELAIDE
Jun-10
Dec-10
Jun-11
Australian House Prices - Jan 2007=100
Dec-11
PERTH
Jun-12
Dec-12
Jun-13
AUST
Dec-13
Jun-14
Dec-14
Jun-15
Dec-15
Jun-16
Dec-16
Jun-17
Dec-17
Jun-18
Dec-18
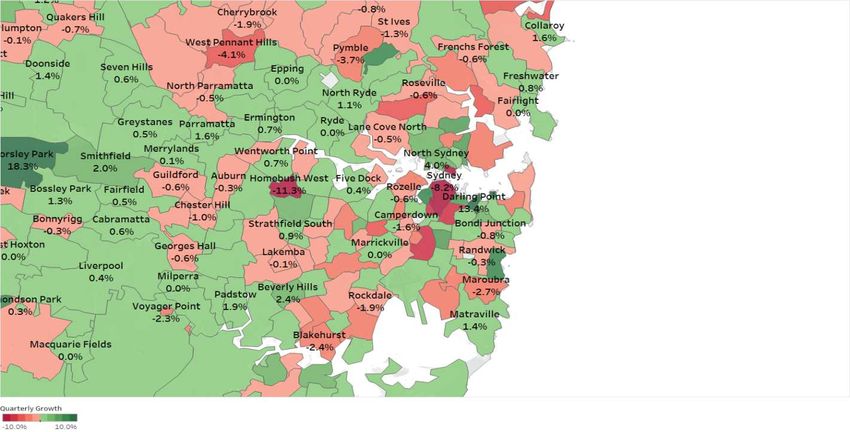
Jun-19Quarterly Growth. - A story of contagion.
February 2018
November 2018
17Quarterly Growth. - Contagion continues but a touch more green and less deep red.
May 2019
June 2019
18Traditional drivers of - house prices.
Typically three things matter for house prices:
Over/Under supply – by post code;
Interest rate you are paying;
Unemployment – if above 8% in post code = trouble.
But that is not what is playing out now; Rather:
Banks are restricting supply on investor housing – a la APRA;
Banks are really looking carefully at expenses – actuals not just model driven;
And its taking more time;
And customers are more careful re expectations;
And investors and foreigners in retreat.
That said fundamentals are good.
19Our Growth Expectations – Strength in infrastructure & government spending (NDIS),
exports (LNG). But consumer still a drag and dwelling cycle falling. GDP thru 2019
around 2.0% this year & a touch higher in 2020 and 2021. RBA still around 2.8%.
5%
Quarterly Growth
4%
Year-ended Growth
3%
2%
1%
0%
-1%
Jun-10 Jun-12 Jun-14 Jun-16 Jun-18 Jun-20
Source: ABS; NAB Economics
20The difference between the private sector and public sector demand in the forecasts are
- quite marked.
Domestic Demand - Private & Public - y/y%
12.0
12%
Underlying Public Demand
Private Demand 10.0
9%
8.0
7%
6.0
Annual % change
4% 4.0
2.0
2%
0.0
-1%
-2.0
-4%
-4.0
-6% -6.0
Dec-86
Dec-88
Dec-90
Dec-92
Dec-94
Dec-96
Dec-98
Dec-00
Dec-02
Dec-04
Dec-06
Dec-08
Dec-10
Dec-12
Dec-14
Dec-16
Dec-18
Dec-20
21Labour market generating jobs but partly offset by changes in the participation rate.
- Unemployment unlikely to come down further from current 5¼% given our GDP
forecasts and start rising from late 2019.
3.5% 7.0
EMPLOYMENT - LHS
3.0% (F)
UNEMPLOYMENT RATE - RHS
6.5
2.5%
2.0%
% change - 12 months to
6.0
1.5%
% - rate
1.0%
5.5
0.5%
0.0%
5.0
-0.5%
-1.0% 4.5
Jun-09
Jun-10
Jun-11
Jun-12
Jun-13
Jun-14
Jun-15
Jun-16
Jun-17
Jun-18
Jun-19
Jun-20
Jun-21
22RBA has admitted they over-estimated growth and with the labour market weakening more
policy will be required. - We have another cut in November. And fiscal policy stimulus
required later this year…
After June and July cuts we still see another cut in
3
November. But could come sooner.
This is all about trying to give the economy (and 2.5
Cash Rate
the private sector) a boost. Increasingly RBA
Market Forecasts
realise they are “behind the curve” and need 2
to act ASAP.
1.5
We suspect that the state of the economy will see
further fiscal policy stimulus in H2 2019 (from 1
September onwards).
0.5
And we think RBA is actively thinking about
additional non-traditional monetary stimulus in 0
early 2020 (or earlier).
Dec-14
Apr-15
Aug-15
Dec-15
Apr-16
Aug-16
Dec-16
Apr-17
Aug-17
Dec-17
Apr-18
Aug-18
Dec-18
Apr-19
Aug-19
Dec-19
Markets pricing includes more cuts (late in 2019).
23IMPORTANT NOTICES 24
IMPORTANT NOTICES

25   Footer
You can also read