GLOBAL TRENDS IN ANTIMICROBIAL USE IN FOOD ANIMALS - Thomas Van Boeckel - Swiss Re
←
→
Page content transcription
If your browser does not render page correctly, please read the page content below
GLOBAL TRENDS IN ANTIMICROBIAL USE IN FOOD ANIMALS

Thomas Van Boeckel
I have never worked at an NGO, or in industry

I have not received funding from industry Funding Sources
 Branco Weiss
I have not received payment for this talk Foundation

…

I am not … vegetarian Gates Foundation

 Princeton University Joint
 Programming
 Initiative on AMR
 US State
 Department
1. Why antimicrobials in animals? Is it a problem?
some bad news.
Animal Production Intensification

 Extensive Production Intensive Production

mechanization breeds concentration drugs
HUMANS

 More than 73% of all antimicrobials
 sold in the world are used in animals.
 Van Boeckel et al 2017, Science.
2. GLOBAL TRENDS CONSUMPTION
some more bad news.
Objectives

1. Estimate and map the current (2010) consumption of
 antimicrobials.

2. Project the trends for future consumption of
 antimicrobials in 2030 (if not actions are taken)
Modelling assumptions TOTAL (Kg) SALES 38 OECD Countries Projected Meat Consumption 2010 2030 Robinson & Pozzi, 2011 Extensive Intensive
Consumption in food animals
 PRIORS: Literature search

Ab (mg) = αCa • KgCattleInt + αCh • KgChickensInt + αPg • KgPigsInt

 POSTERIORS: Estimation in Bayesian framework

 Van Boeckel et al, PNAS 2015
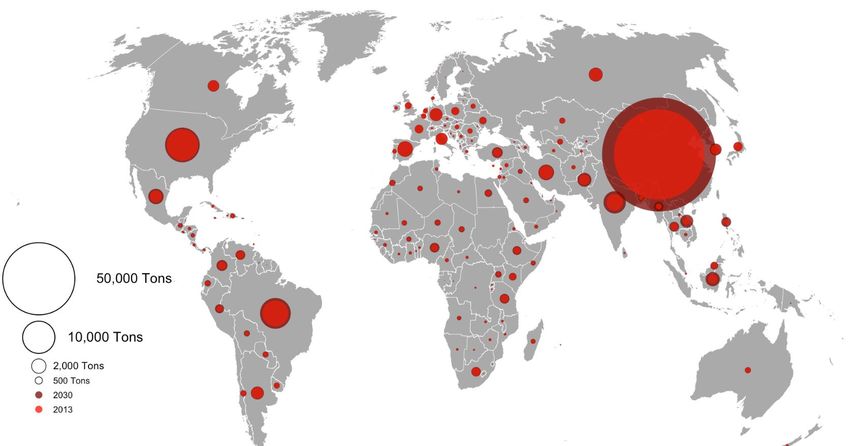
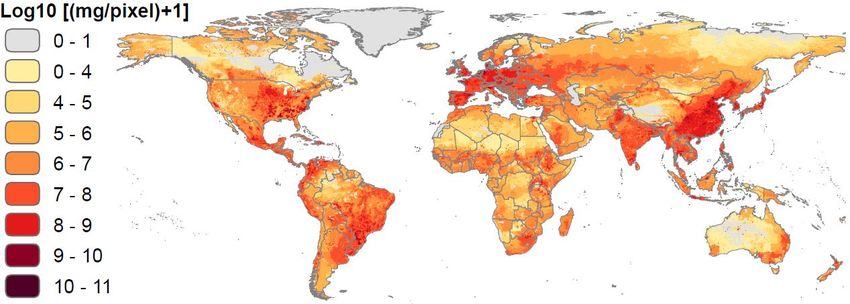
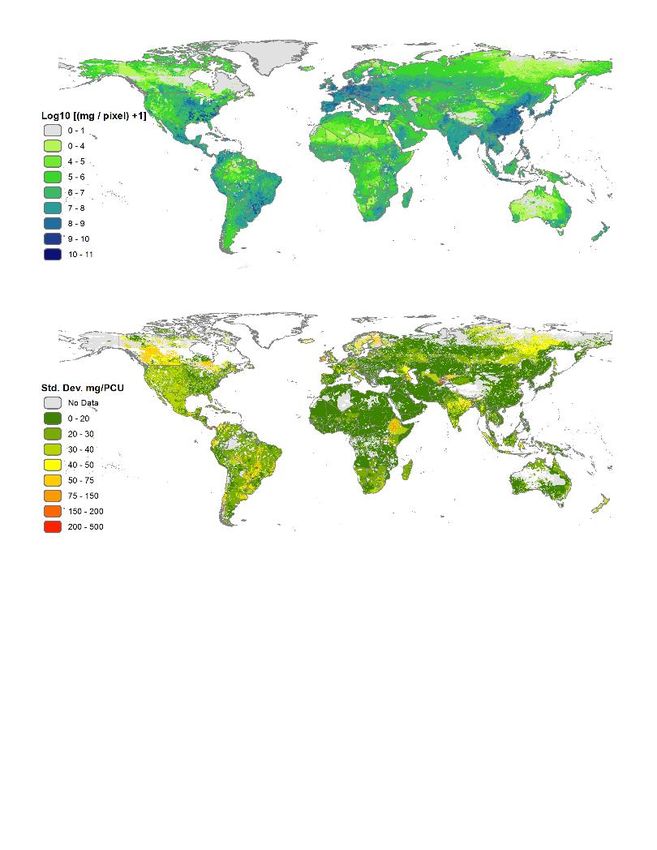
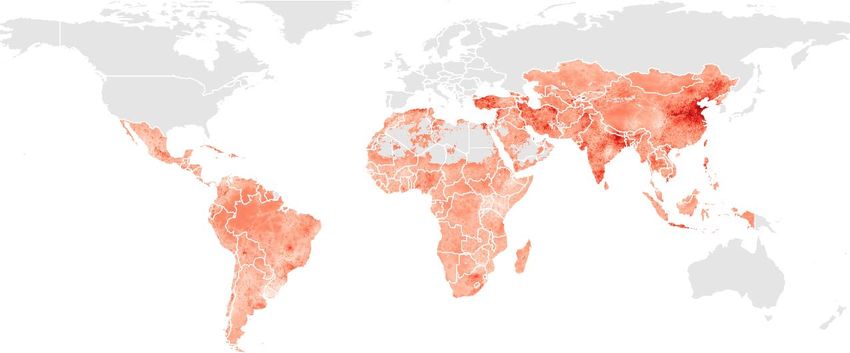
Global Antimicrobials consumption in livestock

GIS Layer: livestock.geo-wiki.org/ Van Boeckel et al, PNAS 2015
GIS Layer: livestock.geo-wiki.org/ Van Boeckel et al, PNAS 2015
2013 2030
 2010

 63,151 131,109 +53% 200,235
 tons tons tons

 An alarming revision BRICS
 Brazil
 Russia
 India
 China
 +99%
 South Africa

 +14%
 7x

Van Boeckel et al. 2017, Science.
3. WHAT CAN WE DO TO REDUCE RESISTANCE?
Global policy agenda, and solutions.
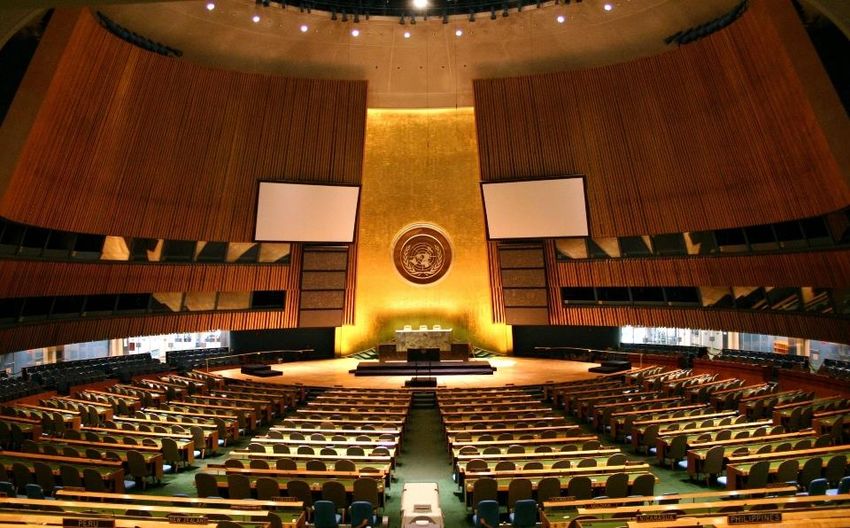
International Agenda

“AMR is one of the most urgent global risk, requiring increased attention and coherence at the international level”

 Animal play a role Re-evaluate, 18th of Sept 2018

 Country-level surveillance Targets for reduction
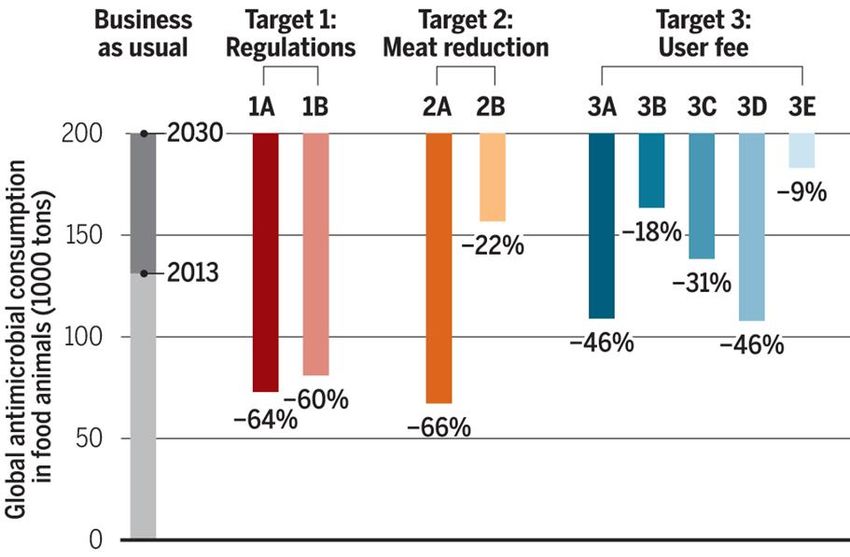
Global targets for reduction

Van Boeckel et al. 2017, Science.
Global Surveillance of AMR in Animals

 Global distribution of antimicrobial resistance from 821 points prevalence surveys

Van Boeckel, do Couto Pires, et al, in prep
Thank You
thomas.van.boeckel@gmail.com

Center for Disease Dynamics, Economics & Policy
Ramanan Laxminarayan, Charlie Brower, Emma Glennon, Julia Song

Swiss Federal Institute of Technology Zurich
Joao do Couto Pires, Sebastian Bonhoeffer

Department of Ecology and Evolutionary Biology
Bryan Grenfell, Simon Levin, Aude Teillant, Dora Chen

Food and Agriculture Organization of the UN
Tim Robinson
QUESTIONS
ANIMALS
Putting things in perspective
Meat consumption (FAOSTAT 2016)

 10g / day 190g / day 260g / day
Shifting to intensive production (2010-2030)
 In each country, the proportion of animals raised extensively is correlated with GDP per capita.
Proportion of extensively raised chickens

 2010
 2010
 log GDP per capita c. $ 2.9
 % extensive c. 83 %
 2030
 log GDP per capita c. $ 3.8
 % extensive c. 18 %
 2030

 Log per-capita GDP (US$/person/year)
 From World Bank data Gilbert, Van Boeckel et al et al. PLoS ONE, 2015
Aquaculture

 Salmon
Limitations

 SALES Extrapolation
38 OECD Countries 220 Countries

The good examples Antimicrobial Consumption
 Since 2013… ≠
 Burden of livestock-
 associated resistant
 … Infections
0
 5
 10
 15
 20
 25
 30 %
 Year

 1930
 1932
 1934
 1936
 1938
 1940
 1942
 1944
 1946
 1948
 1950
 1952
 1954
 1956
 1958
 1960
 1962
 1964
 1966
 1968
 1970
 1972
 1974
 1976
 1978
 1980
 1982
 1984
 1986
 1988
 1990
 1992
 1994
 1996
 1998
 of disposable personal money income in the U.S.

 2000
 2002
 2004
 Food expenditures by families and individuals as a share

 2006
 2008
 2010
 2012
 9%

USDA Economics Research Service
Food Products
 Switzerland Vietnam
 Multi-Resistance

 Kenya

 Thailand

Colombia

 ARCH-Vet Report, Thai et al 2012, Tu et al 2015, Odwar et al 2014, Donado-Godoy 2015 et al.
Easy target: growth promoters

 The Economic Costs of Withdrawing Antimicrobial Growth Promoters
 from the Livestock Sector. Ramanan Laxminarayan, Thomas Van Boeckel,
 Aude Teillant.2015

 1.3 - 3% (Global Meat Production US$)

 Economics of Antibiotic Use in U.S. Livestock Production.
 Sneeringer et al. 2015

 1 - 3% (U.S. Market level)
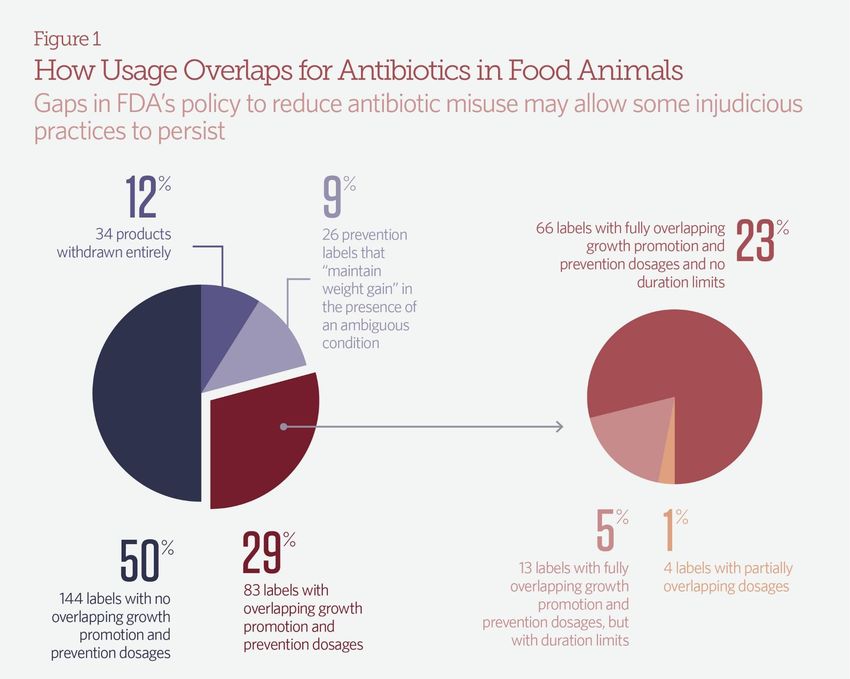
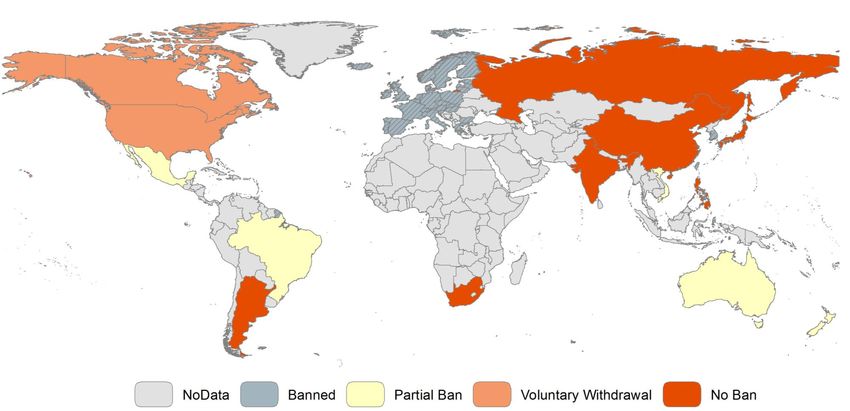
Easy target: growth promoters

 EU: Ban on antimicrobial used
 as growth promoters in 2006.

 USA. 2013-2015. Volunteer
 withdrawal of drug labels for
 “production purpose” from drug
 manufacturers, and end OTC. Objective:
 end growth promotion, but partial
 loopholes subsist.

 China. April 2018, statement
 from the Director of Veterinary
 Bureau of the Ministry of
 Agriculture and Rural Affairs “Drugs Used
 as In-Feed Additives Will Be Totally
 Withdrawn By 2020”.
Teillant, Van Boeckel et al 2015. OECD Report
National Agenda- Netherlands

 Hygiene Housing quality

 Contact (outsiders) Health consultancy (nutrition)
HUMANS
Scientific consensus ?
 1. What is the share of human AMR attributable to animals?
 Impossible to say.
 Direct Infection Genetic Transfer

 2. Most public health scientists and WHO recommend reducing
 overall antimicrobial use and prophylactic use in animals.
 3. Most public health scientists and WHO recommend growth
 promoters should be phased out.

WHO guidelines on use of medically important antimicrobials in food-producing animals 2017, Tang et al 2017.
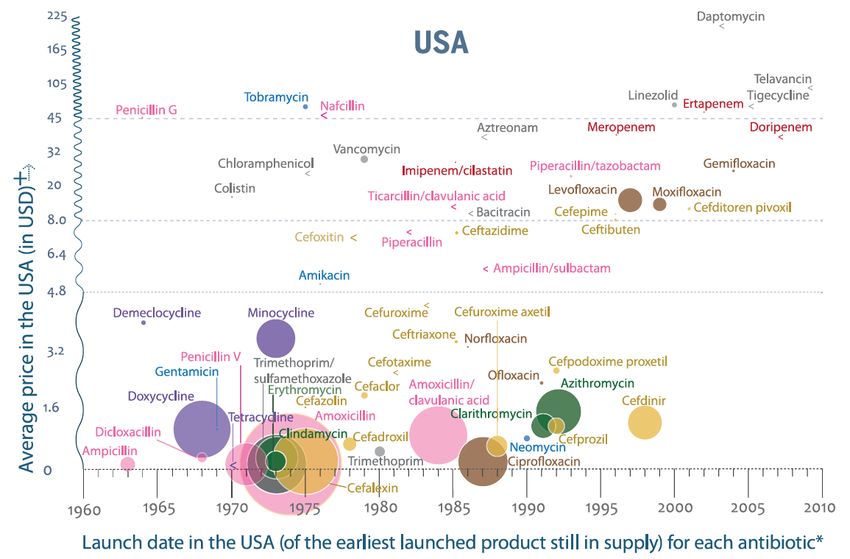
We just need new antibiotics!

Sure but…

 1960 2016
Economic incentive for conservation…

 R&D costs
 new antibiotic
 1-2 billions

Laxminarayan 2014. Science
Demonstrating the obvious ?
Yes, but…
 Crude infectious disease mortality rate in the U.S (100,000)
 40 states
 have health 1918 Influenza
 departments pandemic

 shortcut in medical history

 Use of chlorine First use of penicillin
 in drinking water

 Laxminarayan et al, 2007. Extending the Cure
2000

2015

Figure 1. Ranked national antibiotic consumption, defined daily doses per 1,000 inhabitants per day (DDDs per 1,000
inhabitants per day), in (A) 2000 and (B) 2015. Each bar represents the antibiotic consumption rate (DDDs per 1,000
inhabitants per day) in a single country in the specified year. The dashed lines connect countries consumption rates
between 2000 and 2015 for the LMIC countries with thr largest increases in the antibiotic consumption rate. Source:
QuintilesIMS MIDAS, 2000–2015, QuintilesIMS Inc. All rights reserved. Klein et al 2018 (in review)
Figure 2. Global antibiotic consumption by country income classification, 2000–2015. Panel A shows average per
capita antibiotic consumption in defined daily doses (DDDs) per 1,000 inhabitants per day by income group. Panel
B shows total antibiotic consumption (DDDs) by income group. The three leading consumers in each income group
in 2015 are shown separately; each bar shows total consumption in the specified year for that country or group of
countries. Source: QuintilesIMS MIDAS, 2000–2015, QuintilesIMS Inc. All rights reserved.
Legislation on antibiotics as growth promoters

 Teillant, Van Boeckel et al, OECD Report (in press)
 , = , · 1 + , ·

 ,
where is the number of living animals, , is the number of production cycles in each
production system (extensive or intensive), Y is the quantity of meat per animal (carcass weight)
obtained for each country from FAOSTAT, and is the killing-out percentage (or dressing

percentage)—that is, the ratio of carcass weight to live weight —obtained from literature
estimates 73. The last term of this equation can be interpreted as the animal weight
reconstructed from country-specific productivity figures.
Basic Copyright Notice & Disclaimer

©2018 This presentation is copyright protected. All rights reserved. You may
download or print out a hard copy for your private or internal use. You are not
permitted to create any modifications or derivatives of this presentation without
the prior written permission of the copyright owner.

This presentation is for information purposes only and contains non-binding
indications. Any opinions or views expressed are of the author and do not
necessarily represent those of Swiss Re. Swiss Re makes no warranties or
representations as to the accuracy, comprehensiveness, timeliness or suitability
of this presentation for a particular purpose. Anyone shall at its own risk interpret
and employ this presentation without relying on it in isolation. In no event will
Swiss Re be liable for any loss or damages of any kind, including any direct,
indirect or consequential damages, arising out of or in connection with the use of
this presentation.
You can also read