Gold Fields - H1 2021 results - CHRIS GRIFFITH Chief Executive Officer 19 August 2021
←
→
Page content transcription
If your browser does not render page correctly, please read the page content below
Gold Fields – H1 2021 results

CHRIS GRIFFITH
Chief Executive Officer
19 August 2021
Forward looking statement

 Certain statements in this document constitute “forward looking statements” within the meaning of Section 27A of the US Securities Act of 1933 and Section 21E of the US Securities Exchange Act of
 1934.

 In particular, the forward looking statements in this document include among others those relating to the Damang Exploration Target Statement; the Far Southeast Exploration Target Statement;
 commodity prices; demand for gold and other metals and minerals; interest rate expectations; exploration and production costs; levels of expected production; Gold Fields’ growth pipeline; levels and
 expected benefits of current and planned capital expenditures; future reserve, resource and other mineralisation levels; and the extent of cost efficiencies and savings to be achieved. Such forward
 looking statements involve known and unknown risks, uncertainties and other important factors that could cause the actual results, performance or achievements of the company to be materially
 different from the future results, performance or achievements expressed or implied by such forward looking statements. Such risks, uncertainties and other important factors include among others:
 economic, business and political conditions in South Africa, Ghana, Australia, Peru and elsewhere; the ability to achieve anticipated efficiencies and other cost savings in connection with past and
 future acquisitions or joint ventures, exploration and development activities; decreases in the market price of gold and/or copper; hazards associated with underground and surface gold mining; labour
 disruptions; availability terms and deployment of capital or credit; changes in government regulations, particularly taxation and environmental regulations; and new legislation affecting mining and
 mineral rights; changes in exchange rates; currency devaluations; the availability and cost of raw and finished materials; the cost of energy and water; inflation and other macro-economic factors,
 industrial action, temporary stoppages of mines for safety and unplanned maintenance reasons; and the impact of the AIDS and other occupational health risks experienced by Gold Fields’ employees.

 These forward looking statements speak only as of the date of this document. Gold Fields undertakes no obligation to update publicly or release any revisions to these forward looking statements to
 reflect events or circumstances after the date of this document or to reflect the occurrence of unanticipated events.

 Further details of potential risks and uncertainties affecting Gold Fields are described in Gold Fields’ filings with the Johannesburg Securities Exchange and the US Securities and Exchange Commission,
 including in Gold Fields’ Annual Report on Form-20F for the year ended 31 December 2017, Gold Fields’ Integrated Annual Report 2017 and Gold Fields’ Annual Financial Report 2017

Gold Fields | H1 2021 results | 19 August 2021                                                                                                                                                               2
2021 interim results agenda

                          H1 2021 highlights                                   Chris Griffith

                          Safety and sustainability                            Chris Griffith

                          Operations                                           Chris Griffith

                          Financials                                           Paul Schmidt

                          Salares Norte update                                 Chris Griffith

                          Conclusion                                           Chris Griffith

Gold Fields | H1 2021 results | 19 August 2021                                                  3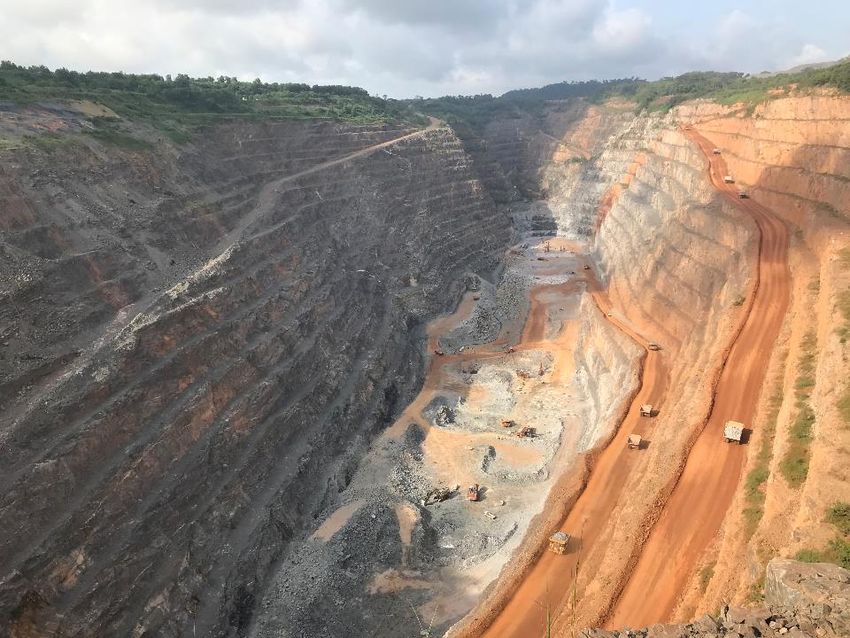
Highlights for H1 2021

                                                    Key developments

                                                    • Fatality: 1 fatality at South Deep during Q2, Vumile Mgcine
                          Safety
                                                    • TRIFR: 1.81 in H1 2021 vs. 2.58 for H1 2020 (-30% YoY)

                                                    • Renewable energy: Construction of 40MW solar plant has commenced at South Deep
                          ESG
                                                    • Shared value: US$1.9bn in value created for stakeholders in H1 2021

                          Operational performance   • Attributable gold equivalent production increased by 2% YoY to 1,104koz

                                                    • Funded all capex and FY 2020 final dividend from internal cash flow
                          Cash generation
                                                    • Free cash flow of US$180m – after spending on Salares Norte

                          Balance sheet             • Net debt to EBITDA decreased to 0.49x (End-December 2020: 0.56x)

                                                    • 33% YoY increase in normalised earnings in H1 2021 to US$431m or US$0.49 per share
                          Earnings & dividends
                                                    • Interim dividend of R2.10/share declared

Gold Fields | H1 2021 results | 19 August 2021                                                                                             4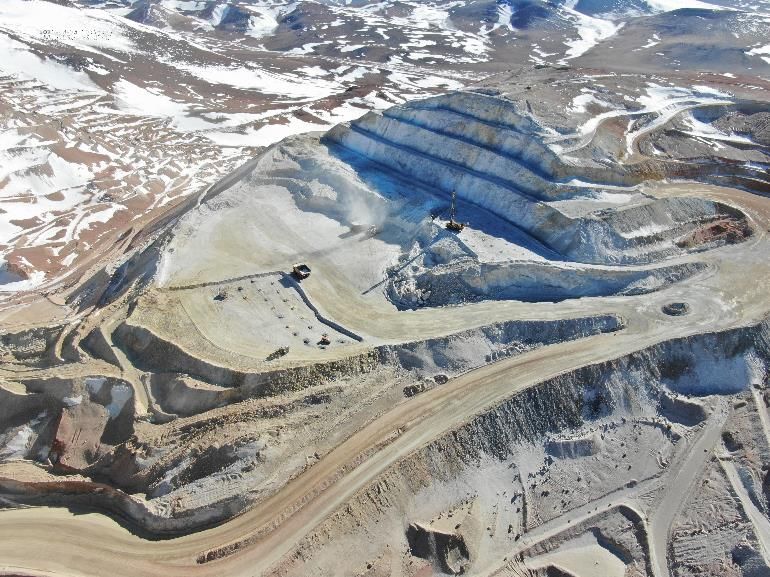
A globally diversified gold miner
                                                                                                          H1 2021 snapshot

                          Gold Fields Group
                          Mines: 9
                          Projects: 1
                          Countries: 5
                          Att. production: 1,104koz
                          AIC: US$1,274/oz
                          Mine net cash flow: US$399m inflow
                          Free cash flow**: US$180m inflow
                                                                                                   West Africa region
                                                                                                   Mines: Tarkwa, Damang and Asanko
                                                                                                   Att. production: 401koz
                                                                                                   AIC: US$1,114/oz
                                                                                                   Mine cash flow*: US$182m inflow

                                      Americas region
                                      Mine: Cerro Corona (Peru)
                                      Att. production: 99koz (Au eq)                                                                                                                 Australia region
                                      AIC: US$1,162/eq oz                                                                                                                            Mines: St Ives, Granny Smith,
                                      Mine cash flow*: US$28m inflow                                             South Africa region                                                 Agnew and Gruyere
                                      Project: Salares Norte (Chile)                                             Mine: South Deep                                                    Att. production: 481koz
                                                                                                                 Att. production: 123koz                                             AIC: US$1,189/oz
                                                                                                                 AIC: US$1,444/oz                                                    Mine cash flow*: US$160m inflow
                                                                                                                 Mine cash flow*: US$28m inflow
                       *Mine cash flow = Cash flow from operating activities less net capital expenditure and environmental payments and lease payments
                       **Free cash flow = Cash flow from operating activities less net capital expenditure, environmental payments, lease payments and redemption of Asanko preference shares
Gold Fields | H1 2021 results | 19 August 2021                                                                                                                                                                         5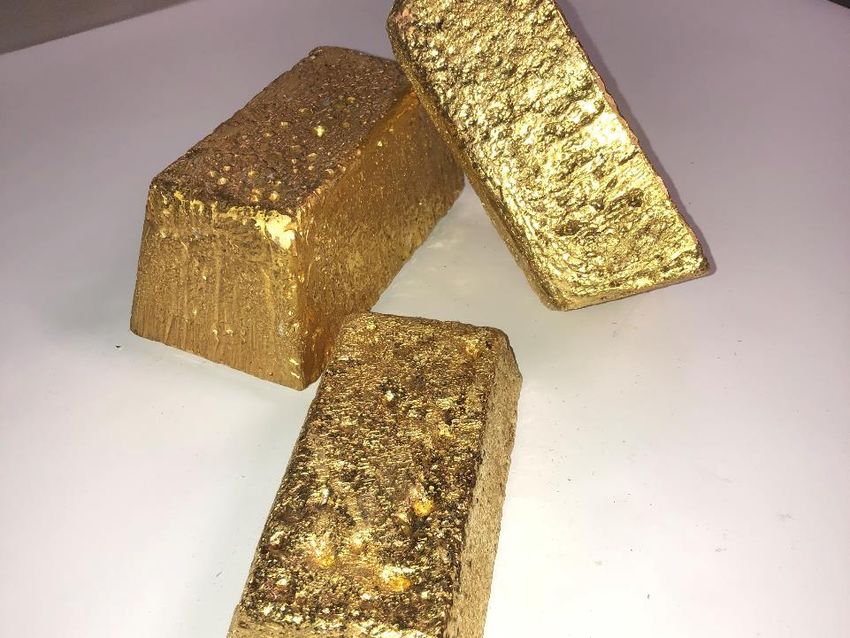
Wind turbines at Agnew

                                                 Safety and Sustainability
                                                           ESG

                     Gold Fields – H1 2021 results

CHRIS GRIFFITH
Chief Executive Officer
19 August 2021                                               Chris Griffith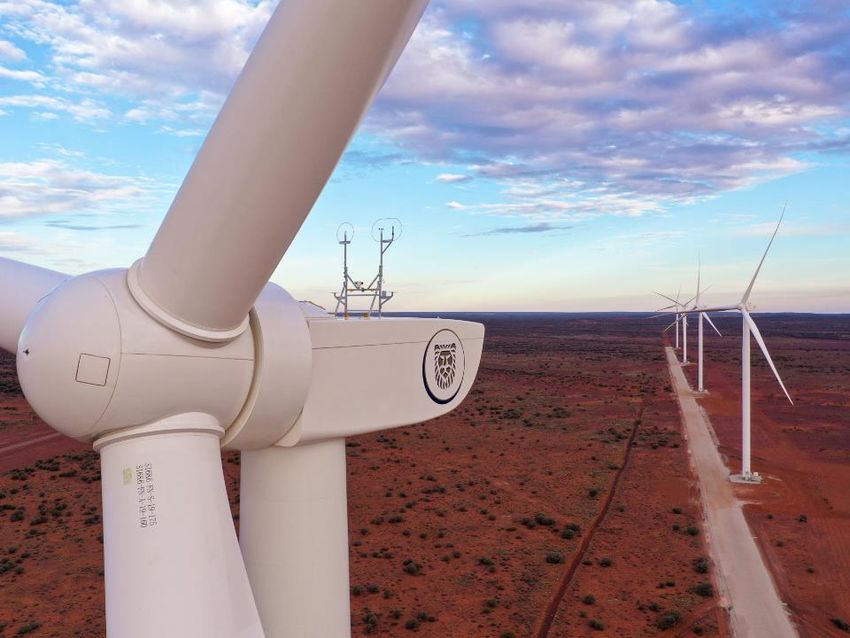
Covid-19 Update (as at 6 Aug 2021)
                                                         Americas                 Australia                South Africa                     West Africa                 Group

                            Tested                        94 849                      62                      23 829                          7 660                    126 390

                            Positive                      1 942                        -                       1 757                           801                       4 500

                            Negative                      92 907                      62                      22 006                          6 859                    121 834

                            Awaiting results                -                          -                         56                              -                         56

                            Active cases                   10                          -                         37                             45                         92

                            In hospital                     3                          -                          -                             2                          5

                            Recovered                     1 929                        -                       1 705                           756                       4 390

                            Died                            3                          -                         15                              -                         18

                                                                   Number of employees tested vs. positive test results
                                                                                                                                 9 deaths
                                               60 000                                                                                                     2 500
                                                                                             2 deaths
                                               50 000                                                                                                     2 000
                                               40 000
                                                                                                                                                          1 500
                                               30 000
                                                           1 death                                                                                        1 000
                                               20 000
                                               10 000                                                                                                     500

                                                   0                                                                                                      0       There have been 7 deaths
                                                           H1 2020                           H2 2020                             H1 2021                          due to Covid since end-June,
                                                                                                                                                                  with one occurring after 6
                                                                          Employees tested          Employees tested +ve (rhs)                                    August

Gold Fields | H1 2021 results | 19 August 2021                                                                                                                                                   7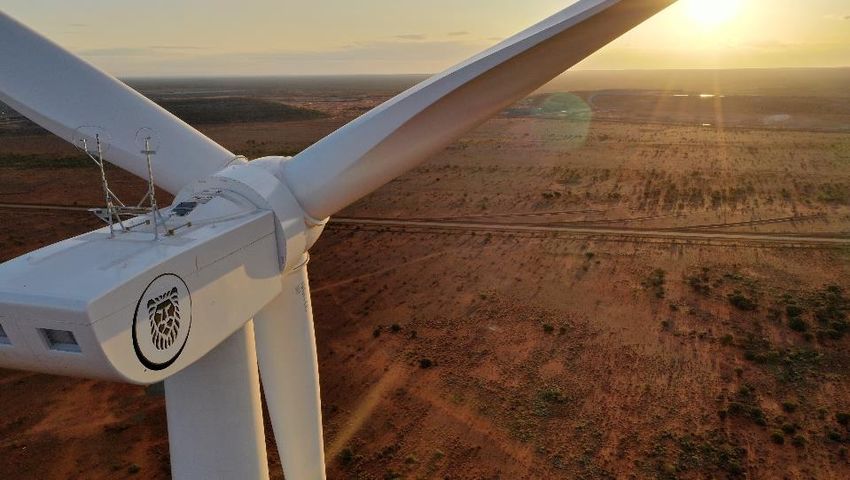
Improving safety performance
Serious & Severity rate
Safety Fatal injuries Serious and fatal injuries & severity rate
30 50
44
● 1 fatality – Vumile Mgcine, a shaft 45
25
timberman, died from injuries at South Deep 32
40
35
20 30
● 4 serious injuries during H1 2021 23
30
15 25
● TRIFR for H1 2021: 1.81 per million hours 26 17 20
10
15
worked vs. 2.58 in H1 2020 (30% 17
12 13 10
5 3
improvement YoY) 1 1 1 1
4 5
0 0
2017 2018 2019 2020 2021
Fatal injury Serious injury Severity rate
Health and Covid-19
● 19 Covid-19 related fatalities among Recordable
Total Recordable injury & TRIFR TRIFR per
injuries million man
employees and contractors to date hours
● Supporting employees, communities and 140
2,42 2,4
3
120 2,19
governments through various Covid-19 1,83 2,5
100 1,81
programmes 80
2
138 1,5
● Have commenced vaccination programme 60
99 104 107
1
among employees and contractors 40
20 42 0,5
̵ Both South Deep and Salares Norte have 0 0
to date vaccinated >80% of workforce 2017 2018 2019 2020 2021
Total Recordable injury TRIFR
Gold Fields | H1 2021 results | 19 August 2021 8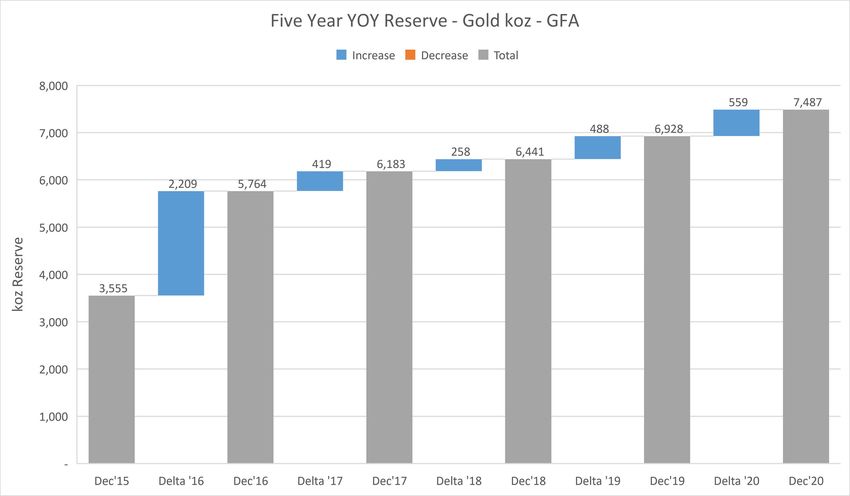
Making good progress on ESG
                       ESG Charter
                       ● Work continuing on the development of our ESG
                         strategic priorities with 2030 targets to be released
                         before year-end

                       Renewable energy
                       ● Renewable energy sources at Agnew (16MW wind,
                         4MW Solar, 18MW gas) and Granny Smith (8MW solar,
                         35MW gas) now fully implemented
                       ● Tarkwa and Damang fully converted from LPG to natural
                         gas
                                                                                        Agnew solar plant and wind turbines
                       ● 12MW Solar plant at Gruyere – operational end 2021
                       ● 40MW solar plant at South Deep – operational by Q2
                         2022

                       Environment
                       ● Recycle/reuse 74% of our water
                       ● Fresh water usage down by 12% in H1
                       ● No Level 3 environmental incidents

                       Shared value
                       ● US$1.9bn in value created for stakeholders in H1 2021
                                                                                                   Granny Smith solar plant
                                                                                                   Cerrohybrid
                                                                                                Agnew    Corona  TSF facility
                                                                                                               power  plant
Gold Fields | H1 2021 results | 19 August 2021                                                                                  9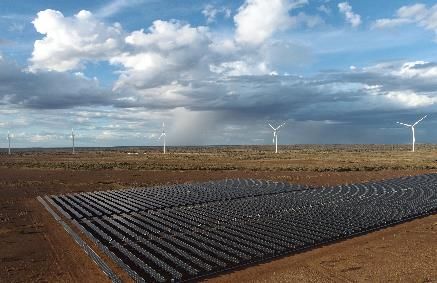
Recognition of our ESG achievements

                                                       2021: 3rd / 70 mining        Top 30 Responsible
                                                       companies                    Investment Index

                                                       2021: 13th / 114             2020: Mining and Resources
                                                       precious metals              sector award (4th year
                                                       companies                    running)

                                                                                    2020: “Good performance”
                                                       2021: BBB rating
                                                                                    in IAR Awards

                                                       2021: E 1, S 1, G 1          2020: WDP A

                                                                                    2021: Top 100 Best
                                      FTSE4Good        2021: Constituent of
                                      Index Series                                  Emerging Market
                                                       the FTSE4Good Index
                                                                                    Performers

Gold Fields | H1 2021 results | 19 August 2021                                                                   10
Logistics chain store room at South Deep
Safety and Sustainability
ESG
Operations
Gold Fields – H1 2021 results
CHRIS GRIFFITH
Chief Executive Officer
19 August 2021 Chris Chris
Griffith
GriffithGroup – Solid performance in H1 2021
koz US$/oz
Group - production and AIC
Production increased
1 400 1 400
1 200
1 000
1 200
1 000
2% YoY
800 800 1,104koz despite c.5% less
600 600 production days
400 400
200 200
0 0
H1 2019 H2 2019 H1 2020 H2 2020 H1 2021
Production AIC
Free cash flow margin
21%
H1 2021 H1 2020
Attributable production koz 1,104 1,087
AISC US$/oz 1,093 987 H1 2021 free cash flow
AIC US$/oz 1,274 1,065 US$180m
Free cash flow* US$m 180 320
at AIC of US$1,274/oz
Gold Fields | H1 2021 results | 19 August 2021 12Australia - steady operational performance
koz Australia region: Production and AIC US$/oz
Production decreased
600 1 400
500
400
1 200
1 000 3%
800
300 driven by 5% less production days
600
200
400
100 200
0 0
H1 2019 H2 2019 H1 2020 H2 2020 H1 2021
Production AIC Free cash flow margin
H1 2021 H1 2020
22%
Att. Production koz 481 494
AISC US$/oz 1,116 919
A$/oz 1,447 1,400
H1 2021 mine cash flow
AIC US$/oz 1,189 960
US$160m
A$/oz 1,542 1,463
at AIC of US$1,189/oz
Free cash flow from ops. US$m 160 208
Gold Fields | H1 2021 results | 19 August 2021 13Australia – LOM visibility greater than 10 years
Initial
Production
Reserve Reserve ● Re-investing A$80-100m/per year in
Since exploration
Mine Reserve 2020 Multiplier
Purchase
(Moz)* (Moz)*** **** ● replaced and grown reserves
(Moz)**
St Ives 2.7 9.1 2.7 4.1x ● Conversion cost at c.A$62/oz (good
Agnew 0.6 3.9 0.9 7.0x business, value creation)
Granny
0.8 2.6 2.2 5.0x
Smith
Reserve Annual Reserve Resource ● Strong +8 years LOM at St. Ives,
Mine 2020 Production LOM 2020 Granny Smith, and Gruyere on current
Moz (mined) Koz Years Moz
reserves
St Ives 2.665 415 8 4.964
● Greater Agnew Project – sustainable
Agnew 0.917 246 4.5 3.178 reserve growth outlook from resource
Granny 2.167 290 10 7.936 conversion and exploration pipeline
Smith
3.476 279 9 6.712 ● Resources Upside. Visibility on long life
Gruyere*
(+10 years) at all mines with resource
• St Ives & Agnew purchased 2002; Lawlers (added to Agnew) and Granny Smith purchased 2013
** Refer to previous reference conversion and extensional targets
*** 2020 Mineral Reserves and Resources Supplement (IAR)
**** Reserve Multiplier – (Production since purchase + 2020 Reserve – Initial Reserve)/ Initial Reserve
Gruyere JV not included as exploration only in play in 2021
Gold Fields | H1 2021 results | 19 August 2021 14West Africa - strong cash generation
koz US$/oz
West Africa region: Production and AIC
500 1 140
1 120
Production increased
5%
400 1 100
1 080
300 1 060
1 040
200 1 020 driven by increase at Damang
1 000
100 980
960
0 940
H1 2019 H2 2019 H1 2020 H2 2020 H1 2021
Production AIC Free cash flow margin
H1 2021 H1 2020
32%
Managed production koz 440 420
AISC US$/oz 1,081 1,060 H1 2021 mine cash flow
AIC US$/oz 1,114 1,093 US$182m
Free cash flow from ops. US$m 182 139
at AIC of US$1,114/oz
Gold Fields | H1 2021 results | 19 August 2021 15Americas – cash positive despite Covid challenges
koz (Au eq)
Americas region: Production and AIC
US$/eq oz Production decreased
9%
180 1 400
160 1 200
140
1 000
120
800
Impacted by Covid and slope
100
80 600
instability
60
400
40
20 200
0 0
H1 2019 H2 2019 H1 2020 H2 2020 H1 2021
Production AIC
Free cash flow margin
H1 2021 H1 2020 20%
Au Eq production koz 99 109
Au Eq AISC US$/eq oz 1,041 887
Au Eq AIC US$/eq oz 1,162 984
Au only production koz 43 64
H1 2021 mine cash flow
Cu only production kt 11 13
AISC
AIC
US$/oz
US$/oz
31
321
547
709
US$28m
Free cash flow from ops. US$m 28 49 at AIC of US$1,162/eq. oz
Gold Fields | H1 2021 results | 19 August 2021 16South Africa - continued operational improvements
koz US$/oz
South Africa: Production and AIC Production increased
140 1 800
120
100
1 600
1 400
1 200
27%
80 1 000 Notwithstanding Covid challenges
60 800
600
40
400
20 200
0 0
H1 2019 H2 2019 H1 2020 H2 2020 H1 2021
Production AIC
Free cash flow margin
H1 2021 H1 2020 19%
Att. Production koz 128 100
AISC US$/oz 1,368 1,227
R/kg 639,288 650,972
H1 2021 mine cash flow
AIC US$/oz 1,444 1,234
R/kg 674,965 654,537 US$28m
Free cash flow from ops. US$m 28 5 at AIC of US$1,444/oz
Gold Fields | H1 2021 results | 19 August 2021 17South Deep – encouraging productivity trends
t/rig/month Productivity: tons/rig/month m/rig/month Productivity: metres/rig/month
16000 14 708 90 82
14000 12 968 80 72
11 966
12000 70
60
60
10000 50
50
8000 7 040 6 708
40 33
6000
30
4000 20
2000 10
0 0
2017 2018 2019 2020 H1 2021 2017 2018 2019 2020 H1 2021
Tons/annum Gold produced kg/employee ZARm Free cash flow
Covid impact: 0.4t
10 2,2 1000
558
Covid impact: 1.0t 407
2,0 500 221
8
1,8 0
6
-500
1,6
8,8 8,7
4 -1000
6,9 7,1 1,4 -804
5,2 -1102
2 -1500
1,2
-2000
0 1,0 -1891
2017 2018 2019 2020 2021 guidance -2500
annual ave. 2017 2018 2019 2020 H1 2021
Tons/annum kg/employee kg/employee (ex-Covid)
2010 - 2016
Gold Fields | H1 2021 results | 19 August 2021 18Gold bars from the first gold pour at Gruyere
Finance
Operations
Paul Schmidt
Chris Chris
Griffith
19 August 2021 GriffithSolid Financial performance
Normalised earnings Normalised earnings Free cash flow margin
per share
0,6
+33%
US$431m 21%
0,5
0,49 +33% YoY
0,4 0,37
0,3
Interim dividend Net debt
0,2
0,1
R2.10/share US$1,097m
+31% YoY Net debt to EBITDA 0.49x
0
H1 2020 H1 2021
Gold Fields | H1 2021 results | 19 August 2021 20Strong internal cash generation
H1 2021
South Deep 28.8 Free Cash flow
US$180m
Tarkwa 115.1
Damang 66.8
Cerro Corona 27.9
After spending on Salares Norte
St Ives 134.9
Agnew 60.5
Granny Smith 50.5
Gruyere 28.4
GFA (114.2)
Free cash flow from operations 398.7
Salares Norte (148.2) Mine net cash flow
250.5
US$399m
Free cash flow from operations after projects
Interest paid (32.9)
Ghana/Peru withholding tax (15.3)
Despite higher tax payments
Other (21.9)
Free cash flow 180.4
* Cash flow from operating activities less net capital expenditure, environmental payments, lease payments and redemption of Asanko preference shares
Gold Fields | H1 2021 results | 19 August 2021 21AIC increase due to capex and exchange rates
AISC +11% YoY
US$1,093/oz
At 2020 exchange rates: US$1,002/oz (+2% YoY)
AIC +20% YoY
US$1,274/oz
At 2020 exchange rates: US$1,164/oz (+9% YoY)
FY 2021 guidance
US$1,310-1,350/oz
Unchanged
Gold Fields | H1 2021 results | 19 August 2021 22Strong cash flow leads to a healthy Balance Sheet
Available facilities at 30 June 2021
US$m
3500 Net debt to EBITDA
3000
2500
2000
0.49x
1500 down from 0.56x at Dec 2020
1000
500
0
US$ facilities Rand facilities A$ facilities Total facilities
Utilised Unutilised
Net debt
US$m
700
Maturity schedule at 30 June 2021
US$1,097m
600 marginally higher from Dec 2020
500
400
300
200
US$ revolving credit facility
100
extended post quarter-end
0
Dec 21
Dec 22
Dec 23
Dec 24
Dec 25
Dec 26
Dec 27
Dec 28
Dec 29
Gold Fields | H1 2021 results | 19 August 2021 23Salares Norte plant and camp
Salares Norte update
Finance
Operations
Chris
Chris Paul
Griffith
Schmidt
Griffith
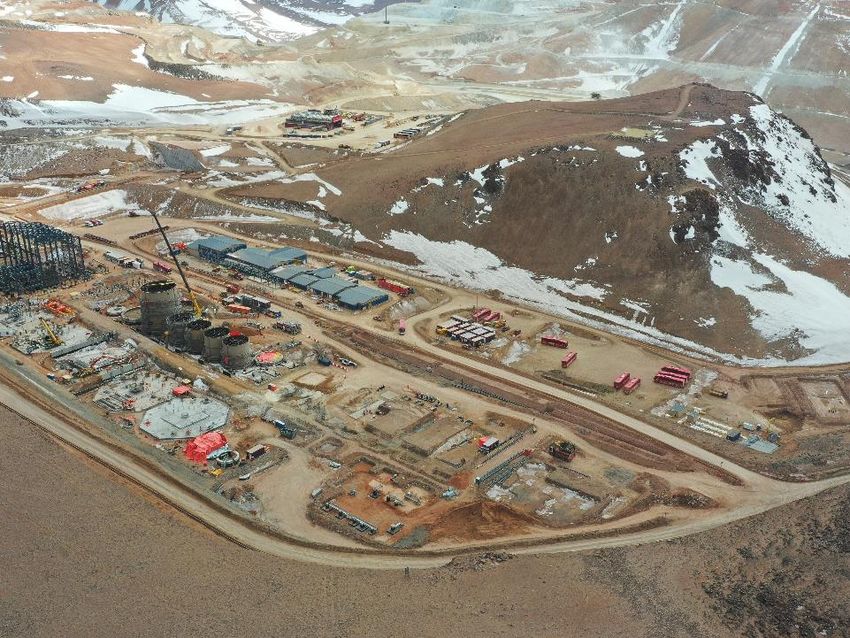
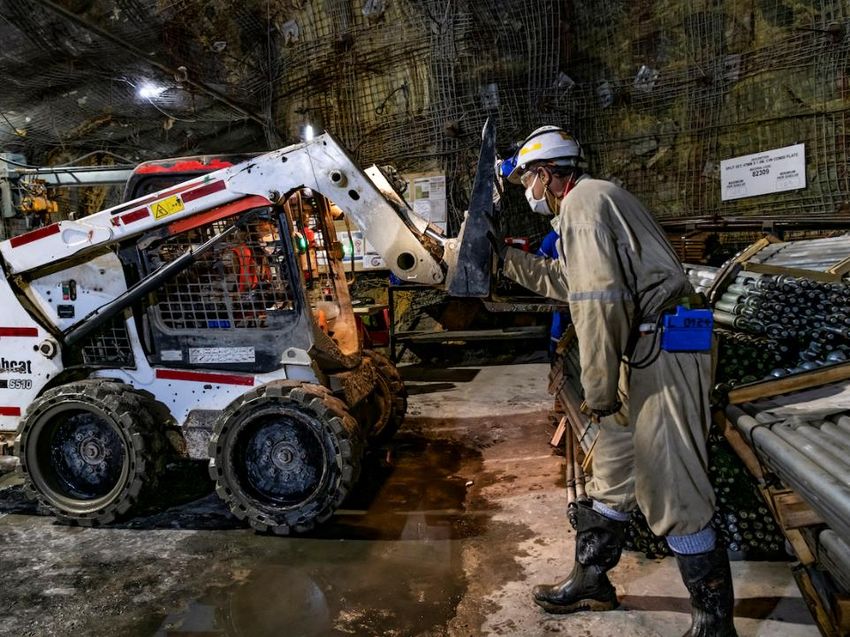
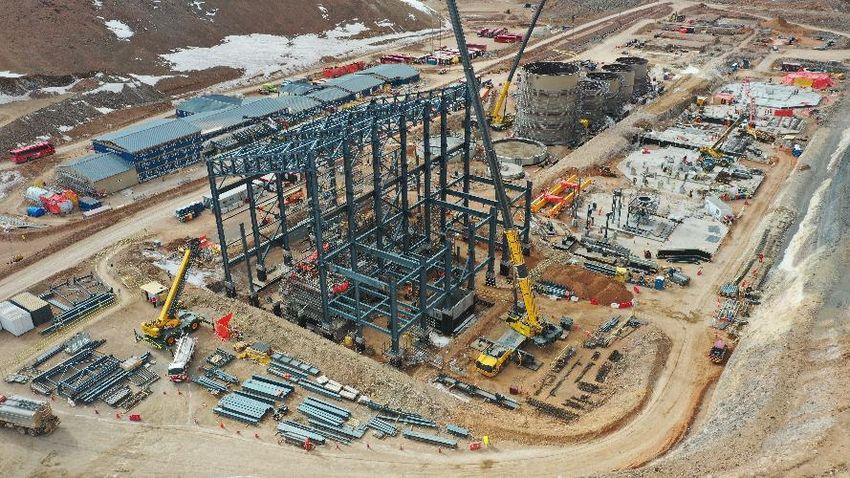
19 August 2021 Chris GriffithSalares Norte – very much on track
Key developments
• Progress: 41.9% at end-June vs. plan of 41.4%
• Total project capital to date of US$230m with US$133m spent in H1 2021
Total project
• Increased Covid cases and severe weather in June impacted project schedule
• Project on track for first production in Q1 2023
• Progress: 30.8% at end-June vs. plan of 31.1%
Construction
• Process plant construction continued to plan during H1 2021
• Progress: 8.1% vs. plan of 8.3%
• Leach and CIP tank installation progressed during H1 2021
Plant
• Sag mill, Ball mill and thickener foundation works progressed
• Structural steel installation progressed
• 6.1Mt moved to date vs. plan of 4.1Mt
Mining
• 4.3Mt of pre-strip moved in Q2 2021 vs. plan of 4.9Mt – severe weather in June main reason for shortfall
• District exploration: 12,470 metres drilled during H1 2021 vs. plan of 10,100 metres
Exploration
• US$13m spent in H1 2021 (in line with budget)
Gold Fields | H1 2021 results | 19 August 2021 25Salares Norte: progress in pictures Gold Fields | H1 2021 results | 19 August 2021 26
Salares Norte: progress in pictures

Gold Fields | H1 2021 results | 19 August 2021                                         27
Sunset over lake Lefroy, St Ives

                                                    Conclusion
                                                      Finance
                                                     Operations

                                                                    Chris
                                                                  Chris  Paul
                                                                          Griffith
                                                                               Schmidt
                                                                        Griffith
19 August 2021                                                          Chris Griffith
Gold Fields investment case
● The Gold Fields investment case is compelling for our current shareholders and for new investors
looking for exposure to a high quality, cash generative gold business
̵ Simple, pure play gold focus
̵ A well balanced portfolio – stable operations with growth
̵ Geographic diversification in attractive jurisdictions
● The reinvestment programme over the past four years has placed Gold Fields in a position where it
can maintain and even grow its production profile over the next decade
● Near-term development of Salares Norte (a world class gold asset) offers meaningful growth and
significant future cash flow potential
● Group production will grow to c.2.7Moz in 2024 with the ramp up of Salares Norte – we will look at
ways of preserving the value we have created beyond this point
Gold Fields | H1 2021 results | 19 August 2021 292021 outlook and guidance
On the back of a solid H1 2021…
FY 2021 Group guidance unchanged
● Attributable equivalent gold production: 2.30Moz – 2.35Moz
● AISC: US$1,020/oz – US$1,060/oz
● AIC: US$1,310/oz – US$1,350/oz
● AIC (excl. Salares Norte): US$1,090/oz – US$1,130/oz
Focus areas for H2 2021
● Continue to navigate Covid-19
● Deliver to construction schedule at Salares Norte
● Maintain focus on capital discipline and capital allocation
● Provide detail on ESG priorities and targets
Gold Fields | H1 2021 results | 19 August 2021 30Damang Pit
Thank You
Thank you
Finance
Operations
Chris
Chris Paul
Griffith
Schmidt
Griffith
19 August 2021 Chris GriffithAppendix 1: Cost breakdown per region – H1 2021
Australia Ghana Peru South Africa Group
Salaries & wages 21% 16% 19% 36% 22%
Mine contractors 33% 47% 41% 13% 35%
Consumable stores 12% 20% 15% 28% 18%
Utilities 7% 6% 6% 12% 8%
Other 26% 11% 19% 11% 18%
Gold Fields | H1 2021 results | 19 August 2021 32Appendix 2: 5-year Reserve growth in Australia
Note: Gold Fields acquired 50% of Gruyere in 2016
Gold Fields | H1 2021 results | 19 August 2021 33You can also read