GRAND REOPENING: NEW OPPORTUNITIES, OLD RISKS - Allianz Research June 9, 2021 - Euler Hermes
←
→
Page content transcription
If your browser does not render page correctly, please read the page content below

©Mārtiņš Zemlickis
                       Textmasterformat bearbaiting

GRAND
REOPENING:
NEW
OPPORTUNITIES,
OLD RISKS

Allianz Research
June 9, 2021

 © Copyright Allianz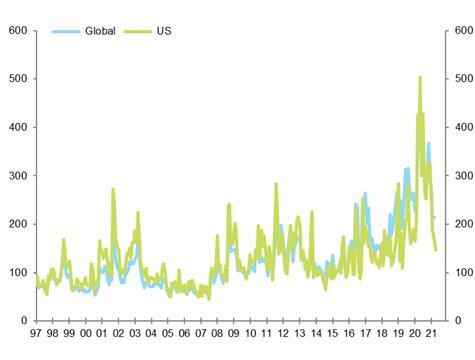
Textmasterformat bearbaiting

EXECUTIVE SUMMARY
Message #1: Vaccine security to shape Grand Reopening. While advanced economies delivered on immunization campaigns, vaccine hesitancy and second generation vaccines are first-
order priorities. In the meantime, under-vaccination in Asia and in Emerging Markets may cause desynchronized growth paths.

Message #2: Multi--faceted recovery – High-pressure economics in the US, low pressure economics in Europe. We expect global GDP to grow by +5.5% in 2021, with the US being a
clear outperformer. In Europe, the return to pre-crisis levels will take an extra six months and to the pre-crisis growth trend an extra four years – if it happens.

Message #3: Revenge spending is happening but residual savings to amount to EUR500bn in Europe, and USD1trn in the US. Consumption will lead the recovery but hoarding
behaviors remain for precautionary reasons, complicating policy choices down the road.

Message #4: Inflation, what inflation? Bottlenecks in terms of supply (raw materials, transportation capacity, workers) will likely keep cost inflation at a five-year high until the end of
2021. Companies’ pricing power remains limited, notably in Europe. Households’ purchasing power will be under pressure as the employment gap (4 million jobs in the Eurozone and 10 million
in the US) will keep wage inflation in check. No monetary inflation as velocity of money is at a record low.

Message #5: Markets’ risk-on music keeps on playing but mind endogenous financial instabilities. We adjusted on the upside our forecasts for most asset classes to reflect the grand
reopening and strong policy mix support but the risk and magnitude of a correction have increased in the meantime, reflecting growing imbalances.

Message #6: Faustian pact between expansionary fiscal and monetary policies to stay. We expect central banks to be patient before hiking rates in 2023 (some exceptions: Norway, New
Zealand, the UK by September 2022). Total global debt has increased by more than USD24trn between Q4 2019 and Q4 2020, including USD12trn of public debt and USD12trn of private
debt. Emerging Markets are more exposed to a sudden shift in market sentiment, imposing a disorderly adjustment of currencies and debt.

Message #7: Political crossroads ahead for Europe but no repeat of 2012 crisis in 2022. In the Eurozone, the Next Generation EU fund and the ECB will support the recovery and keep
financial stress at bay while German-French elections may create policy surprises. Yet, watch out for heterogeneity.

Message #8: Credit risk under control. The insolvency puzzle continues as corporate debt increased to new highs but cash on balance sheet did too, and liquidity support to firms continue
into 2022. European non-financial companies have to increase on average their margin by 1.5 pp in order to make their debt sustainable

Message #9: Green is the new black of industrial policy. The transition towards a cleaner model of growth will require the definition of a real new industrial consisting of generating new
fiscal resources, subsiding transition, protecting domestic producers and investing in infrastructure.

Message    #10: Political risk is still there amid a new US paternalism and tactical multilateralism. US-China rivalry became US+Europe v. China as President Biden ties back with Europe.
  © Copyright Allianz
US protectionism upgraded.
Textmasterformat bearbaiting
MESSAGE #1: VACCINES SECURITY MATTERS
Expected date of herd immunity Asia relapse: Sanitary situation vs. stringency & mobility
(at current vaccination speed) impact, as of end of May (bubble size = vaccine doses administered
as % of population; pink bubbles where stringency increased over past month)
1.5 EU Mexico 5
New
Argentina Indonesia South Africa
Japan 0 Zealand
South Korea
70% of adult
1 Indonesia
population Thailand
Brazil Egypt -5 Hong Kong
Stringency x Mobility
Turkey
0.5 Chile Australia Japan
USA -10 Thailand
0 -15
Vietnam
-20
-0.5 Turkey
EU Brazil
Egypt -25 Singapore Philippines
Vulnerable Japan
-1 Thailand -30 Taiwan
population Indonesia
(+65y) Mexico
USA Argentina
-1.5 Chile -35
01-21 07-21 02-22 08-22 03-23 10-23 04-24 11-24 05-25 12-25 06-26 -10 10 30 50
Daily new Covid-19 cases per 1mln people, 7-day average
Sources: Our World in Data, Duke University, Allianz Research Sources: Our World in Data, University of Oxford, Google, Allianz Research
Most countries should reach herd immunity (1st dose) by the Ultimately, vaccination is likely to determine the pace of the
summer, but demand-side hurdles will be more and more visible. return-to-normal. APAC is a case in point: many economies had
Advanced economies seem overall closer to ‘normality’, while managed the pandemic well in 2020, but they recently had to
EMs are still likely to remain ‘closed’ due to the supply gap in implement restrictions again amidst new outbreaks and low
vaccines.
© Copyright Allianz vaccination rates. 3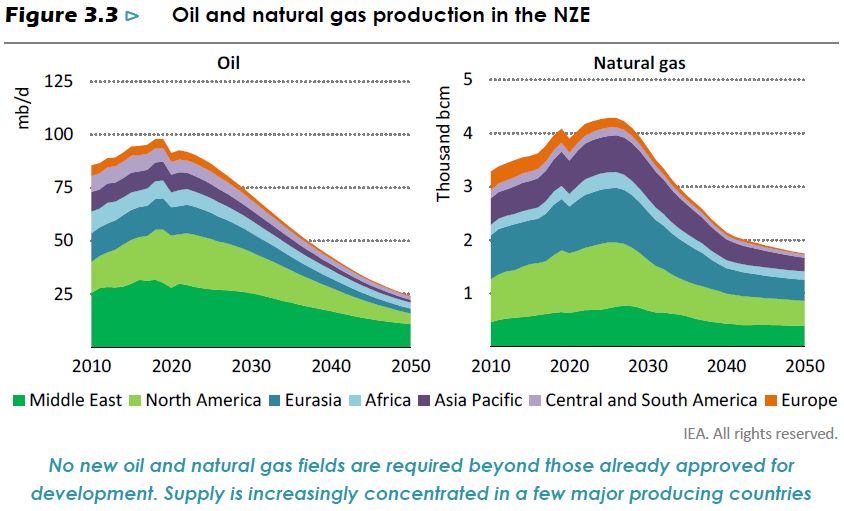
Textmasterformat bearbaiting

MESSAGE #2: MULTI-FACETED RECOVERY
                            Real GDP growth forecasts                                                                                           2022 GDP, compared to 2019 and to pre-crisis forecast
                                2019      2020      2021                                2022

World GDP growth                 2.4      -3.5          5.5                             4.1
United States                    2.2      -3.5          6.3                             4.0                                         6                                       2022 GDP higher than 2019
                                                                                                                                                                              and pre-crisis forecast
Latin America                    0.2      -7.1          5.2                             2.9                                                                                                                         Turkey

                                                                                               % change from pre-crisis forecast
                                                                                                                                    4
Brazil                           1.4      -4.4          3.8                             2.5

United Kingdom                   1.4      -9.9          6.0                             4.9                                         2
                                                                                                                                                                                    US
Eurozone members                 1.3       -6.5         4.2                             4.2
                                                                                                                                    0                        Germany Russia
Germany                          0.6       -5.1         3.4                             3.8
France                           1.5       -8.2         5.4                             3.6                                                                France                   Emerging Europe            China
                                                                                                                                    -2                                               World
Italy                            0.3       -8.9         4.4                             4.6                                                          Italy        Eurozone
Spain                            2.0      -10.8         5.1                             5.3                                                                                  Africa               Asia-Pacific
                                                                                                                                    -4            Japan
                                                                                                                                       South                                     Saudi Arabia
                                                                                                                                                                      Brazil
Russia                           2.0      -3.1          3.1                             3.2                                         -6 Africa                   UK
Turkey                           0.9      1.8           8.3                             4.1                                                                                 Latin
                                                                                                                                                     Spain                America
Asia-Pacific                     4.1      -1.1          6.3                             4.8                                         -8                          Middle East
China                            6.0      2.3           8.2                             5.4                                                2022 GDP lower                                          2022 GDP higher than
Japan                            0.3      -4.9          2.5                             1.9                                        -10      than 2019 and                                           2019 and lower than
                                                                                                                                          pre-crisis forecast                                        pre-crisis forecast
India                            4.1      -7.5          7.9                             6.4                                                                                          India
                                                                                                                                   -12
Middle East                      0.0      -5.0          2.8                             3.0                                              -5                     0             5               10                 15
Saudi Arabia                     0.3      -4.1          2.4                             2.9                                                                            % change from 2019
Africa                           1.7      -2.8          2.7                             3.5
South Africa                     0.3      -7.0          2.2                             1.9
                                                                                               Sources: various, Allianz Research
NB: fiscal year for India

© Copyright Allianz                                                                                                                                                                                                    4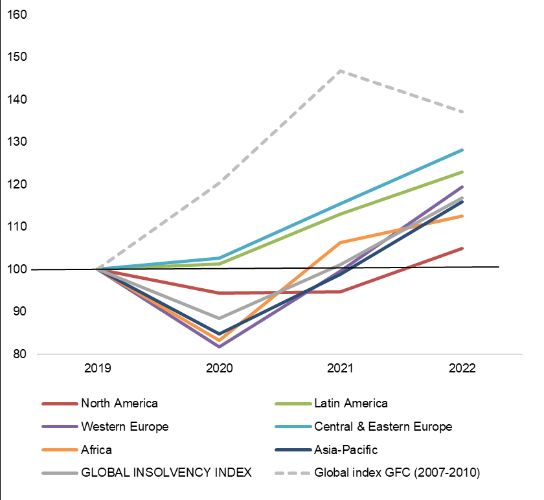
Textmasterformat bearbaiting
MESSAGE #3: REVENGE SPENDING TO ABSORB
ONLY PART OF RESIDUAL SAVINGS
US retail sales (%, y/y) Eurozone consumer confidence Catch-up consumption expected
vs retail sales growth in 2021, % of GDP
20 3.0
2%
10
2.5
0%
0
-2%
2.0
-10 -4%
1.5
-20 -6%
-8% 1.0
-30
General economic expectation over the next 12 -10%
-40 months 0.5
Financial situation over the next 12 months -12%
-50 Savings over the next 12 months -14% 0.0
Italy
Netherlands
Germany
Czechia
Austria
Norway
France
Poland
Sweden
US
UK
Spain
Belgium
Denmark
Eurozone
Portugal
Retail sales (3M yoy, rhs)
-60 -16%
11 12 13 14 15 16 17 18 19 20 21
Sources: US Census Bureau, Allianz Research Sources: US Census Bureau, Allianz Research Sources: Eurostat, Euler Hermes, Allianz Research
Demand-supportive policies more than Consumer confidence in the Eurozone is close to pre-crisis levels. The glut of household
offset the lack of automatic stabilizers in savings could generate a consumption boom of EUR170bn in 2021. Looking at individual
the short-term. Household consumption is countries, we estimate pent-up consumption could reach 3% of GDP in the US and the UK
expected to grow by +7.8% y/y in 2021 vs in 2021, and around 1.5% in most European countries. Nevertheless, roughly EUR500bn
-3.8% y/y in 2020. of Covid-19 residual savings will still remain at the Eurozone level at end-2021.
© Copyright Allianz 5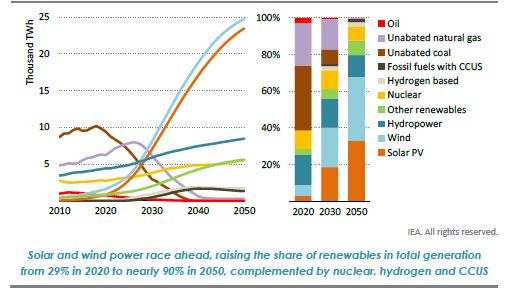
Textmasterformat bearbaiting
MESSAGE #4: CYCLICAL INFLATION IS HIGH,
STRUCTURAL ONE CONTAINED
Global inflationary pressure index Perceived output gap (latest available) Employment (in million), Eurozone vs US
12 Job conditions Taiwan Q1 2021 2.8% EZ Employment
Currencies South Korea Q1 2021 -0.2% EZ long-term trend (1995-2019)
10 Producer prices 165
China Q1 2021 -0.9%
Energy prices US employment
8 USA Q1 2021 -1.4% 160
Inflationary Pressure Index US long-term trend (1995-2019)
6 Japan Q1 2021 -3.2%
155
Canada Q1 2021 -4.1%
4 Sweden Q1 2021 -4.1% 150
2 Australia Q1 2021 -4.8% 145
France Q1 2021 -5.7%
0 140
Germany Q1 2021 -6.3%
-2 EMU Q1 2021 -6.7% 135
-4 Italy Q1 2021 -7.2%
130
Malaysia Q1 2021 -8.1%
-6 Mexico Q1 2021 125
-8.8%
Q1 1995
Q3 1996
Q1 1998
Q3 1999
Q1 2001
Q3 2002
Q1 2004
Q3 2005
Q1 2007
Q3 2008
Q1 2010
Q3 2011
Q1 2013
Q3 2014
Q1 2016
Q3 2017
Q1 2019
Q3 2020
-8 Thailand Q1 2021 -9.9%
UK Q1 2021-11.1%
-10
01 03 05 07 09 11 13 15 17 19 21 Spain Q1 2021-11.3%
Sources: IHS, Euler Hermes, Allianz Research Sources: Refinitiv, Allianz Research Sources: Refinitiv, Allianz Research
Inflationary pressures are at record high That being said, negative output gaps Despite the extension of generous furlough
levels. The good news: they are mainly driven should keep wage pressure in check. schemes, employment compared to the
by energy prices and USD appreciation, which The Covid-19 pandemic has widened long-term average is lower by around 4
should prove temporary. output gaps almost everywhere. million jobs in the Eurozone and 7 million in
© Copyright Allianz
the US, which should keep economy-wide 6
wage growth in check.Textmasterformat bearbaiting
MESSAGE #4B: MARKETS UNIMPRESSED BY
INFLATION EXPECTATIONS
US 10y yield at the upper fair value range No shift in long-term inflation expectations Inflation forecasts by region
(yield in %) (yearly inflation in %)
7.0 Eurozone core Forecast
Oversold/Overbought range 3.5 Consensus 2021 2022 2023
6% EZ headline
Fair value range (1Std.) Reuters Polls 2.7 2.3 2.2
6.0 US core
Fair value: US 10y yield Median
5% US headline
US 10y yield 3.0
5.0 China
4%
4.0
2.5
2.1 3%
3.0
2%
2.0
2.0
Range (given by term structure models*)
1.0 1%
US 10y expected inflation (model average)
0.0 1.5 -1%
2005 2007 2009 2011 2013 2015 2017 2019 2021 1999 2002 2005 2008 2011 2014 2017 2020 14 15 16 17 18 19 20 21 22
Sources: Refinitiv, Allianz Research
Sources: Refinitiv, Allianz Research * D'Amico, Kim & Wei (2018), Adrian, Crump & Moench (2013), Christensen, Sources: Refinitiv, Allianz Research
Lopez & Rudebusch (2010) and proprietary Allianz Research Model
The US 10y yield has reached the upper range of While the breakeven rise is mainly due to tight A return to 2% inflation mark is
our fair value range and have built up a short-term market conditions (TIPS liquidity premium), LT expected in most advanced economies
buffer against bad news. There is a 14% probability expectations have returned to pre-crisis levels in early 2022 when the demand-supply
for an overshoot to 2%, but his would be temporary, and don’t indicate a inflation regime shift, in mismatch should normalize.
7
being© Copyright
clearly Allianz
in the oversold range. line with consensus.Textmasterformat bearbaiting
MESSAGE #5: THE MUSIC KEEPS ON PLAYING BUT
MIND ENDOGENOUS INSTABILITIES year-end figures
Last Value
Unit Old Scenario New Scenario
(01.06.2021)
Sovereign: Despite the recent increase in long-term EMU 2021 2022 2021 2022
sovereign yields our forecasts maintain the raising path Rates
Policy rates (depo) -0.50 % -0.50 -0.50 -0.50 -0.50
described at the beginning of the year. Nonetheless, 10y yield “risk-free” sovereign (Bunds) -0.2 % -0.5 -0.3 -0.3 -0.1
starting levels have been adjusted to reflect the market 10y Swap Rate 0.1 % -0.2 0.0 0.0 0.2
Italy 10y sovereign spread 108 bps 80 100 90 90
anchor. France 10y sovereign spread 35 bps 20 30 20 30
Spain 10y sovereign spread 65 bps 50 60 55 60
Corporate Credit: Spreads have been slightly adjusted Corporate Spreads
Investment grade credit spreads 86 bps 110 120 100 120
lower as credit markets are passively range trading and we High yield credit spreads 299 bps 475 450 375 450
Equity
expect this to continue in 2021, leaving 2022 for some timid, MSCI EMU: total return p.a. 15.4 (ytd) % 6.0 6.0 11.0 6.0
but larger consolidation.
US 2021 2022 2021 2022
Equity: Equity market performance has been increased for Rates
Policy rates (mid-rate) 0.125 % 0.125 0.125 0.125 0.125
2021 as market participants are frontloading 2022 earnings 10y yield “risk-free” sovereign (Treasuries) 1.62 % 1.5 1.8 1.5 1.8
into 2021, pricing a better-than-initially-expected 2021. Corporate Spreads
Investment grade credit spreads 91 bps 110 110 100 110
Despite the revision, the high earnings expectations paired High yield credit spreads 333 bps 450 425 400 425
with slowly dissipating monetary and fiscal policies by year- Equity
MSCI USA: total return p.a. in USD 11.7 (ytd) % 1.7 6.0 8.0 6.0
end/early 2022 are setting the path for increased market
volatility. FX 2021 2022 2021 2022
USD - EUR 1.22 % 1.22 1.19 1.22 1.19
Emerging Market Fixed Income: Acknowledging the Emerging Markets 2021 2022 2021 2022
deviation between forecasts and the current figures in hard Rates
Hard Currency Spread (vs USD) 267 bps 310 350 310 350
currency spreads, we stick to them as most of the risks Local Currency Yield 4.6 % 4.8 5.3 4.8 5.3
remain in the horizon. Equity
MSCI EM: total return p.a. in USD 8.5 (ytd) % 2.8 7.0 9.0 7.0
© Copyright Allianz Sources: Refinitiv, Allianz Research 8Textmasterformat bearbaiting
MESSAGE #6: FISCAL IMPULSE TO STAY
Eurozone public debt (% GDP) US public debt (% GDP) EMs: Differential between past economic
growth and current cost of debt*
NGA
BRA
ZAF
UKR
KEN
RUS
COL
TUR
MEX
PER
CHL
IDN
IND
THA
MYS
HUN
CZE
ROU
PHL
CHN
POL
Sources: Refinitiv, Allianz Research. Sources: Refinitiv, Allianz Research. -5% 0% 5% 10% 15%
Differential Avg Coupon Avg YoY Nom. Growth 2015-2019
We still see EZ heavyweights France, Italy and Spain US public debt is expected at close to 160% * A positive differential indicates future debt sustainability risks.
boast debt ratios close to or notably above 100% of of GDP at the horizon of 2030. The Sources: Refinitiv, Allianz Research.
GDP in 2035. In contrast, Germany, Ireland and the sustainability of US public debt won't be at
Nigeria, Brazil, South Africa, Ukraine and
Netherlands cement their position as low-debt risk as the spread r-g is expected to remain Kenya face high debt rollover risks in the
countries by pushing debt notably below the 60% pretty low alongside cooperative monetary medium term.
Maastricht target by 2035. policy and resilient growth
© Copyright Allianz 9Textmasterformat bearbaiting
MESSAGE #6B: MONETARY POLICY FOR JOBS
EM: Expected number of policy rate hikes Fed's balance sheet ECB Public sector asset purchases
until mid-2022 (sorted by region) (USD bn) under PEPP & PSPP (EUR bn)
10000
180 PEPP APP Forecast
Expected Expected
Country number of rate Country number of rate 160
hikes hikes 8000
140 Beware the
China 1 Brazil 3 Hawk trap in
120 the early
India 1 Mexico 2 Mind the
100
recovery phase
Indonesia 1 Argentina 2 6000 post-PEPP
Thailand 0 Colombia 2 80 cliff edge
Philippines 0 Chile 2 in 2022
60
Malaysia 0 Peru 2 4000
Russia 2 Nigeria 3 40
Poland 2 South Africa 3 20
Romania 3 Egypt 2
2000 0
Czechia 3 Algeria 3
March
March
March
July
July
July
May
September
November
May
September
November
May
September
November
January
January
January
Hungary 1 Morocco 1 Forecast
Ukraine 2 Kenya 2
0
03 04 05 06 07 08 09 10 11 12 13 14 15 16 17 18 19 20 21 22 23 24
2020 2021 2022
Sources: National statistics, Allianz Research Sources: Fed, Allianz Research Sources: Refinitiv, ECB, Allianz Research
We expect some EMs to gradually tighten In the US, we think the Fed is at ease with a temporary overheating of the economy.
their monetary policies to fight imported It will envisage an operation twist with less MBS and more USTs from Q2 22 and
inflation (eg. Brazil, Romania, Czechia, then gradually reduce securities purchases from USD120bn per month to 0 in H2 23.
South Africa and Nigeria likely to hike three The ECB will soon have to manage the balancing act of a "dovish tapering" while avoiding a
times by mid-2022). hawk trap in Q3 (i.e. pre-committing to a lower PEPP pace in the early recovery phase) and
© Copyright Allianz prepare markets for a life after PEPP, which includes navigating the looming cliff edge 10
in
March 2022.Textmasterformat bearbaiting
MESSAGE #7: HOT FALL BUT NO 2012 FOR EUROPE
Italy: Tapering rumors weigh on spread, but risk is capped Germany: Public sector debt outstanding
(10y spread in bp)
Sources: Refinitiv, Allianz Research Sources: Refinitiv, ECB, Allianz Research
Tapering rumors weighed on BTP, but “Italexit” risk has The ECB will continue to "close spreads" in the coming quarters
vanished. Italy being firmly anchored in Eurozone acts as via PEPP and after March 2022 via APP. It will run increasingly
a cap on spreads, widening as opportunity. Systemic into German debt limits, but the ECB has another trick up its
risks only occur if political uncertainty rises. Currently, sleeve: the strategy review- We are looking for PEPP’s features
low political risk (Draghi put), but watch 2023 elections. to be rolled over to APP, in particular the flexibility around how
© Copyright Allianz
much is spent in which jurisdiction. 11Textmasterformat bearbaiting
MESSAGE #8: CREDIT RISK UNDER CONTROL
Eurozone banks' exposure to Covid-19 sectors Changes in EBITDA margin between Euler Hermes Insolvency Index, yearly
vs. return on equity (%) – as of Dec. 2020 FY2019 and FY2020, by sector at the level, base 100 in 2019
global scale
Sources: EBA, Refinitiv, Allianz Research Sources: Refinitiv, Allianz Research Sources: National sources, Euler Hermes, Allianz Research
The expected delay in insolvencies will be The sectorial asymmetry of the shock The comeback of insolvencies will be both
headwinds to Eurozone banks. Deeply depressed led to wide heterogeneity across asymmetric, due to the multi-speed
profitability rates in key economies (Germany, Italy sectors in terms of revenue and economic recovery, and gradual, due to a
and Spain) will make it harder to rebuild capital profits, with sharper drops in margin delicate but pragmatic phasing-out of support
cushions amid a still expected rise in NPLs. for sectors facing the harshest social measures.
12
Tightening credit standards on the rise.
© Copyright Allianz and mobility restrictions.Textmasterformat bearbaiting
MESSAGE #9: NET ZERO POLICY WILL REQUIRE
PROGRESSIVENSS AND A NEW INDUSTRIAL POLICY
Fossil assets will get stranded as fossil prices fall and become Designing new industrial policies started across the board
insufficient to recover OPEX. OPEC will increase its market oil
share from 34% to 52% due to low extraction costs
Allianz Research
13MESSAGE #10: POLITICAL RISK RELOADED
Textmasterformat bearbaiting
United Kingdom:
The SNP was short one seat to gain the majority at the May 2021 Scottish
Elections in Europe
parliament elections. An independence referendum remains the main political
Sep 2021: German federal elections (The Green party is high in the polls
risk to watch in Scotland and in the UK. Tensions to rise in 2022. Risk of
and should confront the CDU/CSU party to determine who is going to
increased trade tensions with EU member countries as extension on clearing
replace Angela Merkel)
houses ends in mid-2022
Apr 2022: French presidential elections (Emmanuel Macron and Marine Le
Pen are expected to face off at the second round of the elections)
US-China and US-Russia Asia-Pacific (geo)political risks to watch and elections to come
tensions Hong Kong: legislative election scheduled in Dec 2021. and Chief
Economic cold war could intensify Executive election in Mar 2022. New protests are possible
with China. Possible tensions in the Taiwan: cross-strait relations still tense, with possible interventionism of the
South-China Sea. Risk of increased U.S.
cyber threats/attacks from Russia Japan: general election in Oct 2021
with possibly more international India: presidential and state elections in 2022
sanctions to come South-Korea: presidential election in Mar 2022
Philippines: general election in May 2022
China: long-term trend of isolation of China on the international stage could
November 08, 2022 continue. Australia, India, Japan and Taiwan have been putting policies in
US: 435 seats in the House of place. Tensions in South-China Sea could increase.
Representatives and 100 seats in the Other elections: next Australian federal election before 2022, Myanmar
Senate will be contested in the mid-term presidential general election in 2022
elections scheduled in Nov 2022. Risk for
Democrats to lose full control of the
Congress Elections and (geo)political risks in Africa
Jun 2021: Ethiopian general election
Jun 2021: Algeria legislative election Middle East main elections and tension points
Aug 2021: Zambian general election Iran: presidential election scheduled in Jun 2021. Hard-liner Judiciary Chief
Dec 2021: Gambian presidential election Ebrahim Raisi is seen as the clear frontrunner to success the moderate
Latin America (geo)political risks to watch and elections Dec 2021: Libyan presidential election President Rouhani. Possible heightened tensions with Israel and Saudi-
to come General risks: vaccine shortages lead to a prolonged Arabia. Tensions in the strait of Hormuz.
Brazil: protests to impeach Bolsonaro and general election sanitary crisis with renewed waves and new virus Lebanon: general election scheduled for May 2022. Political uncertainties
in Oct 2022 variants. Risk of social unrest fueled by increased and potential new proxy war between Saudi and Iran. The economic crisis
Peru: general election run-off between the populist candidate poverty and youth unemployment could deepen should Lebanon not restore international creditors trust
P.Castillo and K. Fujimori in June 2022. Policy discontinuity if
Yemen: civil war
Castillo is elected
Israel: resurgence of tensions between Palestinians and Israelis in the
Colombia: Fiscal reform dilution and social unrest
occupied territories
Source: Euler Hermes, Allianz Research
© Copyright Allianz 14Textmasterformat bearbaiting APPENDIX 1 – MACROECONOMIC OUTLOOK © Copyright Allianz
COVID-19: CLOSER TO ‘NORMALITY’ IN ADVANCED
Textmasterformat bearbaiting
ECONOMIES
Expected date of herd immunity Pandemic risk vs sanitary restrictions
(at current vaccination speed)
900
1.5 EU Mexico Emerging Economies Argentina
800
(reproduction rate * new cases per million)
Argentina Indonesia South Africa Advanced Economies
Japan
70% of 1 700
adult Thailand
Brazil Egypt
population Turkey 600
0.5 Chile
Pandemic risk
USA
500
0 400 Chile
Brazil
300
-0.5 EU Brazil Turkey Denmark
Sweden Canada
Egypt 200
Belgium
Greece France India
Turkey
Vulnerable-1 Japan Netherlands
Thailand Switzerland
Finland
Spain
population Indonesia 100 South Africa
Mexico Czechia
Japan
Thailand UK Taiwan Germany
Austria
(+65y) Mexico Israel
Poland Indonesia
Morocco
China Italy
Chile USA Argentina
Slovakia United States
Australia
-1.5 0 South Korea Singapore
01-21 07-21 02-22 08-22 03-23 10-23 04-24 11-24 05-25 12-25 06-26 30 40 50 60 70 80 90
Sanitary restrictions (stringency index)
Sources: Our World in Data, Duke University, Allianz Research Sources: Our World in Data, Euler Hermes, Allianz Research
Most countries are expected to reach herd immunity (first dose) Emerging Markets lagging in opening as pandemic situation
by summer but demand-side hurdles will become more and more remains challenging. Diversion among advanced economies
visible. Emerging Markets still likely to remain ‘closed’ given the with some remaining cautious despite improving pandemic
supply gap in terms of vaccination. data while others open more quickly.
© Copyright Allianz 16Textmasterformat bearbaiting
GLOBAL DEMAND: FROM K-SHAPE TO V-SHAPE
Mobility data, level compared to pre-crisis Container traffic volumes
(12m/12m)
20 Germany France United Kingdom 20% North America to Asia
10 United States Italy Spain Europe to Asia
0 15% Asia to North America
-10 Asia to Europe
-20 10%
-30
-40 5%
-50
-60 0%
-70
-80 -5%
-90
02-20
03-20
04-20
05-20
06-20
07-20
08-20
09-20
10-20
11-20
12-20
01-21
02-21
03-21
04-21
05-21
-10%
2016 2017 2018 2019 2020 2021
Sources: various, Euler Hermes, Allianz Research Sources: Bloomberg, Euler Hermes, Allianz Research
Mobility has picked up strongly over the course of May The US is indeed the driving force of the recovery,
and should continue to recover significantly in June but this is also capturing a lot of the global
amid greater re-openings in most European countries. transportation capacity, with container prices at a
record 5-year high.
© Copyright Allianz 17Textmasterformat bearbaiting
GLOBAL INVESTMENT:
GREEN LIGHT FOR A STRONG CYCLE
Increase in non-financial corporates’ total deposits, Baseline forecast of business investment growth
(2020, % of GDP) (current LCU)
8%
7%
6%
5%
4%
3%
2%
1%
0%
Germany
UK
Italy
Belgium
US
Netherlands
France
Spain
Sources: national, Euler Hermes, Allianz Research Sources: national, Euler Hermes, Allianz Research
Corporates’ excess cash positions accumulated in 2020 In the short run, a demand catch-up and the reduction in spare
remain generous in most European countries, capacities will drive a business investment recovery. However,
at above 3% of GDP. it could take up to four years to return to long-term growth trends:
credit conditions during the recovery phase may be tighter and
excessive levels of corporate debt could limit companies’ ability to
borrow once state-support schemes are phased out.
© Copyright Allianz 18Textmasterformat bearbaiting
GLOBAL INVESTMENT: CASH-RICH SECTORS TO
HAVE MORE ACTIVE POLICES
Increase in cash positions in 2020 by size of company Cash-hoarding by sectors in main European countries*
(bn LCU) (listed companies, EURbn)
200 Big corporates SMEs
180
160
140
120
100
80
60
40
20
0
France UK Italy Germany Spain
NB: Cash of SMEs is the difference between total cash position of NFCs and cash of listed
companies. *) Selected countries: Germany, France, Italy, Spain, Belgium and the Netherlands
Sources: Bloomberg, ECB, BoE, Euler Hermes, Allianz Research Sources: Bloomberg, Euler Hermes, Allianz Research
© Copyright Allianz 19Textmasterformat bearbaiting
GLOBAL TRADE: STRONG MOMENTUM DESPITE
SHORT-TERM HURDLES DUE TO BOTTLENECKS
Global trade in goods and services, %y/y Global trade in goods & leading indicator Taiwan production shortfall vs. US &
Asia Pacific North America Eurozone input shortage
Western Europe Central and Eastern Europe
Latin America Middle East and Africa 30 54 6 Production shortfall - Taiwan
(HP-filtered) 40
World (volume) World (value) 25
15.9% 53 Input shortage - US & Eurozone
20 4 (average), rhs 30
52
13% 15
10.0% 9.5%
8.4% 10 51 20
2
8% 5 50
7.7%
6.2% 0 10
5.4% 49 0
3.8% 4.3%
3% 3.0% 2.4% -5
48 0
0.7% -10
1.8%
-15 -2
-2% 47 -10
-2.0% -1.6% -20 EH Trade Momentum 46
-25 Index (right scale) -4 Stronger
-7% -20
-8.0% Value global goods trade 45 relationship from
-30
growth y/y April 2012
-10.7% -35 44 -6 -30
-12% -9.9%
14 15 16 17 18 19 20 21 22 07 09 11 13 15 17 19 21 07 08 09 10 11 12 13 14 15 16 17 18 19 20 21
Sources: IHS, IMF, Euler Hermes Allianz Research Sources: CPB, Allianz Research Sources: IHS, AGI, Allianz Research
We expect global trade to grow by Such a strong pace of growth for full- The global supply-demand imbalance
+7.7% in volume in 2021, and by year 2021 is partly ensured by could be exacerbated in Q2 and the
+15.9% in value terms, likely driven by favorable base effects and a stronger- summer, given the new Covid-19
robust exports from APAC and strong than-expected momentum in the first outbreak in Taiwan – on which the world
imports
© Copyright in the US, Europe and China.
Allianz months of the year. However, there are has become increasingly dependent in
short-term risks. the electronics sector.Textmasterformat bearbaiting
GLOBAL SUPPLY: BOTTLENECKS CAN LAST
UNTIL YEAR-END
Assessment of stock levels, manufacturing China credit impulse and price indices
(balance of opinion)
China PPI %y/y (9m lag)
Germany France Italy Eurozone China export price index %y/y (11m lag)
35
Proprietary China credit impulse index (rhs)
30 20
25 15
20 10
15
5
10
0
5
-5
0
-10
-5
-10 -15
07 08 09 10 11 12 13 14 15 16 17 18 19 20 21 08 10 12 14 16 18 20 22
Sources: national, Euler Hermes, Allianz Research
Sources: Eurostat, Euler Hermes, Allianz Research
Companies operate at very low levels of inventories. Credit impulse has a 9-month lead over PPI prices
Longer transportation times could mean that companies and 11 months on export prices. Hence, we should
will use ‘just in case’ management of stocks in 2021-22 start to see a deceleration in price in T4 2021.
rather than the usual ‘just in time’.
© Copyright Allianz 21Textmasterformat bearbaiting
INFLATION: THE CYCLICAL PART IS HIGH,
THE STRUCTURAL ONE REMAINS CONTAINED
Global inflationary pressure index Income money velocity (100 = Q4 2019)
12 Job conditions Currencies Producer prices 105
Energy prices Inflationary Pressure Index
10
100
8
6 95
4
90
2
0 85
China M2
-2
80 Japan M2
-4 EMU M3
UK M4
-6 75
US M2
-8 US MZM
70
Q4 2019 Q1 2020 Q2 2020 Q3 2020 Q4 2020 Q1 2021
-10
01 02 03 04 05 06 07 08 09 10 11 12 13 14 15 16 17 18 19 20 21
Sources: IHS, Euler Hermes, Allianz Research Sources: Refinitiv, Allianz Research
Inflationary pressures are at record high levels. The good news: Usually forgotten in the inflation equation, velocity is as important
they are mainly driven by energy prices and USD appreciation as the amount of money. Surprisingly, the money velocity in the
which should prove temporary. US is the one that recovered less since pre-crisis levels. Or, put
differently, a recovery in money velocity could push inflationary
pressures.
© Copyright Allianz 22Textmasterformat bearbaiting
INFLATION: SWITCHING FROM EXCESS SUPPLY TO
EXCESS DEMAND WITH BOTLENECKS
Catch-up consumption expected in 2021, Real GDP growth
% of GDP US China Euro area UK
(q/q) (y/y) (q/q) (q/q)
3.0
2019
0.6% 6.0% 0.2% 0.3%
2.5 average
2.0 Q1 1.6% 18.3% -0.6% -1.5%
1.5 Q2 2.2% 7.3% 1.8% 4.0%
2021
1.0 Q3 1.7% 4.8% 2.0% 2.5%
0.5 Q4 1.5% 3.9% 1.0% 0.5%
0.0
Q1 0.6% 4.3% 0.8% 1.1%
Belgium
France
Norway
Portugal
Italy
Poland
Austria
Denmark
US
UK
Spain
Netherlands
Germany
Czechia
Sweden
Eurozone
Q2 0.6% 5.1% 0.8% 0.5%
2022
Q3 0.5% 6.1% 0.7% 0.8%
Sources: Eurostat, Allianz Research Q4 0.9% 5.9% 0.6% 1.1%
Pent-up consumption in 2021 could reach 3% of GDP A strong rebound in GDP growth is expected,
in US/UK and 1.5% in most European countries in much above potential, but this should be
2021. However residual savings at end-2021 will temporary. Europe will return to low pressure
remain 40% above pre-crisis levels and will need to be once it reaches pre-crisis levels in Q1 2022
directed into productive growth
© Copyright Allianz 23Textmasterformat bearbaiting
INFLATION: LIVING WITH HIGHER INFLATION MEANS
LOWER MARGINS AND PURCHASING POWER
Assessment of shortages and selling price European companies’ pricing power Nominal wage growth (%)
expectations by firms, by sector (Europe) Eurozone
Risk on
profitability
Pricing
due to input
Shortage in factor of production - compared to Power
prices
pre covid levels (*) Selling price
Electricity
Material, equipment & expectations (**)
Labor
space Pharmaceuticals
Wood & related 4 25 61 Computers
Paper & related 1 18 61 Consumer
Basic metals 2 8 51
Electronics
Furniture 0 22 47 Food & non-alcoholic
Rubber/plastics 0 32 43
beverages
Coke and refined products -2 19 40
Tobacco
Fabricated metal products 3 17 37
Electrical equipment 8 27 36 Wines from grapes
Textiles 4 5 35 Automobile
Machinery/equipment -1 14 32 Household
Chemicals -1 16 30 Appliances
Other non-metallic mineral 1 7 30 Diesel/Petrol
Food -4 -1 24
Textile
Motor vehicles -2 30 18
Computer/electronic -2 22 17 Printed media
Leather 3 3 14 Cleaning products
Repair/installation -4 10 13 Air transport
Other manufacturing -12 -8 13
Postal services
Construction 24 3 11
Beverages -2 -4 10 Telephone services
Pharmaceuticals -6 -9 4 Restaurants, cafés
Wearing -2 1 4 and the like
Other transport equipment -7 -10 4 Accommodation
Printing 0 6 3 services
(*) Q2’21 vs. to Q4’19 levels; (**) As of May 2021 surveys
Sources: Eurostat, Euler Hermes, Allianz Research Sources: Allianz Research Sources: Allianz Research
Input shortages are particularly acute in the Indeed, the rise in input prices is not being Wages are likely to rise in those sectors
automotive and computer/electronic sectors transferred onto output prices. We find that that face labor shortages. However we don't
(semiconductors!). Surveys find that selling European companies in particular are most expect a blanket boost with total wages
prices could rise in Europe going forward, at risk, having limited pricing power for now. galloping out of control.
alleviating some pressure from cost inflation.
© Copyright AllianzTextmasterformat bearbaiting
INFLATION: NEGATIVE OUTPUT GAPS
WILL KEEP WAGE PRESSURE IN CHECK
Perceived output gap (latest available) Sectoral wages in Europe (% total)
Taiwan Q4 2020 0.3%
China Q1 2021 -0.9%
USA Q1 2021 -1.4%
South Korea Q4 2020 -2.0%
Japan Q1 2021 -3.2%
Canada Q4 2020 -5.1%
Sweden Q4 2020 -5.4%
France Q1 2021 -5.7%
Australia Q4 2020 -6.0%
Germany Q1 2021 -6.3%
EMU Q1 2021 -6.7%
Italy Q1 2021 -7.2%
Malaysia Q1 2021 -8.1%
Mexico Q4 2020 -9.0%
Thailand Q1 2021 -9.9%
UK Q1 2021 -11.1%
Spain Q1 2021 -11.3%
-14% -12% -10% -8% -6% -4% -2% 0% 2%
Sources: Refinitiv, Allianz Research Sources: Refinitiv, Allianz Research
Covid-19 has not helped close the gap between countries, but Structural shortages have been exacerbated by the crisis,
rather widened it. While the UK had to deal with Brexit and particularly in growth sectors that underpin the digital & green
Covid-19 almost at the same time, others have suffered more transition. Construction should receive some tailwind from
due to sector composition (Spain, Thailand). public investment plans (incl. when powered by NGEU).
© Copyright Allianz 25Textmasterformat bearbaiting
INFLATION: GRADUAL MONETARY TIGHTENING IN
THE EMERGING MARKETS
EM: Inflationary and monetary policy pressures EM: Expected number of policy rate hikes until mid-2022
(sorted by region)
8
7 Countries more NGA Expected Expected
likely to hike Country number of rate Country number of rate
Current inflation vs. 2019 average (pp)
6 policy rates in the
next 12 months hikes hikes
5
MYS China 1 Brazil 3
4 BRA
India 1 Mexico 2
3 MEX THA
PHL POL RUS DZA Indonesia 1 Argentina 2
2
CHL HUN Thailand 0 Colombia 2
1 ZAF
UKR PER CZE IND Philippines 0 Chile 2
0 KEN
ROU MAR
Malaysia 0 Peru 2
-1 COL
CHN Russia 2 Nigeria 3
IDN
-2
Poland 2 South Africa 3
-3 Romania 3 Egypt 2
EGY
-4 Czechia 3 Algeria 3
-400 -300 -200 -100 0 100
Hungary 1 Morocco 1
Net policy rate change since pre-Covid-19 (bp)
Ukraine 2 Kenya 2
Sources: National statistics, Allianz Research Sources: Allianz Research forecasts
© Copyright Allianz 26Textmasterformat bearbaiting
CORPORATES: ABSORBING COVID-19 DEBT
REQUIRES AMBITIOUS FISCAL REFORMS
Annual change in NFC debt – annual change in What is needed to absorb Covid-19 corporate debt?
NFC margins
25% France Germany UK USA
Increase Increase
Increase Change in LT annual Maximum Year of
needed in in
20% in debt in operating average historical maximum
gross margins
2020, pp surplus increase in annual annual
operating needed
of GDP (EURmn) margins increase increase
15% surplus, % (pp)
10% Germany 5.0 2.7 19 1.0 0.0 1.8 (2006)
France 14.3 7.7 27 2.4 0.0 1.8 (2019)
5% UK 6.3 3.4 15 1.2 -0.2 1.4 (1996)
Belgium 9.4 5.1 5 2.1 0.2 2.4 (2010)
0%
Netherlands 3.9 2.1 4 0.9 0.1 1.7 (2005)
-5%
Italy 8.6 4.6 15 2.0 -0.4 1.8 (2016)
-10% Spain 10.0 5.4 13 2.2 0.1 1.6 (2007)
11/89
09/00
07/11
03/81
05/83
07/85
09/87
01/92
03/94
05/96
07/98
11/02
01/05
03/07
05/09
09/13
11/15
01/18
03/20
Sources: Bank of France, BIS (until Q3 for Belgium and Netherlands), Euler Hermes, Allianz Research
Sources: Euler Hermes, Allianz Research If nothing is done, and supposing stable interest expenditures,
Most companies across advanced economies Covid-19 corporate debt can be absorbed only in 5 years time in
have less buffers as their debt levels increased most European countries. Hence, boosting corporates’ self-
faster compared to their margins over the past financing capacity through fiscal reforms could improve debt
decade.
© Copyright Allianz
sustainability and avoid a premature deleveraging process. 27Textmasterformat bearbaiting
INSOLVENCIES: 1 OUT OF 2 COMPANIES IN WESTERN
EUROPE SAVED BY THE STATES
2020 GDP growth and insolvencies in Western Europe 5-year cumulated number of quarters during which GDP
growth is below average by two standard deviations
Germany United Kingdom
5.0
United States
4.5
4.0
3.5 Germany
3.0
2.5
2.0
US
1.5
UK
1.0
0.5
0.0
12/61
04/78
08/94
12/10
10/53
11/57
01/66
02/70
03/74
05/82
06/86
07/90
09/98
10/02
11/06
01/15
02/19
Sources: national, Allianz Research
Frequency and severity of economic shocks
Sources: National sources, Euler Hermes, Allianz Research increased over time.
© Copyright Allianz 28Textmasterformat bearbaiting
BANKS: THE RISK OF CRUNCHING THE RECOVERY
ECB Eurozone bank lending survey Banks' exposure to Covid-19 sensitive sectors vs. return
on equity (%) - as of Dec 2020
Sources: Refinitiv, Allianz Research Sources: EBA, Refinitiv, Allianz Research
Note: *Jan – Mar 2021
Eurozone banks have helped cushion the Covid-19 shock to The expected delay in insolvencies will pose headwinds to
the economy by providing record amounts of liquidity. Just Eurozone banks. Deeply depressed profitability rates in key
as the economy is getting ready to rebound and credit economies (Germany, Italy and Spain) will make it harder to
demand is strengthening, credit standards for the private rebuild capital cushions amid a still expected rise in NPLs.
© Copyright Allianz 29
sector are tightening.Textmasterformat bearbaiting
GLOBAL UNCERTAINTY: CONTINUED
PROTECTIONISM VS. MULTILATERALISM 2.0
Measures restraining trade Multilateral free trade agreements (underlined: interest in joining CPTPP)
(cutoff date each year on 30 April)
400
Net trade interventions (harmful
350 measures - liberalizing measures) RCEP Australia CPTPP
China Japan Chile
300 Digital policy & regulatory changes
South Korea New Zealand Peru Pacific
250 ASEAN alliance
Cambodia Mexico Colombia
200 Brunei
Indonesia
Malaysia
150 Laos
Singapore
Myanmar Vietnam
100 Philippines Canada
50 Thailand
0 US
2010
2011
2012
2013
2014
2015
2016
2017
2018
2019
2020
2021
Taiwan United Kingdom USMCA
Sources: Global Trade Alert, Allianz Research Sources: official resources, Allianz Research
Protectionist measures are still being implemented in A revival and acceleration of multilateralism may be
2021, with the US being the most active and China on the cards, particularly in the Pacific region:
and Germany the most targeted (in net terms). increased incentives for economies to join and
Regulation affecting digital commerce is also conclude free trade agreements as the US
becoming
© Copyright Allianzincreasingly apparent. reengages in global policies. 30Textmasterformat bearbaiting
GLOBAL UNCERTAINTY: A NEW US PATERNALISM
UNTIL THE MID-TERM ELECTIONS IN 2022?
Economic Policy Uncertainty index
Towards a leadership by the law
• “A family approach” by adopting a multilateral
strategy with a comeback to international
organizations and a leading role in
international discussions
• “Educating” by sanctioning in the short-term
but opening the door to improvements of
relations over the long-term with Russia and
China
• “Protecting” by continuing the America First
Policy initiated by Barack Obama and
reinforced by Donald Trump
• “Making the law” by imposing new norms at
Sources: EPU, Allianz Research
the level of digital, tax and environment
policy (a diplomacy aiming at establishing Biden's administration, until recent events in the Middle
leadership by the law) East, had contributed to attenuate global political risk.
Tactical multilateralism is the new leitmotiv of
international relations, which is less confrontational
© Copyright Allianz though this does not mean lower protectionism. 31Textmasterformat bearbaiting
POLITICAL RISK IS NOT FULLY DEAD
UK:
The SNP was short one seat to gain the majority at the May 2021 Scottish
parliament elections. An independence referendum remains the main political Elections in Europe
risk to watch in Scotland and in the UK. Tensions to rise in 2022. Risk of Sep 2021: German federal elections (The Green party is high in the polls
increased trade tensions with EU member countries as extension on clearing and should confront the CDU/CSU party to determine who is going to
houses ends in mid-2022 replace Angela Merkel)
Apr 2022: French presidential elections (Emmanuel Macron and Marine Le
Pen are expected to confront at the second round of the elections)
US-China and US-Russia Asia-Pacific (geo)political risks to watch and elections to come
tensions Hong Kong: legislative election scheduled in Dec 2021. and Chief
Economic cold war could intensify Executive election in Mar 2022. New protests are possible
with China. Possible tensions in the Taiwan: cross-strait relations still tense, with possible interventionism of the
South-China Sea. Risk of increased U.S.
cyber threats/attacks from Russia Japan: general election in Oct 2021
with possibly more international India: presidential and state elections in 2022
sanctions to come South-Korea: presidential election in Mar 2022
Philippines: general election in May 2022
China: long-term trend of isolation of China on the international stage could
November 08, 2022 continue. Australia, India, Japan and Taiwan have been putting policies in
United-States: 435 seats in the House of place. Tensions in South-China Sea could increase.
Representatives and 100 seats in the Other elections: next Australian federal election before 2022, Myanmar
Senate will be contested in the midterm presidential general election in 2022
elections scheduled in Nov 2022. Risk for
Democrats to lose full control of the
Congress Elections and (geo)political risks in Africa
Jun 2021: Ethiopian general election
Jun 2021: Algeria legislative election Middle East main elections and tension points
Aug 2021: Zambian general election Iran: presidential election scheduled in Jun 2021. Hard-liner Judiciary Chief
Dec 2021: Gambian presidential election Ebrahim Raisi is seen as the clear frontrunner to success the moderate
Latin America (geo)political risks to watch and elections Dec 2021: Libyan presidential election President Rouhani. Possible heightened tensions with Israel and Saudi-
to come General risks: vaccine shortages lead to a prolonged Arabia. Tensions in the strait of Hormuz.
Brazil: protests to impeach Bolsonaro and general election sanitary crisis with renewed waves and new virus Lebanon: general election scheduled for May 2022. Political uncertainties
in Oct 2022 variants. Risk of social unrest fueled by increased and potential new proxy war between Saudi and Iran. The economic crisis
Peru: general election run-off between the populist candidate poverty and youth unemployment could deepen should Lebanon not restore international creditors trust
P.Castillo and K. Fujimori in Jun 2022. Policy discontinuity if Yemen: civil war
Castillo is elected Israel: resurgence of tensions between Palestinians and Israelis in the
Mexico: midterm elections, legislative and local elections in occupied territories
Jun 2021
Colombia: Fiscal reform dilution and social unrest
© Copyright Allianz 32
Source: Euler Hermes, Allianz ResearchTextmasterformat bearbaiting
GERMAN ELECTIONS: EVOLUTION, NO REVOLUTION
Germany: Election poll (%) What could a Black-Green coalition (baseline scenario) entail?
50%
CDU/CSU SPD
Green party FDP Fiscal policy
40% Left party AfD • Temporary suspension & stretched interpretation of debt brake provides some room for
other tax cuts for low-income earners & SMEs as well as more public investment
(+EUR20bn/year in green, digital & education) while allowing return to the ‘green zero’ by
2023.
30% • Possibly higher taxes for top-earners, but no wealth tax
Environment
20% • Step-up in regulation – above all green – with a focus on targets i.e. acceleration of coal
exit, e-vehicle targets etc. combined with incentives & subsidies to accelerate the
transition & reduce the adjustment pain for the private sector.
• Phase out of brown subsidies with CO2 price increasingly market-based.
10%
0%
Europe
Sep/ Nov/ Jan/ Mrz/ Mai/ Jul/ Sep/ Nov/ Jan/ Mrz/ • No overhaul of EU fiscal rules, but rather prolonged suspension until 2023.
19 19 20 20 20 20 20 20 21 21 • Acceleration of EU carbon border tax & push for more EU integration (i.e. banking, capital
market & defense union).
Source: Infratest Dimpa Source: Allianz Research
Current election polls suggest three feasible coalitions to emerge from Agreeing on a coalition contract will prove challenging as
the September vote, with the Green Party a key member in all of them: positions on a number of key topics are far apart between
1) CDU/CSU & Green Party (plus the FDP), 2) CDU, SPD & Green the CDU/CSU and the Green Party (the most likely
Party, 3) Green Party, SPD & FDP. Approaching the election date, we scenario). Even under the pragmatic leadership of Baerbock
expect the governing CDU/CSU to receive more support in polls, with and Laschet a deal could take several months to be sealed,
33
progress on the vaccination front and an improvement in the outlook.
© Copyright Allianz
as agreement will require deviating from party lines.Textmasterformat bearbaiting APPENDIX 2 – CAPITAL MARKETS OUTLOOK © Copyright Allianz
Textmasterformat bearbaiting

US INFLATION: THE EXPECTATION PUZZLE
                      US 10y yield at the upper fair value range                                                  Rising breakeven don’t mean higher inflation expectations
                                       (yield in %)                                                                                       (decomposition of breakeven, in %)

     7.0                                                                                                           4.0
                                                      Oversold/Overbought range
                                                      Fair value range (1Std.)                                     3.0
     6.0
                                                      Fair value: US 10y yield
                                                      US 10y yield                                                 2.0
     5.0
                                                                                                                   1.0
     4.0
                                                                                                                   0.0
     3.0
                                                                                                                  -1.0
     2.0
                                                                                                                  -2.0
                                                                                                                                                                  US 10y inflation risk premium
     1.0                                                                                                                                                          US 10y expected inflation
                                                                                                                  -3.0
                                                                                                                                                                  US 10y breakeven inflation
                                                                                                                                                                  US 10y TIPS liquidity premium
     0.0                                                                                                          -4.0
        2005          2007   2009   2011    2013       2015       2017                              2019   2021       1999 2001 2003 2005 2007 2009 2011 2013 2015 2017 2019 2021
    Sources: Refinitiv, Allianz Research                                                                          Sources: Refinitiv, Allianz Research after D'Amico, Kim & Wei (2018)

    US 10y yield has reached the upper range of our fair                                                          A seeming paradox: High inflation discount (breakeven) with
    value range. There is a 14% probability for an overshoot                                                      negative real yield suggesting subdued economic outlook.
    to 2% until the year end. This would be temporary being                                                       Most of breakeven rise due to tight market conditions (TIPS
    clearly in the oversold range.                                                                                liquidity premium). Uncertainty about future inflation (inflation
© Copyright Allianz                                                                                               risk premium) priced in. Expectations recovered to pre-crisis                   35

                                                                                                                  level.
Textmasterformat bearbaiting
US INFLATION: THE EXPECTATION PUZZLE (II)
Inflation surveys show contained inflation fears Term structure models indicate no shift in long-term
(Consumer Price Index, in %)
expectations ...yet?
3.5
4.0
3.5
3.0
3.0
2.5 2.5
2.0
Survey Professional Forecasters 2.0
1.5 Reuters Polls (median)
Reuters Polls (max) Range (given by term structure models*)
Reuters Polls (min)
US 10y expected inflation (model average)
1.0 1.5
2021 2023 2024 2025 2027 1999 2001 2003 2005 2007 2009 2011 2013 2015 2017 2019 2021
Sources: Thomson Reuters Eikon, Refinitiv, Allianz Research Sources: Refinitiv, Allianz Research
Surveys among professional forecasters show high *after Adrian, Crump & Moench (2013), D'Amico, Kim & Wei (2018),
uncertainty about short-term inflation dynamics. Long- Christensen, Lopez & Rudebusch (2010) and proprietary Allianz
term expectations remain anchored at levels in line with Research model
the average inflation target of the Fed.
© Copyright AllianzTextmasterformat bearbaiting
EURO SOVEREIGNS : TAPERING RUMOURS
10y Bund: Catch-up to fair value Italy: Tapering rumors weigh on spread, but risk is capped
(10y yield in %) (10y spread in bp)
2% 600
10y Bund yield Total spread
Fair value estimate Default risk premium
+/- 1 Std. deviation 500 Break-up risk premium
1% 400
300
0% 200
100
-1% 0
2015 2017 2019 2021 2005 2010 2015 2020
Sources: Refinitiv, Allianz Research Sources: Refinitiv, Allianz Research
10y Bund has caught up to fair value due to economic Tapering rumors weigh on BTP, but “Italexit” risk has
momentum, spillover from US yields and strong speculative almost vanished with new European fiscal integration.
position on tapering rumors. Switch into positive territory is Italy being firmly anchored in Euro area acts as a cap on
possible (18% probability), but we would not consider it spreads, widening as opportunity. Political risk currently
sustainable.
© Copyright Allianz low, but watch 2023 elections. 37Textmasterformat bearbaiting
THIS TIME IS DIFFERENT: IT’S PAST MIDNIGHT
Minsky – Kindleberger Market Cycle Clock
Legitimate
increase in the
Lender of last expected return
The recent post-Covid-19 market frothiness has sparked claims
resort & Increased demand
increased
on capital
for & supply of
of a structural change in the functioning of capital markets.
employed
moral hazard credit (from banks
& non-banks)
Distressed selling, However, this situation is not really new! Despite having to
forced liquidation by
overextended long Declining credit concede that the tools, outreach and amplification of the equity
players quality: from
hedge finance to rally have structurally changed by the extensive use of social
Ponzi finance networks and other online platforms, most of the recent equity
Stealth turning
point rally’s characteristics are common in a “late” equity cycle stage.
Euphoria fostered by
the relaxation of the
budget constraint These include a reliance on leveraged investing to quickly
Failure of
overextended multiply gains, signs of market manipulation/fraud starting to
"rational" short
players Profits inflated by appear and, Fear of Missing Out (FOMO) effect leading to
financial leverage
overtrading, some isolated market bubbles burst, etc.
Swindles & other
criminal activities High valuations
explained by "new era", Nonetheless, despite the amounting signs of a late-late capital
new models, but not by
Unheeded warnings by credit markets cycle, the active monetary and fiscal policy intervention
officials, wise men &
some part of the media remains an unconditional put protection and should still sustain
Liquidity illusion:
Greed and adaptive increasing money the current market rally for as long as the policy tailwinds remain
expectations: "the velocity (overtrading) vs in place. Nonetheless, and due to the market fragility, a
cycle is dead", "this declining cash ratios
time, it's different"" premature exit from policy support may spook markets quickly
Sources: Adapted from Charles Kindleberger’s Manias, Panics and Crashes a
although it is not our base case.
history of financial crises, 1978, Allianz Research
© Copyright Allianz 38Textmasterformat bearbaiting
EQUITY MARKETS: RED FLAGS (I)
Long-term EPS growth expectations (in %) # of SPACs IPOs (live & in progress)
30 MSCI USA 600 Rest of the World - In Progress
MSCI Europe Rest of the World - Live
25 MSCI EM 500 US - In Progress
US - Live
20 400
15 300
10 200
5 100
0 0
1994 1997 2000 2003 2006 2009 2012 2015 2018 2021 2015 2016 2017 2018 2019 2020 2021
Sources: IBES, Refinitiv, Allianz Research Sources: Eikon Refinitiv, Allianz Research
Looking at both fundamental valuation metrics both in realized and Some overtraded equity buckets (e.g., SPAC IPOs) have already
expectations terms, equity markets look extremely expensive. In burst. This comes after a substantial acceleration in both
this context, both the US and EMs are on the extreme frothy side volumes and prices of this “new” financial instrument, which has
(even considering the latest US revision), with market consensus led to a substantial market correction once the embedded market
aiming for earnings long-term growth rates last seen in 2000 for the frothiness has slowly disappeared. As of today, more than 60%
US and close to all-time highs for EMs. Despite lagging, the of the SPAC mergers that have been announced since the start
of the year are now trading below the IPO price of their SPAC.
Eurozone has now joined its peers with earnings expectations
substantially rising.
© Copyright Allianz 39Textmasterformat bearbaiting
EQUITY MARKETS: RED FLAGS (II)
Ratio of US margin debt to personal income Financial velocity of money
5%
10 5 000
Financial velocity (Turnover by
4%
value/M2) at annual rate
3%
1 500
2%
1%
Velocity of US M2 in US equity market (L.H.S)
Datastream US total market index (R.H.S)
0% 0 50
1975 1980 1985 1990 1995 2000 2005 2010 2015 2020 1975 1980 1985 1990 1995 2000 2005 2010 2015 2020
Sources: Refinitiv, Allianz Research Sources: Refinitiv, Allianz Research
Another signal of the recent market frothiness and overtrading Another clear red flag that combines overtrading with increased moral
can be found in the increasing amount of margin debt and hazard is the rapid increase in money velocity within financial markets.
deposits in US clearing houses, triggered by the rapid increase in This increase is relevant as it shows that the recent equity rally has,
options trading volumes since March 2020. At this point, things partly, occurred thanks to the market’s unconditional trust in the central
start to take a systemic flavor and although we maintain that, at banks’ unconditional put protection, which has led to a rapid increase in
current levels, there is enough public and private liquidity in the financial money velocity. This red flag is particularly important as it is
market to absorb the increased trading volumes, it is an not the quantity of money but its circulation that causes asset prices to
overtrading red flag. rise or fall and historical experience shows us that central banks do not
© Copyright Allianz control the velocity of money, especially in capital markets. 40Textmasterformat bearbaiting
CRYPTOCURRENCIES: A RED FLAG?
Cryptocurrencies market capitalization Bitcoin correlations with certain stocks (and Gold)
Tesla Gold Apple FB
0.6
0.4
0.2
0.0
-0.2
-0.4
2012 2013 2014 2015 2016 2017 2018 2019 2020 2021
Sources: Refinitiv, Allianz Research. Correlations are computed using a 6M rolling correlation on
Sources: coinmarketcap.com, Allianz Research.
daily changes
In early Q1 2021, the aggregated market cap of cryptocurrencies Volatility has been structural feature of cryptocurrencies since
sky-rocketed above USD2trn just to lose more than USD500bn in a their initial launch. For some time, they were said to be a
matter of days. It must be conceded that cryptocurrencies are no reserve asset like gold. However, the price correction that
strangers to such sharp movements but the natural question that occurred while inflation uncertainty was climbing does not
arises is where did this money go? Although the answer in this “new” support this theory. On the other hand, since 2019, there has
investment is not straightforward, it confirms the recent market been a structurally sustained correlation between Bitcoin and
exuberance, overtrading and irrationality. meme stocks (e.g. Tesla, GME, AMC, etc).
© Copyright Allianz 41Textmasterformat bearbaiting
US EQUITY: CONTINUOUS POLICY DEPENDENCE
US equity markets decomposition (y/y % change) S&P500 EPS growth expectations (in %)
30
40
20 2021
30
10
20 2022
0 2017
10
-10 2023
0 2018
-20 2015 2016 2019 2020
-10
-30
2003 2006 2009 2012 2015 2018 2021 -20
M2 Money Supply 10y inflation breakeven 10y real yield
USD NEER Budget balance Estimate -30
S&P500 2012 2013 2014 2015 2016 2017 2018 2019 2020 2021
Sources: Refinitiv, Allianz Research Sources: Refinitiv, Allianz Research
But not everything is lost! In this fragile market context, our equity Despite the great 2021 and due to the frontloading of earnings
decomposition model shows that both monetary and fiscal policy growth from 2022 into 2021, we expect 2022 to be the consolidation
are currently acting as a backstop against a market correction, and year in which equity markets slowly but sturdily start reconverging
we do not have any reason to believe that this will change in 2021. towards fundamentals, posting returns close to their long-term
Because of the recursive active intervention of this two exogenous averages (~5 to 6%). In this regard, we do not expect 2022 to be free
forces, we believe US equity markets will post high single digit of volatility as the current market dependence on exogenous
returns (~7 to 8%) in 2021, allowing for some sector rotation and tailwinds should start fading away, with companies underlying
consolidation towards defensive/quality stocks. growth engines having to take over.
© Copyright Allianz 42You can also read