GRAY SEAL (Halichoerus grypus atlantica): Western North Atlantic Stock
←
→
Page content transcription
If your browser does not render page correctly, please read the page content below
April 2021
GRAY SEAL (Halichoerus grypus atlantica):
Western North Atlantic Stock
STOCK DEFINITION AND GEOGRAPHIC
RANGE
The gray seal (Halichoerus grypus) is found on both
sides of the North Atlantic, with three major populations:
Northeast Atlantic, Northwest Atlantic and the Baltic Sea
(Haug et al. 2007). The Northeast Atlantic and the
Northwest Atlantic populations are classified as the
subspecies H. g. atlantica (Olsen et al. 2016). The
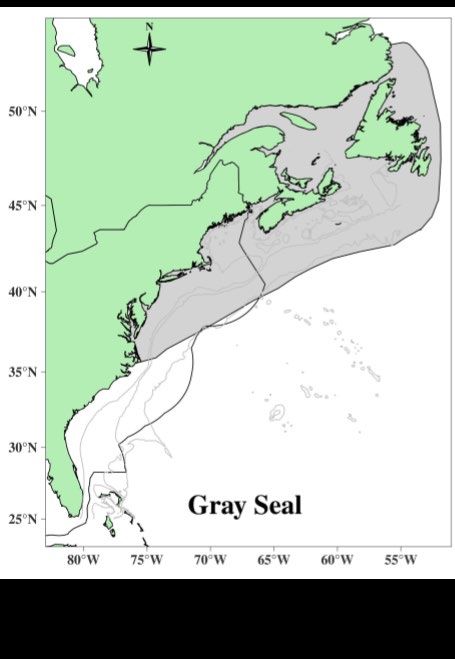
Northwest Atlantic population includes the western North
Atlantic stock ranges from New Jersey to Labrador
(Figure 1; Davies 1957, Mansfield 1966, Katona et al.
1993, Lesage and Hammill 2001). This stock is separated
from the northeastern Atlantic stocks by geography,
differences in the breeding season, and mitochondrial and
nuclear DNA variation (Bonner 1981, Boskovic et al.
1996, Lesage and Hammill 2001, Klimova et al. 2014).
There are three breeding aggregations in eastern Canada:
Sable Island, Gulf of St. Lawrence, and at sites along the
coast of Nova Scotia (Laviguer and Hammill 1993).
Animals from these aggregations mix outside the breeding
season (Lavigueur and Hammill 1993; Harvey et al. 2008;
Breed et al. 2006, 2009) and they are considered a single
population based on genetic similarity (Boskovic et al.
1996, Wood et al. 2011).
After near extirpation due to bounties, which ended
in the 1960s, small numbers of animals and pups were
observed on several isolated islands along the Maine coast
and in Nantucket-Vineyard Sound, Massachusetts
(Katona et al. 1993, Rough 1995, Gilbert et al. 2005). In
December 2001, NMFS initiated aerial surveys to monitor gray seal pup production on Muskeget Island and adjacent
sites in Nantucket Sound, and Green and Seal Islands off the coast of Maine (Wood et al. 2007). Tissue samples
collected from Canadian and U.S. populations were examined for genetic variation using mitochondrial and nuclear
DNA (Wood et al. 2011). All individuals were identified as belonging to one population, confirming that the new
U.S. population was recolonized by Canadian gray seals. The genetic evidence (Boskovic et al. 1996, Wood et al.
2011) provides a high degree of certainty that the western North Atlantic stock of gray seals comprise a single stock.
Further supporting evidence comes from sightings of seals in the U.S. that had been branded on Sable Island, resights
of tagged animals, and satellite tracks of tagged animals (Puryear et al. 2016). However, the percentage of time that
individuals are resident in U.S. waters is unknown.
POPULATION SIZE
The size of the Northwest Atlantic gray seal population is estimated separately for the portion of the population
in Canada versus the U.S., and mainly reflects the size of the breeding population in each respective country (Table
1). Currently there is a lack of information on the rate of exchange between animals in the U.S. and Canada, which
influences seasonal changes in abundance throughout the range of this transboundary stock as well as life history
parameters in population models. Total pup production in 2016 at breeding colonies in Canada was estimated to be
98,650 pups (CV=0.10; den Heyer 2017, DFO 2017). Production at Sable Island, Gulf of St. Lawrence, and Coastal
Nova Scotia colonies accounted for 85%, 11% and 4%, respectively, of the estimated total number of pups born.
139Population models, incorporating estimates of age-specific reproductive rates and removals, are fit to these pup
production estimates to estimate total population levels in Canada. The total Canadian gray seal population in 2016
was estimated to be 424,300 (95%CI: 263,600–578,300; DFO 2017). Uncertainties in the population estimate derive
from uncertainties in life history parameters such as mortality rates and sex ratios (DFO 2017).
In U.S. waters, the number of pupping sites has increased from one in 1988 to nine in 2019, and are located in
Maine and Massachusetts (Wood et al. 2019). Although white-coated pups have stranded on eastern Long Island
beaches in New York, no pupping colonies have been detected in that region. A minimum of 6,308 pups were born in
2016 at U.S. breeding colonies (Wood et al. 2019), approximately 6% of the total pup production over the entire range
of the population (denHeyer et al. 2017). The percentage of pup production in the U.S. is considered a minimum
because pup counts are single day counts that have not been adjusted to account for pups born after the survey, or that
left the colony prior to the survey. Mean rates of increase in the number of pups born at various times since 1988 at
four of the more frequently surveyed pupping sites (Muskeget, Monomoy, Seal, and Green Islands) ranged from ‑0.2%
(95%CI: ‑2.3–1.9%) to 26.3% (95%CI: 21.6–31.4%; Wood et al. 2019). These high rates of increase provide further
support that seals from other areas are continually supplementing the breeding population in U.S. waters.
The number of pups born at U.S. breeding colonies can be used to approximate the total size (pups and adults) of
the gray seal population in U.S. waters, based on the ratio of total population size to pups in Canadian waters (4.3:1;
den Heyer et al. 2017, DFO 2017). Although not yet measured for U.S. waters, this ratio falls within the range of
other adult to pup ratios suggested for pinniped populations (Harwood and Prime 1978, Thomas et al. 2019). Using
this approach, the population estimate in U.S. waters is 27,131 (CV=0.19; 95%: 18,768–39,221) animals. The CV and
CI around this estimate are based on CVs and CIs from Canadian population estimates, rather than using a default CV
when the variance is unknown (Wade and Angliss 1997). There is further uncertainty in this abundance level in the
U.S. because life history parameters that influence the ratio of pups to total individuals in this portion of the population
are unknown. It also does not reflect seasonal changes in stock abundance in the Northeast region for a transboundary
stock. For example, roughly 24,000 seals were observed in southeastern Massachusetts alone in 2015 (Pace et al.
2019), yet 28,000–40,000 gray seals were estimated to be in this region in 2015 using correction factors applied to
seal counts obtained from Google Earth imagery (Moxley et al. 2017).
Table 1. Summary of recent abundance estimates for the western North Atlantic gray seal (Halichoerus grypus
atlantica) by year, and area covered, resulting total abundance estimate (Nest) and 95% confidence interval
(95%CI).
Year Area Nest a 95%CI
Gulf of St Lawrence + Nova Scotia Eastern
2012b 331,000 263,000–458,000
Shore + Sable Island
Gulf of St Lawrence + Nova Scotia Eastern
2014c 505,000 329,000–682,000
Shore + Sable Island
Gulf of St Lawrence + Nova Scotia Eastern
2016d 424,300 263,600–578,300
Shore + Sable Island
2016 U.S 27,131e 18,768–39,221
a. These are model-based estimates derived from pup surveys.
b. DFO 2013
c. DFO 2014
d. DFO 2017
e. This is derived from total population size to pup ratios in Canada, applied to U.S. pup counts.
Minimum Population Estimate
The minimum population estimate is the lower limit of the two-tailed 60% confidence interval of the log-normally
distributed best abundance estimate. This is equivalent to the 20th percentile of the log-normal distribution as specified
by Wade and Angliss (1997). Based on an estimated U.S. population in 2016 of 27,131 (CV=0.19), the minimum
population estimate in U.S. waters is 23,153 (Table 2). Similar to the best abundance estimate, there is uncertainty in
this minimum abundance level in the U.S. because life history parameters that influence the ratio of pups to total
individuals in this population are unknown.
140Current Population Trend
In the U.S., the mean rate of increase in the number of pups born differs across the pupping. From 1988–2019,
the estimated mean rate of increase in the number of pups born was 12.8% on Muskeget Island, 26.3% on Monomoy
Island, 11.5% on Seal Island, and -0.2% on Green Island (Wood et al. 2019). These rates only reflect new recruits to
the population and do not reflect changes in total population growth resulting from Canadian seals migrating to the
region.
The total population of gray seals in Canada was estimated to be increasing by 4.4% per year from 1960–2016
(Hammill et al. 2017), primarily due to increases at Sable Island. Pup production on Sable Island increased
exponentially at a rate of 12.8% per year between the 1970s and 1997 (Bowen et al. 2003). Pupping also occurs on
Hay Island off Nova Scotia, in colonies off southwestern Nova Scotia, and in the Gulf of St. Lawrence. Since 1997,
the rate of increase has slowed (Bowen et al. 2011, den Heyer et al. 2017), supporting the hypothesis that density-
dependent changes in vital rates may be limiting population growth. While slowing, pup production is still increasing
on Sable Island and in southwest Nova Scotia, and stabilizing on Hay Island in the Gulf of St. Lawrence (DFO 2017,
den Heyer et al. 2017). In the Gulf of St. Lawrence, the proportion of pups born on the ice has declined from 100% in
2004 to 1% in 2016 due to a decline in winter ice cover in the area, and seals have responded by pupping on nearby
islands (DFO 2017).
CURRENT AND MAXIMUM NET PRODUCTIVITY RATES
Current and maximum net productivity rates are unknown for this stock. For the purposes of this assessment, the
maximum net productivity rate was assumed to be 0.12. This value is based on theoretical modeling showing that
pinniped populations may not grow at rates much greater than 12% given the constraints of their reproductive life
history (Barlow et al. 1995).
POTENTIAL BIOLOGICAL REMOVAL
Potential Biological Removal (PBR) is the product of minimum population size, one-half the maximum
productivity rate, and a recovery factor (MMPA Sec. 3. 16 U.S.C. 1362, Wade and Angliss 1997). The minimum
population size for the portion of the stock residing in U.S. waters is 23,153. The maximum productivity rate is 0.12,
the default value for pinnipeds. The recovery factor (Fr) for this stock is 1.0, the value for stocks of unknown status,
but which are known to be increasing. PBR for the western North Atlantic stock of gray seals residing in U.S. waters
is 1,389 animals (Table 2). Uncertainty in the PBR level arises from the same sources of uncertainty in calculating a
minimum abundance estimate in U.S. waters.
Table 2. Best (Nest) and minimum abundance (Nmin) estimates for the western North Atlantic gray
seal (Halichoerus grypus atlantica) with Maximum Productivity Rate (Rmax), Recovery Factor (Fr) and PBR.
Nest CV Nmin Fr Rmax PBR
27,131 0.19 23,153 1 0.12 1,389
ANNUAL HUMAN-CAUSED MORTALITY AND SERIOUS INJURY
For the period 2014–2018, the average annual estimated human-caused mortality and serious injury to gray seals
in the U.S. and Canada was 4,729 (953 U.S./3,776 Canada) per year. Mortality in U.S. fisheries is explained in further
detail below.
141Table 3. The total annual estimated average human-caused mortality and serious injury for the western North
Atlantic gray seal (Halichoerus grypus atlantica).
Years Source Annual Avg. CV
2014–2018 U.S. fisheries using observer data 946 0.11
2014–2018 U.S. non-fishery human interaction stranding mortalities 6.2
2014–2018 U.S. research mortalities 1.2
2014–2018 Canadian commercial harvest 636
2014–2018 DFO Canada scientific collections 62
2014–2018 Canadian removals of nuisance animals 3,078
Total 4,729
Some human-caused mortality or serious injury may not be able to be quantified. Observed serious injury rates
are lower than would be expected from the anecdotally observed numbers of gray seals living with ongoing
entanglements. Estimated rates of entanglement in gillnet gear, for example, may be biased low because 100% of
observed animals are dead when they come aboard the vessel (Josephson et al. 2021); therefore, rates do not reflect
the number of live animals that may have broken free of the gear and are living with entanglements. For example,
mean prevalence of live entangled gray seals ranged from roughly 1 to 4% at haul-out sites in Massachusetts and Isle
of Shoals (Iruzun Martins et al. 2019). Reports of seal shootings and other non-fishery-related human interactions are
minimum counts.
Fishery Information
Detailed fishery information is given in Appendix III.
United States
Northeast Sink Gillnet
The Northeast sink gillnet fishery is a Category I fishery. The average annual observed mortality from 2014–2018
was 199 animals, and the average annual estimated total mortality was 896 (CV=0.11; Hatch and Orphanides 2016;
Orphanides and Hatch 2017; Orphanides 2019, 2020, 2021). See Table 4 for bycatch estimates and observed mortality
and serious injury for the current 5-year period, and Appendix V for historical bycatch information.
Mid-Atlantic Gillnet
The mid-Atlantic sink gillnet fishery is a Category I fishery. The average annual observed mortality from 2014–
2018 wasNortheast Mid-Water Trawl and Pair Trawl
The Northeast mid-water trawl and pair trawl fisheries are Category II fisheries. Only one gray seal was observed
in these fisheries from 2014–2018 and an expanded bycatch estimate has not been generated. See Table 4 for observed
mortality and serious injury for during the current 5-year period, and Appendix V for historical bycatch information.
Canada
There is limited information on Canadian fishery bycatch (DFO 2017). Historically, an unknown number of gray
seals have been taken in Newfoundland and Labrador, Gulf of St. Lawrence, and Bay of Fundy groundfish gillnets;
Atlantic Canada and Greenland salmon gillnets; Atlantic Canada cod traps, and Bay of Fundy herring weirs (Read
1994).
Table 4. Summary of the incidental serious injury and mortality of gray seals (Halichoerus grypus atlantica) by
commercial fishery including the years sampled, the type of data used (Data Type), the annual observer coverage
(Observer Coverage), the mortalities recorded by on-board observers (Observed Mortality), the estimated annual
mortality (Estimated Mortality), the estimated CV of the annual mortality (Estimated CVs) and the mean annual
combined mortality (CV in parentheses).
Mean
Observed Est. Est.
Data Observer Observed Est. Est. Annual
Fishery Years Serious Serious Comb.
Type a Coverageb Mortality Mortality CVs Combined
Injuryc Injury Mortality
Mortality
2014 0.18 0 159 0 917 917 0.14
Northeast 2015 Obs. Data, 0.14 0 131 0 1021 1021 0.25
Sink 2016 Weighout, 0.10 0 43 0 498 498 0.33 896 (0.11)
Gillnet 2017 Logbook 0.12 0 158 0 930 930 0.16
2018 0.11 0 103 0 1113 1113 0.32
2014 Obs. Data, 0.05 0 1 0 22 22 1.09
Mid- 2015 Logbook, 0.06 0 1 0 15 15 1.04
Atlantic 2016 Allocated 0.08 0 1 0 7 7 0.93 8.8 (0.67)
Gillnet 2017 Dealer 0.09 0 0 0 0 0 0
2018 Data 0.09 0 0 0 0 0 0
2014 0.19 0 4 0 19 19 0.45
Northeast 2015 0.19 0 4 0 23 23 0.46
Obs. Data,
Bottom 2016 0.12 0 0 0 0 0 0 18 (0.22)
Logbook
Trawl 2017 0.12 0 2 0 16 16 0.24
2018 0.12 0 5 0 32 32 0.42
2014 0.09 0 1 0 7 7 0.96
Mid-
2015 0.09 0 0 0 0 0 0
Atlantic Obs. Data,
2016 0.10 0 3 0 26 26 0.57 23 (0.33)
Bottom Logbook
2017 0.14 0 5 0 26 26 0.40
Trawl
2018 0.12 0 7 0 56 56 0.58
Northeast
2014 0.42 0 0 0 0 0 0
Mid-
2015 0.08 0 0 0 0 0 0
water Obs. Data,
2016 0.27 0 0 0 0 0 0 0.2 (na) d
Trawl – Logbook
2017 0.16 0 0 0 0 0 0
Incl. Pair
2018 0.14 0 1 0 na na na
Trawl
Total 946 (0.11)
a. Observer data (Obs. Data) are used to measure bycatch rates, and the data are collected within the Northeast Fisheries Observer Program. The
Northeast Fisheries Observer Program collects landings data (Weighout), and total landings are used as a measure of total effort for the sink gillnet
fishery. Mandatory logbook (Logbook) data are used to determine the spatial distribution of fishing effort in the Northeast multispecies sink gillnet
fishery.
b. The observer coverages for the northeast sink gillnet fishery and the mid-Atlantic gillnet fisheries are ratios based on tons of fish landed. North
Atlantic bottom trawl, mid-Atlantic bottom trawl, and mid-Atlantic mid-water trawl fishery coverages are ratios based on trips. Total observer
coverage reported for bottom trawl gear and gillnet gear includes traditional fisheries observers in addition to fishery monitors through the Northeast
Fisheries Observer Program (NEFOP).
c. Serious injuries were evaluated for the 2014–2018 period (Josephson et al. 2021).
d. Unextrapolated number from observed data.
143Other Mortality
United States
Gray seals, like harbor seals, were hunted for bounty in New England waters until the late 1960s (Katona et al.
1993, Lelli et al. 2009). This hunt may have severely depleted this stock in U.S. waters (Rough 1995, Lelli et al.
2009). Other sources of mortality include human interactions, storms, abandonment by the mother, disease, and shark
predation. Mortalities caused by human interactions include research mortalities, boat strikes, fishing gear interactions,
power plant entrainment, oil spill/exposure, harassment, and shooting. Seals entangled in netting are common at haul-
out sites in the Gulf of Maine and Southeastern Massachusetts.
Tables 5 and 6 present summaries of gray seal strandings as reported to the NOAA National Marine Mammal
Health and Stranding Response Databaseaccessed 20 November 2019). Most stranding mortalities were in
Massachusetts, which is the center of gray seal abundance in U.S. waters. In an analysis of mortality causes of stranded
marine mammals on Cape Cod and southeastern Massachusetts between 2000 and 2006, Bogomolni et al. (2010)
reported that 45% of gray seal stranding mortalities were attributed to human interaction.
A UME was declared in November of 2011 that involved at least 137 gray seal stranding mortalities between
June 2011 and October 2012 in Maine, New Hampshire, and Massachusetts. The UME was declared closed in
February 2013 (https://www.fisheries.noaa.gov/national/marine-life-distress/active-and-closed-unusual-mortality-
events).
Canada
Between 2014 and 2018, the average annual human-caused mortality and serious injury to gray seals in Canadian
waters from commercial harvest is 636 individuals, though up to 60,000 seals/year are permitted (http://www.dfo-
mpo.gc.ca/decisions/fm-2015-gp/atl-001-eng.htm). This included: 82 in 2014, 1,381 in 2015, 1,588 in 2016, 64 in
2017, and 66 in 2018 (DFO 2017, Courtney D’Aoust pers. comm.). In addition, between 2014 and 2018, an average
of 3,078 nuisance animals per year were killed. This included 3,732 annually in 2014–2017 (DFO 2017) and 461 in
2018 based on the total number of licenses that were issued (Courtney D’Aoust pers. comm). Lastly, DFO took 83
animals in 2014, 42 animals in 2015, 30 animals in 2016, 60 animals in 2017, and 96 animals in 2018 for scientific
collections, for an annual average of 62 animals (DFO 2017, Samuel Mongrain pers. comm).
Table 5. Gray seal (Halichoerus grypus atlantica) stranding mortalities along the U.S. Atlantic coast (2014–2018)
with subtotals of animals recorded as pups in parentheses.
State 2014 2015 2016 2017 2018 Total
ME 3 (1) 5 6(0) 14 (1) 25 (0) 53
NH 3 (2) 2 0 3 (0) 9 (3) 17
MA 62 (6) 77 (3) 54(0) 135 (21) 261 (29) 589
RI 8 (1) 7 (1) 4(0) 16 (5) 20 (3) 55
CT 0 0 0 3 (0) 1(0) 4
NY 12 (4) 10 1 (1) 57 (0) 25 (1) 105
NJ 7 (6) 7 (6) 3 (1) 4 (3) 14 (10) 35
DE 3 (3) 3 (3) 0 1 (0) 4 (2) 11
MD 1 (0) 0 0 0 1 (1) 2
VA 0 3 0 0 1 (1) 4
NC 2 (2) 0 0 0 5 (2) 7
Total 101 (25) 114 (13) 68 (2) 192 (30) 346 (48) 882
Unspecified 38 31 13 86 92 193
seals (all states)
144Table 6. Documented gray seal (Halichoerus grypus atlantica) human-interaction related stranding mortalities
along the U.S. Atlantic coast (2014–2018) by type of interaction. “Fishery interactions” are subsumed in the total
estimated mortality calculated from observer data.
Cause 2014 2015 2016 2017 2018 Total
Fishery Interaction 2 14 0 10 10 36
Boat Strike 3 3 0 4 2 12
Shot 0 1 1 0 0 2
Human Interaction - Other 3 2 0 3 9 17
Total 8 20 1 17 21 67
STATUS OF STOCK
Gray seals are not listed as threatened or endangered under the Endangered Species Act, and the western North
Atlantic stock is not considered strategic under the Marine Mammal Protection Act. The average annual human-caused
mortality and serious injury during 2014–2018 in U.S. waters does not exceed the PBR of the U.S. portion of the
stocks. The status of the gray seal population relative to OSP in U.S. Atlantic EEZ waters is unknown, but the stock’s
abundance appears to be increasing in Canadian and U.S. waters. Total fishery-related mortality and serious injury for
this stock is not less than 10% of the calculated PBR and, therefore, cannot be considered to be insignificant and
approaching the zero mortality and serious injury rate. Uncertainties described in the above sections could have an
effect on the designation of the status of this stock in U.S. waters.
REFERENCES CITED
Barlow, J., S.L. Swartz, T.C. Eagle and P.R. Wade. 1995. U.S. marine mammal stock assessments: Guidelines for
preparation, background, and a summary of the 1995 assessments. NOAA Tech. Memo. NMFS-OPR-6.
73pp.
Bogomolni, A.L., K.R. Pugliares, S.M. Sharp, K. Patchett, C.T. Harry, J.M. LaRocque, K.M. Touhey and M. Moore.
2010. Mortality trends of stranded marine mammals on Cape Cod and southeastern Massachusetts, USA,
2000 to 2006. Dis. Aq. Org. 88:143–155.
Bonner, W.N. 1981. Grey seal (Halichoerus grypus) Fabricus, 1791. Pages 111-144 in: S.H. Ridgway and R.J.
Harrison (Eds.). Handbook of marine mammals, Vol. 2: Seals. Academic Press, London, UK.
Boskovic, R., K.M. Kovacs, M.O. Hammill and B.N. White. 1996. Geographic distribution of mitochondrial DNA
haplotypes in grey seals (Halichoerus grypus). Can. J. Zool. 74:1787–1796.
Bowen, W.D., J.I. McMillan and W. Blanchard. 2007. Reduced population growth of gray seals at Sable Island:
Evidence from pup production and age of primiparity. Mar. Mamm. Sci. 23:48–64.
Bowen, W.D., C. den Heyer, J.I. McMillan and M.O. Hammill. 2011. Pup production at Scotian Shelf grey seal
(Halichoerus grypus) colonies in 2010. DFO Can. Sci. Advis. Sec. Res. Doc. 2011/066: vi+25pp.
Breed, G.A., W.D. Bowen, J.I. McMillan and M.L. Leonard. 2006. Sexual segregation of seasonal foraging habitats
in a non-migratory marine mammal. Proc. Royal Soc. B 273:2319–2326.
Breed, G.A., I.D. Jonsen, R.A. Myers, W.D. Bowen and M.L. Leonard. 2009. Sex-specific, seasonal foraging tactics
of adult grey seals (Halichoerus grypus) revealed by state-space analysis. Ecology. 90:3209–3221.
Cammen, K.M., S.Vincze, A.S. Heller, B.A. McLeod, S.A. Wood, W.D. Bowen, M.O. Hammill, W.B. Puryear, J.
Runstadler, F.W. Wenzel, M. Kinnison and T.R. Frasier. 2018. Genetic diversity from pre-bottleneck to
recovery in two sympatric pinniped species in the Northwest Atlantic. Cons. Gen. 19:555–569.
Davies, J.L. 1957. The geography of the gray seal. J. Mamm. 38:297–310.
den Heyer, C.E., S.L.C. Lang, W.D. Bowen and M.O. Hammill. 2017. Pup production at Scotian Shelf grey seal
(Halichoerus grypus) colonies in 2016. DFO Can. Sci. Advis. Sec. Res. Doc. 2017/056. v+34 p.
DFO [Department of Fisheries and Oceans]. 2011. Stock assessment of Northwest Atlantic grey seals (Halichoerus
grypus). Can. Sci. Advis. Sec. Advis. Rep. 2010/091. 12pp.
DFO [Department of Fisheries and Oceans]. 2013. Stock assessment of Northwest Atlantic grey seals (Halichoerus
grypus). DFO Can. Sci. Advis. Sec. Sci. Advis. Rep. 2013/008. 11pp.
DFO [Department of Fisheries and Oceans]. 2014. Stock assessment of Canadian grey seals (Halichoerus grypus).
DFO Can. Sci. Advis. Sec. Sci. Advis. Rep. 2014/010. 13pp.
DFO [Dept. of Fisheries and Oceans]. 2017. Stock assessment of Canadian Northwest Atlantic grey seals (Halichoerus
grypus). DFO Can. Sci. Advis. Sec. Sci. Advis. Rep. 2017/045. 13pp.
145Gilbert, J.R., G.T. Waring, K.M. Wynne and N. Guldager. 2005. Changes in abundance and distribution of harbor
seals in Maine, 1981–2001. Mar. Mamm. Sci. 21:519–535.
Hammill, M.O., C.E. den Heyer, W.D. Bowen and S.L.C. Lang. 2017. Grey seal population trends in Canadian waters,
1960–2016 and harvest advice. DFO Can. Sci. Advis. Sec. Res. Doc. 2017/052. v+30p.
Harvey, V., S.D. Côté and M.O. Hammill. 2008. The ecology of 3-D space use in a sexually dimorphic mammal.
Ecography. 31:371–380.
Harwood, J. and J.H. Prime. 1978. Some factors affecting the size of British grey seal populations. J. Appl. Ecol.
15:401–411.
Hatch, J.M. and C.D. Orphanides. 2016. Estimates of cetacean and pinniped bycatch in the 2014 New England sink
and mid-Atlantic gillnet fisheries. Northeast Fish Sci Cent Ref Doc. 16-05. 22pp.
Haug, T., M.O. Hammill and D. Ólafsdóttir (Eds.). 2007. Grey seals in the North Atlantic and the Baltic. NAMMCO
Scientific Publications. 6:7–12.
Iruzun Martins, M.C., L. Sette, E. Josephson, A. Bogomolni, K. Rose, S. Sharp, M. Niemeyer and M. Moore. 2019.
Unoccupied aerial system assessment of entanglement in Northwest Atlantic gray seals (Halichoerus
grypus). Mar. Mamm. Sci. 35:1613–1624. https://doi.org/10.1111/mms.12590
Josephson, E., F. Wenzel and M.C. Lyssikatos. 2021. Serious injury determinations for small cetaceans and pinnipeds
caught in commercial fisheries off the northeast U.S. coast, 2014–2018. Northeast Fish. Sci. Cent. Ref. Doc.
20-04. 33pp.
Katona, S.K., V. Rough and D.T. Richardson. 1993. A field guide to whales, porpoises, and seals from Cape Cod to
Newfoundland. Smithsonian Institution Press, Washington, DC. 316pp.
Klimova, A., C.D. Phillips, K. Fietz, M.T. Olsen, J. Harwood, W. Amos and J.I. Hoffman. 2014. Global population
structure and demographic history of the grey seal. Mol. Ecol. 23:3999–4017.
Laviguer, L. and M.O. Hammill. 1993. Distribution and seasonal movements of grey seals, Halichoerus grypus, born
in the Gulf of St. Lawrence and eastern Nova Scotia shore. Can. Field-Nat. 107:329–340.
Lesage, V. and M.O. Hammill. 2001. The status of the grey seal, Halichoerus grypus, in the Northwest Atlantic. Can.
Field-Nat. 115:653–662.
Lelli, B., D.E. Harris and A.M. Aboueissa. 2009. Seal bounties in Maine and Massachusetts, 1888 to 1962. Northeast.
Nat. 16:239–254.
Lyssikatos, M.C., S. Chavez-Rosales and J. Hatch. 2021. Estimates of cetacean and pinniped bycatch in Northeast and
mid-Atlantic bottom trawl fisheries, 2014–2018. Northeast Fish. Sci. Cent. Ref. Doc. 21-02. 12pp.
Mansfield, A.W. 1966. The grey seal in eastern Canadian waters. Can. Audubon Mag. 28:161–166.
Mohn, R. and W.D. Bowen. 1996. Grey seal predation on the eastern Scotian Shelf: Modeling the impact on Atlantic
cod. Can. J. Fish. Aquat. Sci. 53:2722–2738.
Moxley, J.H., A. Bogomolni, M.O. Hammill, K.M.T. Moore, M.J. Polito, L. Sette, B. Sharp, G.T. Waring, J.R. Gilbert,
P.N. Halpin and D.W. Johnston. 2017. Google Haul Out: Earth observation imagery and digital aerial surveys
in coastal wildlife management and abundance estimation. BioScience. 67:760–768.
Olsen, M.T., A. Galatius, V. Biard, K. Gregersen and C.C. Kinze. 2016. The forgotten type specimen of the grey seal
[Halichoerus grypus (Fabricius, 1791)] from the island of Amager, Denmark. Zoo. J. Linnean Soc. 178:713–
720.
Orphanides, C.D. and J. Hatch. 2017. Estimates of cetacean and pinniped bycatch in the 2015 New England sink and
mid-Atlantic gillnet fisheries. Northeast Fish Sci Cent Ref Doc. 17-18. 21pp. Available from:
https://www.fisheries.noaa.gov/resource/publication-database/marine-mammal-mortality-and-serious-
injury-reports
Orphanides, C.D. 2019. Estimates of cetacean and pinniped bycatch in the 2016 New England sink and mid-Atlantic
gillnet fisheries. Northeast Fish Sci Cent Ref Doc. 19-04. 12pp. Available from:
https://www.fisheries.noaa.gov/resource/publication-database/marine-mammal-mortality-and-serious-
injury-reports
Orphanides, C.D. 2020. Estimates of cetacean and pinniped bycatch in the 2017 New England sink and mid-Atlantic
gillnet fisheries. Northeast Fish. Sci. Cent. Ref. Doc. 20-03. 16pp. Available from:
https://www.fisheries.noaa.gov/resource/publication-database/marine-mammal-mortality-and-serious-
injury-reports
Orphanides, C.D. 2021. Estimates of cetacean and pinniped bycatch in the 2018 New England sink and mid-Atlantic
gillnet fisheries. Northeast Fish. Sci. Cent. Ref. Doc. 21-01.
Pace, R.M., E. Josephson, S. Wood and K. Murray. 2019. Trends and patterns of seal abundance at haul-out sites in a
gray seal recolonization zone. Northeast Fish. Sci Center Technical Memorandum. NMFS-NE-251. 23pp.
146Puryear, W.B., M. Keogh, N. Hill, J. Moxley, E. Josephson, K.R. Davis, C. Bandoro, D. Lidgard, A. Bogomolni, M.
Levin, S. Lang, M. Hammill, D. Bowen, D.W. Johnston, T. Romano, G. Waring and J. Runstadler. 2016.
Prevalence of influenza A virus in live-captured North Atlantic gray seals: A possible wild reservoir. Emerg.
Microbes & Infect. 5:1–9. https://doi.org/10.1038/emi.2016.77
Read, A.J. 1994. Interactions between cetaceans and gillnet and trap fisheries in the northwest Atlantic. Rep. Int.
Whal. Comm. (Special Issue) 15:133–147.
Rough, V. 1995. Gray seals in Nantucket Sound, Massachusetts, winter and spring, 1994. Final report to Marine
Mammal Commission. Contract T10155615. 28pp.
Thomas, L., D.J.F. Russell, C.D. Duck, C.D. Morris, M. Lonergan, F. Empacher, D. Thompson and J. Harwood. 2019.
Modelling the population size and dynamics of the British grey seal. Aquatic Conserv: Mar. Freshw. Ecosyst.
29(S1):6–23.
Thomas, L., M.O. Hammill and W.D. Bowen. 2011. Estimated size of the Northwest Atlantic grey seal population.
Can. Sci. Advis. Sec. Res. Doc. 2011/017. 23pp.
Trzcinski, M.K., R. Mohn and W.D. Bowen. 2005. Estimation of grey seal population size and trends at Sable Island.
DFO Research Document 2005/067. Canadian Department of Fisheries and Oceans. Ottawa, Ontario,
Canada. 10pp. Available from:
http://www.dfo-mpo.gc.ca/csas/Csas/Publications/ResDocsDocRech/2005/2005067e.htm
Wade, P.R. and R.P. Angliss. 1997. Guidelines for assessing marine mammal stocks: Report of the GAMMS
Workshop April 3–5, 1996, Seattle, Washington. NOAA Tech. Memo. NMFS-OPR-12. 93pp. Available
from: https://repository.library.noaa.gov/view/noaa/15963
Wood, S.A., K.T. Murray, E. Josephson and J.R. Gilbert. 2019. Rates of increase in gray seal (Halichoerus grypus
atlantica) pupping at recolonized sites in the United States, 1988–2019. J. Mammal. 101:121–128.
https://doi.org/10.1093/jmammal/gyz184
Wood, S.A., S. Brault and J.R. Gilbert. 2007. 2002 aerial survey of grey seals in the northeastern United States. Pages
117–121 in: T. Haug, M. Hammill and D. Ólafsdóttir (Eds.). Grey seals in the North Atlantic and Baltic.
NAMMCO Sci. Pub. 6, Tromsø, Norway.
Wood, S.A., T.R. Frasier, B.A. McLeod, J.R. Gilbert, B.N. White, W.D. Bowen, M.O. Hammill, G.T. Waring and S.
Brault. 2011. The genetics of recolonization: An analysis of the stock structure of grey seals (Halichoerus
grypus) in the Northwest Atlantic. Can. J. Zool. 89:490–497.
147You can also read