GREATER SAN MARCOS VISION 2020 TARGET BUSINESS ANALYSIS - Submitted by Market Street Services, Inc. www.marketstreetservices.com November 2014
←
→
Page content transcription
If your browser does not render page correctly, please read the page content below

GREATER SAN MARCOS VISION 2020
TARGET BUSINESS ANALYSIS

Submitted by Market Street Services, Inc.
www.marketstreetservices.com

November 2014
TABLE OF CONTENTS
Overview ...................................................................................................................................................................................................... 1

Introduction ............................................................................................................................................................................................... 2

Methodology and Concepts ............................................................................................................................................................... 5

Regional Advantage Sectors ............................................................................................................................................................... 7

        Aerospace .......................................................................................................................................................................................... 7

        Business Services and Support ............................................................................................................................................... 15

        Destination Attractions .............................................................................................................................................................. 24

        Materials Science ......................................................................................................................................................................... 31

Super-Regional Advantage Sectors .............................................................................................................................................. 39

        Targeted Opportunities ............................................................................................................................................................. 40

                Information Technology ................................................................................................................................................... 40

                Life Sciences .......................................................................................................................................................................... 43

                Regional Distribution......................................................................................................................................................... 47

        Strategic Implications ................................................................................................................................................................. 51

Conclusion ............................................................................................................................................................................................... 52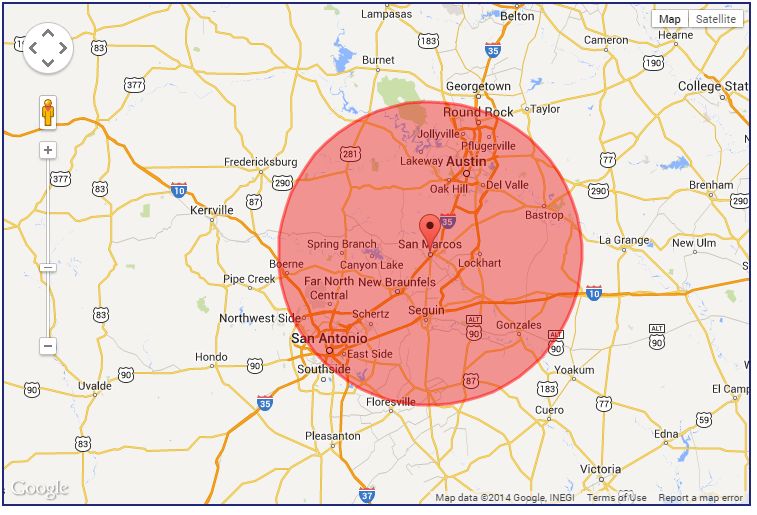
Target Business Analysis

OVERVIEW
In recent decades, Greater San Marcos, Texas has emerged as an increasingly prominent area home to new
businesses and one of the fastest-growing universities in the country, Texas State. Nearly equidistant from
the thriving cities of Austin and San Antonio, the area sits in a “garden spot,” allowing it to take advantage
of economic opportunities generated by both metros while maintaining its own unique character.

In 2009, Market Street Services partnered with the City of San Marcos and its economic development team,
Economic Development San Marcos, to coordinate a plan aimed at elevating economic prosperity for the
residents, businesses and elected/appointed leadership of the Greater San Marcos area known as “Partners
for Progress.” One of the first strategic initiatives successfully implemented was the creation of the Greater
San Marcos Partnership (GSMP), which is funded by a strong collaboration of originating investors.

Since 2009, GSMP has made important headway on several fronts and began establishing its credibility and
value position within the region. Now, as part of a comprehensive effort to make the community as
competitive as possible for new jobs, talent, and corporate investment, the Greater San Marcos Partnership
is taking the next step in its evolution by launching a process to enhance economic development activities
and programs in the two-county region comprised of Hays and Caldwell Counties. At the end of the eight-
month process, Greater San Marcos will have a consensus-based, achievable Vision 2020 Strategy to guide
its path to short- and long-term prosperity.

PHASE 1: COMPETITIVE ASSESSMENT
The goals of the first phase were to identify how Greater San Marcos has grown as a community and to
gather feedback from leaders and stakeholders in the area about how various changes and developments
should be integrated into the new Strategy. The goal of this data-driven component of the process was to
tell the area’s story in a way that clearly identifies competitive advantages, niche opportunities, challenges
to prosperity, and strategic considerations that should frame the Partnership’s program of work. Greater
San Marcos trends were benchmarked against Rutherford County, Tennessee; Brazos County, Texas; York
County, South Carolina; Texas, and the United States.

PHASE 2: TARGET BUSINESS ANALYSIS & MARKETING REVIEW
The purpose of this Target Business Analysis is to identify economic sectors that will drive future
employment growth and opportunity in Greater San Marcos. Market Street is taking a look at the
Partnership’s current strategic economic development targets and analyzing them to ensure that these
sectors continue to hold value for the community and are defined accurately.

The Marketing Review complements the target business research by analyzing the Partnership’s current
marketing efforts. The Review will take a look at the Partnership’s website and internal and external
marketing programs to evaluate its effectiveness as a marketing tool and to gauge how strongly it
positions the Partnership’s existing target business sector opportunities.

                                               Page 1 – November 2014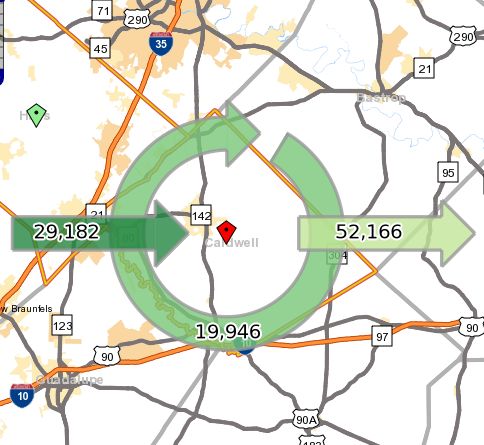
Target Business Analysis

PHASE 3: VISION 2020 STRATEGY
Upon completion of the two research phases, Market Street will work with the Steering Committee to
identify the key strategic priorities for Greater San Marcos based on all of the quantitative and qualitative
research performed to date. The Strategy will serve as a consensus blueprint to move the Greater San
Marcos area forward and will provide measurable and actionable goals and tactics needed to achieve
success.

PHASE 4: IMPLEMENTATION PLAN
While the Strategy represents “what” Greater San Marcos needs to do, the Implementation Guidelines
determines “how” to do it. The Guidelines will serve as the “road map” for putting the Strategy into motion.
The Guidelines outline the activities of the Strategy’s objectives on a day-by-day, month-by-month, and
year-by-year basis.

INTRODUCTION
Targeting key employment sectors for growth and potential development into “clusters” of economic
activity has become a nearly universal method of expanding and diversifying local economies. “Targets”
represent segments of an economy where competitive advantages exist, prospects for future growth are
greatest, and return on investment is likely highest. While targets are comprised of groups of categorically
linked businesses strategically pursued by an economic development organization and its partners, clusters
represent groups of interrelated businesses that co-locate due to “economies of scale” in multiple
competitive factors. There are a variety of different catalysts that support these agglomerations, which can
occur among competing or cooperative firms. A group of suppliers may choose to locate in proximity to a
major manufacturer for research and development efficiencies and reduced transportation costs. Other
firms may co-locate in a specific area in order to take advantage of a specialized labor pool or to be in
close proximity to specific infrastructure. The advantages derived by firms from these catalysts, coupled
with the network effects that often exist within clusters, often result in comparatively high potential for
employment growth and wealth creation. Due to limited economic development resources, it is sensible for
regions to strategically target those sectors with the greatest potential to create new jobs and raise
incomes. While not all targets will eventually become clusters, growth in these sectors will nevertheless
help drive local wealth-creation. Strategically targeting these business categories helps communities take
advantage of their particular strengths in existing companies, workforce capacity, research investment,
infrastructure, and other resources.

This report proposes target sectors for the two-county Greater San Marcos region of Hays and Caldwell
counties. While the region’s assets and existing/emerging employment sectors factored greatly into the
analysis and ultimate target recommendations, Market Street also included assessment of a broader labor
shed in the decision-making process, acknowledging Greater San Marcos’ incredibly strategic location
between Austin and San Antonio on the I-35 corridor and the reality that San Marcos area firms can
legitimately tap into a labor shed inclusive of both Austin and San Antonio metro counties to supply their

                                            Page 2 – November 2014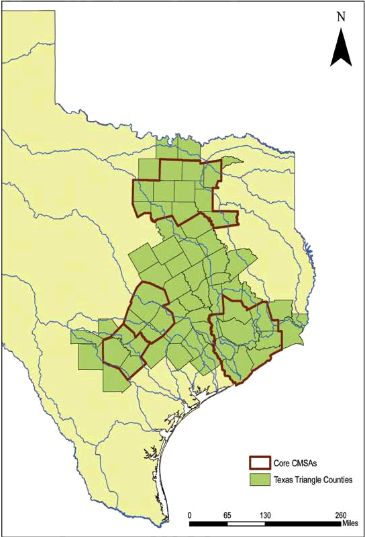
Target Business Analysis
talent needs. This is also because the San Marcos area’s most concentrated current sectors, including real
estate, retail (not including the outlet malls), and construction, are primarily driven by local growth and
demand. Employment of this type tends to be lower-paying and does not bring outside money into the
economy where it can create “multiplier” effects to drive additional wealth creation. This is an important
concept as the need to create good-paying jobs that help to drive down regional poverty rates was a key
conclusion of the Vision 2020 Competitive Assessment.
The Greater San Marcos Partnership currently focuses on six core industries: Advanced Manufacturing and
Materials, Aerospace and Aviation, Clean Technology, Corporate and Professional Operations, Life Sciences,
and Supply Chain Management. For this process, Market Street started with a clean slate and evaluated
employment and wage data for the two-county region by NAICS classification codes, occupational data for
a 10 Austin and San Antonio metro counties within a 50 mile radius of the City of San Marcos, Texas State
University degree programs and research assets, and areas of focus for the Austin Chamber, San Antonio
Economic Development Foundation, and the San Antonio Chamber.
Target sectors proposed for Greater San Marcos emerged from this research as well as the data and
findings of the Competitive Assessment, public input process, and Steering Committee feedback to date.
Key criteria in target sector identification were:
Current employment totals and concentrations for all sectors and subsectors
Occupational concentrations and trends at a 10-county geography representing a 50-mile labor
shed around the City of San Marcos
Education and training capacity, principally in Greater San Marcos institutions
Future development opportunities
Research and commercialization capacity
Presence of top employers capable of being “magnets” for buyers and suppliers
Average wage data and ability to raise levels of local wealth
Provision of employment and advancement opportunities for adults at a broad spectrum of
current skill and educational levels
Market Street proposes four targets that we believe will achieve the aforementioned objectives: Aerospace;
Business Services and Support; Destination Attractions; and Material Sciences. We also propose three
Super-Regional Advantage Sectors that more broadly leverage Greater San Marcos’ geographic centrality
between Austin and San Antonio: Information Technology, Life Sciences, with niches in biotech and
environmental sciences, and Regional Distribution.
The following graphic represents Greater San Marcos’ proposed targets. Sectors are listed alphabetically
and not by priority. The successful development of all key opportunity sectors will be critical for the San
Marcos region to realize its full potential.
Page 3 – November 2014Target Business Analysis
Greater San Marcos Vision 2020 Target Sectors
Regional Advantage Sectors Super‐Regional Advantage Sectors
Destination Information Regional
Aerospace Business Services & Support Material Sciences Life Sciences
Attractions Technology Distribution
Professional,
Customer
Data Scientific, & Environmental
Care Research Production Biotechnology
Centers Technical Sciences
Services
Services
Specialized Manufacturing
Target “niches,” illustrated by the golden boxes in the previous graphic, represent sub-categories that can
be differentiated in terms of compositional subsectors and growth dynamics, but nevertheless share
complimentary strategic concerns and competitive advantages such as talent, buyer/supplier networks,
infrastructure, technologies, marketing messaging, and others, that warrant them being considered under
the same overarching target category.
SPECIALIZED MANUFACTURING
Though not called out as a specific target area, various specialized manufacturing subsectors are
critical components of three Greater San Marcos targets: Aerospace, Materials Science, and Life
Sciences. Aerospace and Life Sciences have very specific production areas, including but not limited to
aerospace products and parts manufacturing in Aerospace and medical equipment and supplies
manufacturing in Life Sciences. Lists of manufacturing subsectors within these targets are available in the
Employment Trends tables in these target sections of this report.
Because of the nature of Materials Science research, which focuses on both materials and processes, the
applicable manufacturing subsectors are nearly limitless. Advances in Materials Science can benefit
components manufacturing, such as cement and cement product manufacturing and semiconductor and
other electronic component manufacturing, and final product manufacturing, such as motor vehicle parts
manufacturing, electric lighting equipment manufacturing, and machinery manufacturing. Because there
are many specialized manufacturing areas that can grow as a result of the Materials Science target, an
Employment Trends table is not included in that section. However, there is a table that connects the top 10
Materials Science research areas in the nation with examples of production applications that illustrates the
wide-reaching impact that the sector can have on manufacturing in Greater San Marcos. It is important to
note that Materials Science can also connect to Aerospace and Life Sciences in terms of advancing research
and commercialization in those specialized fields.
Page 4 – November 2014Target Business Analysis
Though certain strategic implications are noted for each proposed sector, this Target Business Analysis is a
research document, not a strategy. Collectively, these targets can help Greater San Marcos become more
specialized in areas of existing strength, grow jobs that can support economic diversification, and nurture
and create the community’s identity. This research report will analyze each target in detail and more fully
explain why they merit strategic attention and what kind of strategic attention may be appropriate based
on the research findings. Specific actions to grow the San Marcos region’s recommended target sectors will
be included in the Vision 2020 Strategy and must include a holistic focus on the three legs of the economic
development “stool”: existing business services, new enterprise creation, and marketing and attraction
programs.
METHODOLOGY AND CONCEPTS
In the field of economic development, there are many methods used to identify targets but most are based
on incomplete or strictly industry-focused (business-sector-focused) methodologies. Such approaches
ignore the variety of important issues from workforce attributes to educational assets to geographic
advantages, all of which are vital to businesses. Market Street’s approach to target identification is rooted in
a broader examination of the region’s workforce—the occupations and types of knowledge that support
the region’s business activities—as opposed to strictly focusing on business sector composition and
growth. It is complemented by an evaluation of the region’s business climate, infrastructure, research
assets, educational programs, and many other items that factor into site location decisions for specific
types of business activity.
CLASSIFICATION: Our approach does not strictly define targets based on North American Industry
Classification System (NAICS) codes or Standard Occupational Classification (SOC) codes. Though these
codes are used to help quantify important trends and activity within each target, they should not be
interpreted as rigid definitions of the composition of economic activity within a given target. Classification
codes are helpful in understanding target composition and growth, but they cannot adequately capture
niche technologies and opportunities that may deserve strategic attention in certain communities.
GEOGRAPHIES: For employment data, Market Street utilized the Greater San Marcos Partnership’s service
region consisting of Hays and Caldwell Counties as the geography of analysis. However, for occupational
data, we felt it was important to acknowledge the San Marcos region’s access to a wider, more diverse
labor force. A 50-mile radius is a widely accepted measure of distance for labor sheds because employees
will generally drive within 50 miles to commute for a quality job. For this analysis, Market Street included
the ten Austin MSA and San Antonio MSA counties that are (wholly or partially) within 50 miles of Greater
San Marcos: Hays and Caldwell in Greater San Marcos; Bastrop, Travis, and Williamson which comprise the
rest of the Austin MSA; and Bexar, Comal, Guadalupe, Kendall, and Wilson in the northeastern portion of
the San Antonio MSA. Within this radius are several high-capacity municipalities, particularly Austin and
San Antonio, with high concentrations of trained workers in diverse areas.
Page 5 – November 2014Target Business Analysis
50-MILE RADIUS OF CITY OF SAN MARCOS, TEXAS
Because of this labor shed accessibility, existing and potential employers in Greater San Marcos have
legitimate access to a much larger workforce (nearly 2.0 million) than the 72,240 workers in the two-
county region. In 2011, the most recent commuting data available from Census OnTheMap, 72.3 percent of
Greater San Marcos residents leave the two-county region to work, while 59.4 percent of the region’s
employees do not live in Hays or Caldwell counties.
COMMUTING PATTERNS IN GREATER SAN MARCOS, 2011
Thus, by marketing the Greater San Marcos region’s access to a broader, more highly-skilled labor pool,
local economic developers could more compellingly communicate the strategic advantages of the San
Marcos region’s location on the dynamic I-35 corridor.
Page 6 – November 2014Target Business Analysis
LOCATION QUOTIENTS: Location quotients (LQs) are used to measure the relative concentration of local
employment in a given business sector or occupation. When applied to business sector employment, they
measure the ratio of a business sector’s share of total local employment to that business sector’s share of
total national employment. A business sector with an LQ equal to 1.0 possesses exactly the same share of
total local employment as that business sector’s share of national employment. When a local business
sector possesses a location quotient greater than 1.0, this signals that the business sector is more heavily
concentrated in the community than it is nationwide. Those business sectors with relatively large LQs are
often assumed to benefit from one or more sources of competitive advantage derived from locating in the
community being studied. Location quotients can also be applied to occupational employment in the same
manner that they are applied to business sector employment, helping to determine which occupations and
corresponding skill sets—irrespective of the business sectors that employ them—are highly concentrated
in the local workforce.
DATA SOURCES: The Target Business Analysis presents a variety of data on business sector employment
composition, wages, establishments, occupational composition, workforce demographics, exports, inter-
industry expenditures, job openings, and degree completions. All of the aforementioned quantitative data
is sourced from Economic Modeling Specialists, Inc. (EMSI), an industry-leading provider of proprietary
data, aggregated from public sources such as the Census Bureau, the Bureau of Labor Statistics, the Bureau
of Economic Analysis, the National Center for Education Statistics, CareerBuilder, and many others. EMSI
was acquired by CareerBuilder in 2012.
SELECTED OCCUPATIONS: Occupations featured in the Occupation Statistics tables are those that provide
the skills and knowledge that could potentially supply targeted companies and are the most prevalent
within the subsectors listed in the Employment Trends tables. Please note: all workers in the occupations
featured are not necessarily employed within the target’s relevant subsectors. These tables are intended to
illustrate the volume of talent available.
REGIONAL ADVANTAGE SECTORS
Aerospace
Though not currently a highly concentrated sector in Greater San Marcos, Aerospace presents dynamic
opportunities to fuel regional economic diversification, raise wage and income levels, and capitalize on
super-regional assets.
As defined for this report, the Aerospace target encompasses aviation—in terms of the operation of
aircraft—as well as the design and production of aircraft, space mission, and national defense and
security-related products and parts, as well as a variety of subsectors that provide unfinished inputs or
supply finished components to the core aerospace products sectors. These supplying – or “upstream” –
sectors consist of two tiers. The first tier provides finished components such as electronic, optical, and
navigational components. The second tier provides other inputs derived from raw materials that are used
Page 7 – November 2014Target Business Analysis
in the production of finished aerospace and defense-related products. These second-tier suppliers include
providers of metal, aluminum, nuts and bolts, rubber tubing, and other inputs that may be used in the
manufacture of a variety of goods. The term “advanced equipment” captures a variety of these first and
second tier suppliers as well as manufacturers of other electrical products and finished goods that are not
used by the aerospace sector but become consumer goods or integrated into other types of transportation
equipment.
Many of the affiliated and supporting sectors that transform raw materials such as metal, aluminum, steel,
and rubber for use in aerospace product and parts manufacturing, as well as a variety of other forms of
advanced equipment, often co-locate in close proximity to their end market (such as major defense-related
and aerospace manufacturers like C-FAN, a joint venture between GE Aircraft Engines and SNECMA (a
French multinational aircraft and rocket engine manufacturer). One of the region’s largest employers, C-
FAN produces GE90 engine fan blades that power the Boeing 777 airliner. This type of clustering has been
observed in other metropolitan areas with a major industry-leading defense contractor. A good example is
St. Louis, where hundreds of first and second tier suppliers have co-located near Boeing Integrated Defense
Systems (IDS) to minimize transportation costs, leverage a common labor pool, and take advantage of the
research and development synergies and expertise of Boeing IDS.
Data related to economic trends of the subsectors within this target indicates that a clustering effect
to the magnitude of St. Louis has not yet taken place in Greater San Marcos, but has indeed begun
with much room to grow. Nurturing this clustering effect by working with the region’s major employers
and Texas State to identify potential suppliers that could benefit from co-location is a natural step in the
development of this target.
SUBSECTOR PERFORMANCE
Greater San Marcos’ Aerospace target is comprised of subsectors related to the development of aerospace
products and equipment and the components needed for assembly, as well as air transportation and
support activities. The region has clear strengths due to the presence of its major employers. Though
product and process design is not prevalent in the region, Aerospace clustering activities should include
strategies to develop this value-added presence in Greater San Marcos Key firms supporting the
Aerospace target include but are not limited to:
C-FAN – profiled in the introduction.
UTC Aerospace Systems has its Aerostructures office in the City of San Marcos, where they provide
engine outer casings and aftermarket support for the world’s newest large commercial twinjets, the
Boeing 787 Dreamliner and the Airbus A350 XWB.
Mensor Corporation designs and manufactures precision measuring instruments and automatic
pressure test and calibration equipment. The company developed the first quartz manometer, a tool
to measure pressure, designed for the aerospace industry.
Page 8 – November 2014Target Business Analysis
With nearly 800 employees, aerospace products and parts manufacturing is the largest subsector
within the target. The target has grown significantly in terms of regional employment over the last 10
years, more than doubling while national employment in equivalent subsectors grew by only 10 percent. All
but one of the relevant subsectors in Greater San Marcos grew exponentially, as shown in the table on
page 9. Using shift share analysis to pare out the source of job growth or loss over a five-year period,
Market Street found that local competitive characteristics in Greater San Marcos (as opposed to
national factors) contributed to job growth in all Aerospace business sectors. This is a positive finding
because it speaks to opportunities to leverage these factors for additional regional growth.
Employment concentrations, measured by location quotients, are often used as an indication of clustering
by firms in local business sectors. Data suggests that the Aerospace target in Greater San Marcos is
starting to develop into a cluster. Four subsectors have location quotients of over 2.0, or double the
employment concentration in the average U.S. community: nonscheduled air transportation (4.59), other
electrical equipment and component manufacturing (4.38), aerospace product and parts manufacturing
(3.33), and industrial machinery manufacturing (2.05). The architectural and structural metals manufacturing
sector has a location quotient of 1.98. With very strong concentrations in several subsectors within this
target and high average wages across the board, the region has an opportunity to continue developing
Aerospace into a significant cluster by understanding supplier needs within the larger super-region,
connecting research initiatives with existing companies, attracting prospective companies with existing
assets, training and reskilling workers to fill jobs, and working to grow subsectors with low employment
concentrations.
When the relevant subsectors are aggregated, the average annual wage of the Aerospace target
($64,586) is nearly double the regional average. A closer look reveals that the average annual wage of
each business sector included in this target greatly exceeds the regional average annual wage of $32,990.
This helps to dispel a myth that is commonly associated with manufacturing in the United States. Although
there are undoubtedly low-wage occupations that support manufacturing operations, there are also an
abundance of higher-wage occupations that require varying levels of training and/or education and
provide the opportunity to elevate the average wage for a community across all related sectors.
Greater San Marcos’ 2012 output of Aerospace-related exports is strong, contributing significantly
to the exports generated by the larger 10-county super-regional labor shed. Greater San Marcos’
Aerospace target generates $738 million in exports, or 11.5 percent of the two-county region’s total. This
percentage of exports is nearly double the percentage of the 10-county region’s exports generating from
these subsectors (6.6 percent) and is higher than the percentage of state exports from these subsectors (9.0
percent). The greatest volume of exports within this target in the Greater San Marcos region is from aircraft
engine and engine parts manufacturing ($164 million in exports), current-carrying wiring device
manufacturing ($150 million), nonscheduled chartered passenger air transportation ($81 million), aircraft
manufacturing ($65 million), and scheduled passenger air transportation ($44 million).
Page 9 – November 2014Target Business Analysis
EMPLOYMENT TRENDS, AEROSPACE TARGET, 2013
2013 Employment 2003-2013 Change Earnings
2014
Greater % % Wages, National
NAICS Location
Description San Marcos Change, Change, Salaries, & Earnings
Code Quotient
Jobs GSM U.S. Proprietor Ratio
Earnings
Total, Across All Sectors 71,603 40% 4% $32,990 68.2%
3323 Architectural and Structural Metals Manufacturing 330 1.98 68% (9%) $58,492 117.2%
3332 Industrial Machinery Manufacturing 105 2.05 NA (14%) $40,362 53.6%
3336 Engine, Turbine, and Power Transmission Equipment Mfg 57 1.20 (22%) 6% $35,533 46.6%
3344 Semiconductor and Other Electronic Component Mfg 83 0.46 177% (19%) $69,343 75.8%
3345 Navigational, Measuring, Electromedical, & Control Instruments M 187 0.99 171% (9%) $76,358 82.1%
3359 Other Electrical Equipment and Component Mfg 265 4.38 279% (9%) $77,819 124.1%
3364 Aerospace Product and Parts Mfg 796 3.33 84% 14% $68,269 74.3%
481 Air Transportation 195 0.90 786% (14%) $79,147 114.2%
4811 Scheduled Air Transportation 106 0.54 NA (15%) $41,485 60.5%
4812 Nonscheduled Air Transportation 89 4.59 324% (9%) $127,962 163.9%
4881 Support Activities for Air Transportation 25 0.30 9% 24% $48,557 99.0%
54133 Engineering Services 241 0.54 194% 17% $68,404 77.2%
5415 Computer Systems Design and Related Services 327 0.38 206% 42% $60,846 59.8%
Total, Aerospace Target 2,611 1.02 136% 10% $64,586 78.7%
Source: EMSI
Note: National Earnings Ratio Color Code based on C2ER’s San Marcos Urban Area Cost of Living Index of 86.0.
OCCUPATION TRENDS
According to Aerospace International, roughly two-thirds of the American aerospace workforce is aged 50
or older. Without question, the development of a sustainable workforce is among the most critical issues, if
not the single most critical issue, facing the aerospace sector today. New projects will demand that regions
have an adequate pool of workers with precision skills in areas like engineering, information technology,
fabrication, and assembly, as well as high quality and high capacity education and training programs to
generate a consistent pipeline. Greater San Marcos benefits from its geographic location between Austin
and San Antonio in that its labor shed includes counties from two metros with valuable training and
workforce assets. This section will explore occupational data and training opportunities in the 10-county
area within driving distance of Greater San Marcos.
Across almost all occupations, the larger super-regional labor shed has experienced more favorable
growth trends than those nationwide. While these occupations saw a national increase of only 0.2
percent over the 10-year period, the 10-county Austin-San Marcos-San Antonio super-region experienced
a 19 percent increase of this group of occupations. This is a positive sign that the region is effectively
training workers to fill the demands of relevant companies.
The 10-county super-region has a high concentration of computer-related and electrical
occupations. Since computer systems design and related services is an underrepresented subsector in
Greater San Marcos, marketing the region’s proximity to a strong workforce trained in computer science
fields may help with attracting aerospace companies requiring those skills and knowledge base. The supply
Page 10 – November 2014Target Business Analysis
of workers with electrical expertise support the concentrated subsectors of other electrical equipment and
component manufacturing and could help to attract jobs in the less concentrated areas of semiconductor
and other electronic component manufacturing and navigational, measuring, electromedical, and control
instruments manufacturing.
As expected, occupations in the Greater San Marcos 10-county super-region requiring more
education and training provided higher wages. Many production jobs provide wages that are lower
than the regional average hourly wage of $20.72—keeping in mind that these occupational statistics cover
all production jobs irrespective of the sector because these skills are often translatable between subsectors,
potentially with additional in-house training. These lower wage positions have very low concentrations,
signaling a dearth of job opportunities in production, which is a key component of the Aerospace target.
Despite the lower wages of production-related jobs, these positions are important opportunities for entry-
level workers and for workers with lower levels of skills training.
If current demographic trends continue, workforce gaps are projected in several occupations in the
super-region relevant to the Aerospace target. Of the 29 occupations for which age data is available, 14
have a greater percentage of workers aged 45+ than those aged 25-44. These include higher wage
positions such as industrial production managers, architectural and engineering managers, aerospace
engineers, and industrial engineers, as well as lower wage positions such as electrical and electronic
equipment assemblers, engine and other machine assemblers, and general maintenance and repair
workers. In addition, several mid-tier skills-focused jobs are at risk of workforce sustainability, including
many technician and mechanic positions, including aircraft mechanics and service technicians, industrial
machinery mechanics, mechanical engineering technicians, and engineering technicians. Talent retention
efforts, new degree development, and provision of increased access to Austin Community College and
Gary Job Corps training opportunities will continue to be vital strategies to ensure Greater San Marcos
employers have replacement workers for future retirees.
Page 11 – November 2014Target Business Analysis
OCCUPATIONAL STATISTICS, AEROSPACE TARGET, 2013
2013 Employment 2003-2013 Change Earnings
% Change, % 2014 Avg National
SOC Location
Description Positions 10-County Change, Hourly Earnings
Code Quotient
Region U.S. Earnings Ratio
Total, Across All Occupations in 10-County Region 1,916,870 23% 4% $20.72 96.9%
11-3021 Computer and Information Systems Managers 3,724 0.89 21% 11% $60.23 98.0%
11-3051 Industrial Production Managers 1,299 0.61 (0%) (13%) $49.26 106.0%
11-9041 Architectural and Engineering Managers 2,738 1.11 15% 2% $63.70 99.6%
15-1121 Computer Systems Analysts 11,499 1.71 47% 20% $38.58 97.1%
15-1142 Network and Computer Systems Administrators 5,494 1.18 23% 6% $34.18 93.6%
15-1143 Computer Network Architects 3,170 1.72 27% 3% $49.03 109.0%
15-1151 Computer User Support Specialists 10,093 1.31 32% 14% $24.59 102.1%
15-1152 Computer Network Support Specialists 4,004 1.70 22% 4% $29.59 97.9%
17-2011 Aerospace Engineers 370 0.34 1% 14% $43.08 85.5%
17-2061 Computer Hardware Engineers 3,178 3.00 6% 0% $44.18 89.1%
17-2071 Electrical Engineers 2,010 0.95 11% 1% $43.27 98.3%
17-2072 Electronics Engineers, Except Computer 2,435 1.37 9% (4%) $44.62 97.6%
17-2112 Industrial Engineers 2,245 0.78 11% (5%) $39.74 100.7%
17-2141 Mechanical Engineers 1,655 0.49 9% (1%) $38.73 95.3%
17-2199 Engineers, All Other 1,927 1.07 24% 5% $44.06 101.4%
17-3012 Electrical and Electronics Drafters 907 2.40 29% (1%) $34.82 124.1%
17-3013 Mechanical Drafters 329 0.39 (4%) (9%) $25.77 100.9%
17-3019 Drafters, All Other 222 1.11 19% (4%) $24.66 105.0%
17-3021 Aerospace Engineering and Operations Technicians 136 1.07 8% 2% $29.64 99.5%
17-3023 Electrical and Electronics Engineering Technicians 4,134 2.20 10% (5%) $24.94 89.5%
17-3024 Electro-Mechanical Technicians 78 0.35 (13%) 3% $25.10 97.7%
17-3026 Industrial Engineering Technicians 363 0.41 (14%) (11%) $28.23 110.7%
17-3027 Mechanical Engineering Technicians 449 0.73 18% (2%) $22.56 87.3%
17-3029 Engineering Technicians, Except Drafters, All Other 1,177 1.34 23% 7% $31.00 106.1%
49-3011 Aircraft Mechanics and Service Technicians 2,102 1.31 12% 6% $21.67 81.3%
49-9041 Industrial Machinery Mechanics 2,526 0.61 29% 7% $21.17 91.2%
49-9071 Maintenance and Repair Workers, General 17,767 1.00 22% 3% $15.69 87.8%
51-2011 Aircraft Structure, Surfaces, Rigging,&Systems Assemblers 565 1.04 31% 33% $17.08 73.2%
51-2021 Coil Winders, Tapers, and Finishers 92 0.50 (3%) (11%) $15.19 98.7%
51-2022 Electrical and Electronic Equipment Assemblers 6,148 2.44 (3%) (15%) $13.03 87.5%
51-2023 Electromechanical Equipment Assemblers 549 0.84 (3%) (12%) $14.86 93.8%
51-2031 Engine and Other Machine Assemblers 117 0.22 4% (5%) $15.27 84.2%
51-2041 Structural Metal Fabricators and Fitters 414 0.40 (2%) (9%) $16.59 92.6%
51-2091 Fiberglass Laminators and Fabricators 117 0.49 17% (14%) $12.44 86.1%
51-2092 Team Assemblers 6,540 0.49 12% (14%) $12.24 85.0%
53-2011 Airline Pilots, Copilots, and Flight Engineers 157 0.18 5% (7%) $61.66 100.0%
53-2012 Commercial Pilots 307 0.65 23% 5% $43.04 113.5%
53-2021 Air Traffic Controllers 214 0.66 21% 17% $40.49 71.1%
53-2022 Airfield Operations Specialists 43 0.45 5% 4% $30.51 126.2%
53-2031 Flight Attendants 222 0.20 1% (10%) $21.56 105.9%
53-6051 Transportation Inspectors 243 0.73 15% 12% $31.22 97.7%
Total, Aerospace Target 101,759 1.04 19% 0.2% $29.85 99.7%
Source: EMSI
Note: National Earnings Ratio Color Code based on C2ER’s San Marcos Urban Area Cost of Living Index of 86.0.
Page 12 – November 2014Target Business Analysis
EDUCATIONAL PROGRAMS
Thriving Aerospace clusters typically require close proximity to research universities with strengths in fields
including engineering, advanced materials, and aeronautics. This provides not only long-term research and
development partnership opportunities (discussed in the next section), but also professional development
options for existing and future workers.
Within its College of Science and Engineering, Texas State University offers undergraduate
degrees in computer science, computer engineering, electrical engineering, industrial engineering,
general manufacturing engineering, semiconductor manufacturing, engineering technology,
industrial technology, mathematics, applied mathematics, and physics. Graduate degree programs
include the PhD in Materials Science, Engineering, and Commercialization and master’s degrees in
applied mathematics, computer science, engineering, materials physics, mathematics, physics,
software engineering, and technology management. The university’s Department of Aerospace
Studies has an Air Force Reserve Officer Training Corps (ROTC), which provides an opportunity for
students to become Air Force officers upon graduation.
Austin Community College’s Hays County campus offers courses in Computer Information
Technology, Computer Science, Geography, and Mathematics that may have applicability or can
ultimately support the Aerospace sector. At the main ACC campus, associate degree and certificate
programs are offered in architecture and engineering computer aided design, computer
information technology, computer science, electronics and advanced technologies, engineering,
mathematics, physics, and welding technology.
In addition to these programs, employers can draw from recent graduates from nearby research
institutions: University of Texas-Austin and University of Texas-San Antonio. Among the
abundance of relevant undergraduate and graduate programs offered at the two, there are
aerospace-specific programs. UT-Austin has a Bachelor of Science in Aerospace Engineering with
technical area options in atmospheric flight and space flight as well as a Master of Science in
Engineering (MSE) and a PhD in aerospace engineering. UT-San Antonio offers an aerospace
studies minor through its Air Force Reserve Officer Training Corps (ROTC).
PLACE-BASED ASSETS AND OPPORTUNITIES
Partnerships between universities and industry often provide foundations for aerospace equipment
manufacturers, prime defense contractors, or other large employers to attract federally-funded research
centers or heavily influence existing research centers or vice versa. Through these partnerships, funded
academic research can lead to innovative developments in technology and information, which can be used
to improve processes and end products.
In Greater San Marcos, Texas State recently entered into a multi-million dollar contract with Jacobs
Engineering to collaborate on advanced engineering and science work for NASA, which will provide
students and faculty applied research opportunities. Currently, Jacobs will provide the funding for Texas
State to employ a full-time engineering staff on-site in Houston. However, the university and Jacobs have
Page 13 – November 2014Target Business Analysis
started discussing the possibility of establishing presence on the Texas State campus or in STAR Park as
well as the potential for funding and commercialization collaboration with startups at STAR Park.
In addition to Texas State University and the region’s major aerospace employers, Greater San
Marcos benefits from the presence of the San Marcos Municipal Airport, which has 1,340 acres of
developable land as well as its Redbird Skyport, a 27,000 square foot training space and flight school. The
designated “reliever” facility for San Antonio’s and Austin’s international airports, the San Marcos Municipal
Airport is the largest general aviation airport in the area and is an important asset for the region for many
reasons. Because of the Municipal Airport and its staffed air traffic control tower, three asphalt runways
exceeding 5,200 feet, a 100-foot wide parking ramp, executive hangars, security fencing, and on-site fixed-
base operator, the region has enhanced transportation access, exiting infrastructure, and technology
capacity. The airport also has a 40-acre Foreign Trade Zone (FTZ) Magnet Site where businesses can locate
and be eligible to take advantage of duty and ad valorem tax exemptions on goods shipped there, and 17
operating businesses, including Berry Aviation. Berry Aviation is a growing special aviation provider with a
customer base that includes the U.S. government, for which the company provides international flight
support by transporting personnel and other materials to defense sites. The Redbird Skyport is not only a
training space and flight school, but also designs and tests flight simulators and hosts an annual flight
industry and design conference, which supports innovation related to flight training.
Greater San Marcos is also in close proximity to San Antonio’s world-class aerospace assets, which
include two active air force bases: Lackland AFB, the Air Force’s largest training wing, and Randolph AFB,
the headquarters for Air Education and Training Command. Also nearby is Port San Antonio, a 1,900-acre
Foreign Trade Zone-designated aerospace complex. Its nearly eight million square feet of leased facilities
house over 80 private and public organizations focused on aerospace, logistics, manufacturing,
government, and military as well as hangars, warehouses, training centers, and workforce housing. Boeing,
Lockheed Martin, Northrop Grumman, Raytheon, and other major aerospace firms all have presence in San
Antonio, which should be leveraged by the Greater San Marcos region.
STRATEGIC IMPLICATIONS
Clustering activities for Greater San Marcos’ Aerospace target will need to be multi-faceted and aggressive.
Certainly, working with the region’s existing businesses to retain and expand employment will be a critical
strategy. This is especially true because Greater San Marcos does not have the critical mass of employment
that would lead to buyer/supplier agglomeration effects. That said, support provided by economic
development to identify potential new markets for regional employers as well as attraction opportunities
for their supplier firms are viable marketing strategies.
If Greater San Marcos is to expand its Aerospace sector beyond production, it will be necessary to enhance
the availability of higher-skill talent in the region. This could either be done by increasing the training
opportunities for these occupations locally or tapping into the super-regional labor force to demonstrate
to prospect employers that talent pools with these skill sets are available within driving distance of Greater
San Marcos. The region can be marketed as an attractive location for employers in product and process
design exactly because of its centrality to Aerospace capacities in San Antonio and Austin.
Page 14 – November 2014Target Business Analysis
As such, Greater San Marcos economic development organizations can benefit from the investments
currently being made by the San Antonio Economic Development Foundation and the Greater San Antonio
Chamber in Aerospace and Aviation. These organizations, much like the Greater San Marcos Partnership,
focus on aircraft equipment and parts manufacturing, aircraft maintenance and repair, transportation
equipment and supplies manufacturing and distribution, scheduled and unscheduled air transportation,
and flight school operation.
Business Services and Support
Market Street feels that Greater San Marcos is well positioned to capture opportunities in three growing
sub-categories of Business Services and Support employment – namely, Customer Care Operations,
Professional, Scientific, and Technical Services, and Data Centers. What ties these three categories
together is the need for business and information technology (IT) centered skill sets, the storage, support,
input, and analysis of business-related data, and potential development/attraction of business units in
these niches from existing San Marcos area firms.
The presence of thousands of college students in and within driving distance of the region and
access to new graduates are competitive assets economic developers can market to customer care firms
and other professional services firms, while access to a wealth of super-regional information technology
expertise would satisfy the labor demands of data centers, which typically only hire a handful of employees
to run their facilities. The two counties comprising Greater San Marcos also feature lower labor, land,
and rental costs than Austin and San Antonio proper. The benefit for Greater San Marcos stakeholders
are flexible, entry-level services jobs that pay competitive wages (customer care), provision of opportunities
for recent graduates, mid-career professionals, and small business people (professional services), and the
potential infusion of huge capital investment, energy usage, and tax contributions (data centers).
Customer Care Operations include business functions that are vital to the operation of firms, such as
customer support centers, financial transactions processing, and shared services. For the past several
decades, companies around the world and across a variety of industry sectors have improved efficiencies in
various business functions such as customer assistance and payroll management in an effort to decrease
operating costs. Some companies have outsourced these tasks to third-party firms, while others have
consolidated them in-house in a “shared services” setup. As a result, tasks that used to be spread out
across a variety of departments are consolidated into a single internal unit, which then provides its services
company-wide. It is important to note that there are two types of call centers: inbound, which provides
customer service and support, and outbound, which entails sales and telemarketing. Typically, inbound
service centers provide higher wages to workers and require greater levels of training to ensure the
understanding of products and services in order to assist consumers and identify business solutions.
College and university students have proven to be a very desirable labor pool for customer support
operations. Market Street is recommending that Greater San Marcos only pursues higher-value, inbound
support center firms.
Page 15 – November 2014Target Business Analysis
Professional, Scientific, and Technical Services firms provide services and solutions to consumers as well as
other businesses. Varying widely in size and scale, companies in this niche include business support
functions such as legal services, advertising and public relations services, software and computer
programming, and consulting operations. This niche provides a platform for tech entrepreneurs and
service-oriented small business owners, which can support talent retention and attraction. It also offers
recent business graduates of Texas State with potential entry-level opportunities at good wages.
The third Business Services and Support niche – Data Centers – collects, processes, stores, and monitors
valuable data for clients. With almost infinite bytes of data streaming daily across the internet and stored in
cloud-based systems, data centers have become de facto operational necessities for companies purveying
data-intensive processes and products. Because stored data must have redundancies, companies must
constantly invest in additional data centers in multiple locations so as to reduce risks that their entire data
storehouse is compromised by a single event. Though its electricity rates are not as low as some other U.S.
locations, Central Texas’ comparatively lessened risk of natural disasters, weather events, or other
potentially catastrophic disruptors to data center operations also enhances its competitiveness for these
facilities. Indeed, Central Texas has proven to be a competitive location overall for data centers, with
multiple announcements in recent years.
Currently, the Greater San Marcos Partnership targets Corporate and Professional Operations, which
encompasses corporate headquarters, regional offices, and financial services firms. At this time, however,
Market Street feels it is premature for the region to target corporate headquarter operations. These projects
are increasingly concentrating in major metropolitan areas with access to international airports with
multiple direct connections to domestic and international business centers. While Greater San Marcos has
access to two international airports, which will be discussed in the Place-Based Assets and Opportunities
section, the region does not have the hub-level flight capacity typically considered competitive for major
corporate headquarters. Greater San Marcos must also work to enhance the skill levels of its professional
workforce, provide adequate executive housing stock, and facilitate development of thousands of square
feet of Class-A office space to have sufficient product to market to headquarters firms. Market Street
believes that opportunities related to regional offices are encompassed by the proposed customer care
operations and professional, scientific, and technical services niches in the Business Services and Support
target.
SUBSECTOR PERFORMANCE
Because of the need for business support services for firms across sectors, this target is a key
opportunity for Greater San Marcos to promote the region to potential prospects in non-targeted
industries. This includes firms looking to consolidate operations in shared-services centers, outsource
various professional service functions, or store data in secure off-site locations. It is important to note that
the “definition” of this target is not exhaustive because some firms will be classified by their primary
economic activity, rather than the targeted business function supporting the firm’s operation. For example,
if one of the region’s hospitals created a shared service center, the corresponding NAICS code would likely
be 62 (Health Care and Social Assistance) despite the business support functions the center would provide.
Examples of Business Services and Support firms in the region are:
Page 16 – November 2014Target Business Analysis
Bowman Consulting, a national engineering, surveying, landscape architecture, and environmental
consulting firm with one of its three Texas offices in the City of San Marcos;
Austin-based firms with local presence, such as Doucet and Associates, a civil engineering design and
consulting and surveying firm with local projects including the Red Oak Village retail development;
tekRESCUE, Inc., an IT consulting firm that repairs computers, smartphones, and enterprise level
servers owned by small and mid-sized businesses, develops and maintains websites, and provides
search engine optimization services; and
The Whitenton Group, an environmental consulting firm that markets research and public relations
services.
Despite low concentrations in the relevant subsectors for this target, employment growth has been
significant over the last 10 years. While these subsectors experienced national job growth of 19 percent,
employment in the two-county Greater San Marcos region doubled. This is a positive sign that the region
has the ingredients for a stronger presence of these firms.
The annual average wage for the Business Services and Support target ($43,946) surpasses the
regional annual average wage of $32,990. While there are sectors with average wages lower than the
regional average wage, it is still important that opportunities exist across skill and knowledge levels. The
data also reveal that currently, labor is low cost in the region for these subsectors, a key factor for
prospective companies and a potential reason for lower wage rates.
Page 17 – November 2014Target Business Analysis
EMPLOYMENT TRENDS, BUSINESS SERVICES AND SUPPORT TARGET, 2013
2013 Employment 2003-2013 Change Earnings
2014
Greater Wages, National
NAICS Location % Change, % Change,
Description San Marcos Salaries, & Earnings
Code Quotient GSM U.S.
Jobs Proprietor Ratio
Earnings
Total, Across All Sectors 71,603 40% 4% $32,990 68.2%
Customer Care
Financial Transactions Processing, Reserve, &
52232 28 0.49 NA 43% $42,808 57.5%
Clearinghouse Activities
551114 Corporate, Subsidiary,& Regional Managing Offices 277 0.29 489% 26% $60,429 55.2%
5611 Office Administrative Services 123 0.56 98% 47% $59,756 74.8%
5614 Business Support Services 197 0.45 60% 12% $26,187 69.3%
Professional, Scientific, and Technical Services
5411 Legal Services 292 0.45 25% (2%) $54,380 62.3%
5412 Accounting, Tax Preparation, Bookkeeping, & Payroll Svcs 298 0.57 34% 9% $27,696 44.2%
5413 Architectural, Engineering, & Related Services 377 0.55 79% 8% $56,262 69.9%
5414 Specialized Design Services 120 1.01 85% (1%) $33,864 80.6%
5415 Computer Systems Design & Related Services 327 0.38 206% 42% $60,846 59.8%
5416 Management, Scientific, & Technical Consulting Svcs 624 0.90 144% 54% $47,682 61.4%
54161 Management Consulting Services 520 0.99 146% 42% $47,636 59.2%
5417 Scientific Research & Development Services 40 0.13 90% 18% $62,454 54.8%
5418 Advertising, Public Relations, & Related Services 70 0.28 (20%) (5%) $35,209 46.1%
5419 Other Professional, Scientific, & Technical Services 621 1.77 142% 25% $25,667 59.7%
Data Centers
518210 Data Processing, Hosting, and Related Services 86 0.67 91% (6%) $25,907 28.7%
Total, Business Services and Support Target 3,480 0.56 100% 19% $43,946 54.0%
Source: EMSI
Note: National Earnings Ratio Color Code based on C2ER’s San Marcos Urban Area Cost of Living Index of 86.0.
A quarter of the employment in 2013, or 855 jobs, in this target can be attributed to entrepreneurs.
This is a 35 percent increase in the number of self-employed individuals working in the included business
sectors between 2003 and 2013. Region-wide, only 9 percent of jobs are attributed to the self-employed,
an indication that this target is a prime opportunity to focus on small business support and connecting
small businesses with large employers across business sectors to spur innovation in business support
technologies and processes.
OCCUPATION TRENDS
The Business Services and Support target is comprised of a diverse variety of occupations requiring
multiple skill sets and educational backgrounds ranging from management to finance to sales to
computer-related training. There is already a large presence of occupations key to customer care
operations in the 10-county Austin-San Marcos-San Antonio labor shed, including customer service
representatives, non-technical wholesale and manufacturing sales representatives, insurance sales agents,
and services sales representatives, which total nearly 84,000 workers in just these four occupational
categories.
Page 18 – November 2014You can also read


