Greenhouse Gas Emissions from Transit Projects: Programmatic Assessment
←
→
Page content transcription
If your browser does not render page correctly, please read the page content below

Greenhouse Gas Emissions
     from Transit Projects:
Programmatic Assessment
                            JANUARY 2017
                                   FTA Report No. 0097
                           Federal Transit Administration

                                           PREPARED BY
                                              Gina Filosa
                                             Carson Poe
           Volpe National Transportation Systems Center
                                              Maya Sarna
                  FTA Office of Environmental Programs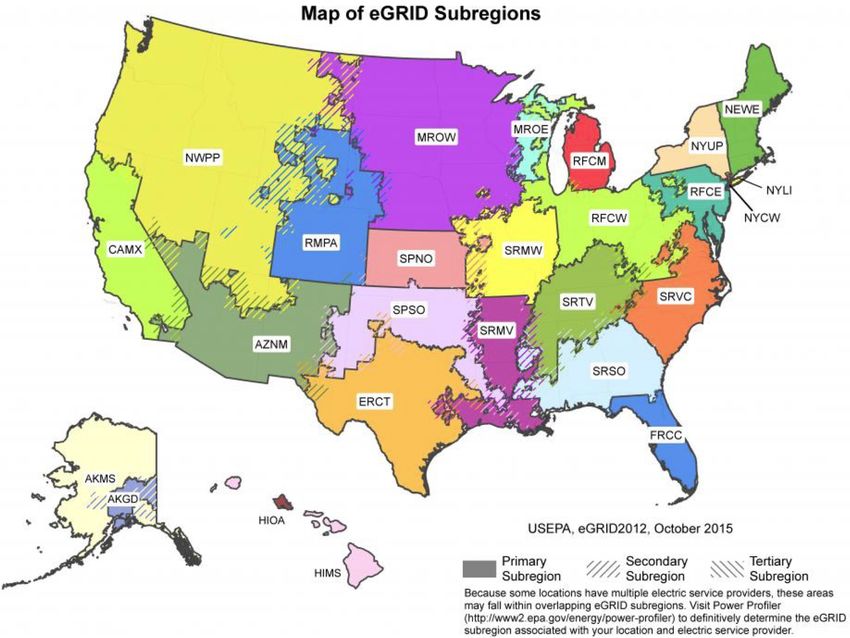
COVER PHOTO
Photo courtesy of Edwin Adilson Rodriguez, Federal Transit Administration

DISCLAIMER
This document is disseminated under the sponsorship of the U.S. Department of Transportation in the interest of information
exchange. The United States Government assumes no liability for its contents or use thereof. The United States Government
does not endorse products of manufacturers. Trade or manufacturers’ names appear herein solely because they are considered
essential to the objective of this report.
Greenhouse Gas
Emissions from
Transit Projects:
Programmatic
Assessment

JANUARY 2017
FTA Report No. 0097

PREPARED BY

Gina Filosa
Carson Poe
Volpe National Transportation Systems Center
Maya Sarna
FTA Office of Environmental Programs

SPONSORED BY

Federal Transit Administration
Office of Environmental Programs
U.S. Department of Transportation
1200 New Jersey Avenue, SE
Washington, DC 20590

AVAILABLE ONLINE

http://www.transit.dot.gov/about/research-innovation

                    FEDERAL TRANSIT ADMINISTRATION     i
Metric
                     MetricConversion
                      Metric Conversion
                             Conversion Table
                                          Table
                                        Table

SYMBOL    WHEN YOU KNOW                 MULTIPLY BY                TO FIND             SYMBOL

                                           LENGTH

  in            inches                       25.4                 millimeters             mm

  ft             feet                       0.305                   meters                 m

  yd             yards                      0.914                   meters                 m

  mi             miles                       1.61                 kilometers              km

                                          VOLUME

 fl oz       fluid ounces                   29.57                  milliliters            mL

  gal           gallons                     3.785                    liters                L

  ft3          cubic feet                   0.028                cubic meters              m3

 yd3          cubic yards                   0.765                cubic meters              m3

                 NOTE: volumes greater than 1000 L shall be shown in m3

                                            MASS

  oz            ounces                      28.35                   grams                  g

  lb            pounds                      0.454                 kilograms                kg

                                                                  megagrams
  T       short tons (2000 lb)              0.907                                      Mg (or "t")
                                                               (or "metric ton")

                                 TEMPERATURE (exact degrees)

  o                                       5 (F-32)/9                                       o
      F       Fahrenheit                                            Celsius                    C
                                         or (F-32)/1.8

                                                               FEDERAL TRANSIT ADMINISTRATION           iv
                                                                       FEDERAL TRANSIT ADMINISTRATION        ii
REPORT DOCUMENTATION PAGE                                            Form Approved
                                                                     OMB No. 0704-0188
Public reporting burden for this collection of information is estimated to average 1 hour per response, including the time for reviewing instruc-
tions, searching existing data sources, gathering and maintaining the data needed, and completing and reviewing the collection of information.
Send comments regarding this burden estimate or any other aspect of this collection of information, including suggestions for reducing this
burden, to Washington Headquarters Services, Directorate for Information Operations and Reports, 1215 Jefferson Davis Highway, Suite 1204,
Arlington, VA 22202-4302, and to the Office of Management and Budget, Paperwork Reduction Project (0704-0188), Washington, DC 20503.

1. AGENCY USE ONLY                         2. REPORT DATE                                     3. REPORT TYPE AND DATES COVERED
                                              January 2017                                       NEPA Programmatic Study, 2015-2016
4. TITLE AND SUBTITLE                                                                         5. FUNDING NUMBERS
   Greenhouse Gas Emissions from Transit Investment Development: Programmatic                    TF08A1
   Assessment
6. AUTHOR(S)
   Carson Poe, Gina Filosa, Volpe National Transportation Systems Center
   Maya Sarna, FTA Office of Planning and Environment, Office of Environmental Programs

7. PERFORMING ORGANIZATION NAME(S) AND ADDRESSE(ES)                                          8. PERFORMING ORGANIZATION REPORT NUMBER
  U.S. Department of Transportation
  Federal Transit Administration                                                                 FTA Report No. 0097
  Office of Environmental Programs
  1200 New Jersey Ave, SE
  Washington, D.C. 20590

9. SPONSORING/MONITORING AGENCY NAME(S) AND ADDRESS(ES)                                       10. SPONSORING/MONITORING AGENCY REPORT
                                                                                                 NUMBER

                                                                                                 FTA Report No. 0097

11. SUPPLEMENTARY NOTES         [http://www.transit.dot.gov/about/research-innovation

12A. DISTRIBUTION/AVAILABILITY STATEMENT                                                      12B. DISTRIBUTION CODE
     Available from: National Technical Information Service (NTIS), Springfield, VA 22161.
     Phone 703.605.6000, Fax 703.605.6900, email [orders@ntis.gov]

13. ABSTRACT
   The National Environmental Policy Act (NEPA) requires federal agencies to disclose and analyze the environmental effects of their
   proposed actions. The Federal Transit Administration (FTA) currently believes that assessing the effects of greenhouse gas (GHG)
   emissions and climate change for transit projects at a programmatic level is practicable. This programmatic assessment serves to (1)
   report on whether certain types of proposed transit projects merit detailed analysis of their GHG emissions at the project level and (2)
   be a source of data and analysis for FTA and its grantees to reference in future environmental documents for projects in which detailed,
   project-level GHG analysis is not vital.

14. SUBJECT TERMS                                                                             15. NUMBER OF PAGES
    Greenhouse gas emissions, GHG, transit, NEPA, environmental review                          55

 16. PRICE CODE

 17. SECURITY CLASSIFICATION       18. SECURITY CLASSIFICATION          19. SECURITY CLASSIFICATION         20. LIMITATION OF ABSTRACT
     OF REPORT                         OF THIS PAGE                         OF ABSTRACT
     Unclassified                      Unclassified                        Unclassified

                                                                                             FEDERAL TRANSIT ADMINISTRATION                         v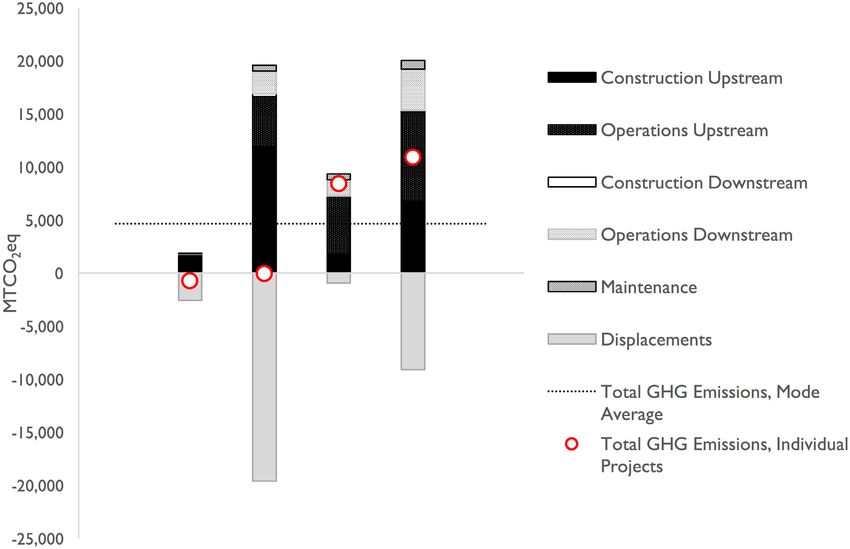
TABLE OF CONTENTS

         1    Executive Summary
         2    Section 1:    Introduction
          4   Section 2:    Transit Open Data
          4     Typology Matrix of Greenhouse Gas Emissions
         17     Scenario Testing
         21   Section 3:    Results
         21     Bus Rapid Transit Sample Results
         23     Streetcar Sample Results
         24     Light Rail Sample Results
         25     Commuter Rail Sample Results
         26     Heavy Rail Sample Results
         27     Impact of Electricity Source on Results
         28     Results Factoring Ridership
        30    Section 4:    Conclusions
        31      Mitigation Strategies
        34    Glossary
        36    Appendix A:      GREET Rail Module Analysis
        38    Appendix B: Electric Rail Vehicle Operations Emission
                Factors by eGrid Subregions
        40    Appendix C: Transit Scenario Emissions Analysis Results
         42   References

                                                    FEDERAL TRANSIT ADMINISTRATION   vi
LIST OF FIGURES

                  Figure 3-1:     Total GHG Emissions by Transit Project Analyzed
         22       Figure 3-2:     GHG Emissions from Sample BRT Projects by Project Phase
         23       Figure 3-3:     GHG Emissions from Sample Streetcar Projects by
                                  Project Phase
         24       Figure   3-4:   GHG Emissions from Light Rail Projects by Project Phase
         26       Figure   3-5:   GHG Emissions from Commuter Rail Projects by Project Phase
         27       Figure   3-6:   GHG Emissions from Heavy Rail Projects by Project Phase
         28       Figure   3-7:   Total GHG Emissions For Light Rail Project From Sample With
                                  Highest Emissions Using Different Electricity Generation Mixes

LIST OF TABLES

           5      Table   2-1:    Consolidated Transit Modes for Programmatic Assessment
           7      Table   2-2:    GHG Emissions sources Included in Matrix by Scope
           8      Table   2-3:    Transit GHG Emissions Factor Typology Matrix
          10      Table   2-4:    Typology Matrix Data Sources
          18      Table   2-5:    GHG Emissions Sources in Scenario Results by Inclusion
                                  Status
         29       Table 3-1:      Estimated Annual GHG Emissions Factoring Ridership and
                                  Auto Occupancy
         32       Table 4-1:      Example Transit Agency GHG Emissions Mitigation Strategies
                                  and Tactics
         33       Table 4-2:      Summary of GHG Emissions Reduction CostEffectiveness and
                                  Maximum Annual Emission Reduction of Various Transit
                                  Tactics Considered by LA Metro
         36       Table A-1:      Comparison of Derived Rail Operations Emissions Multipliers,
                                  MTCO2eq/Vehicle-Mile
         37       Table A-2:      Estimated GHG Emissions from Operation of Sample Rail
                                  Transit Projects

                                                       FEDERAL TRANSIT ADMINISTRATION         vii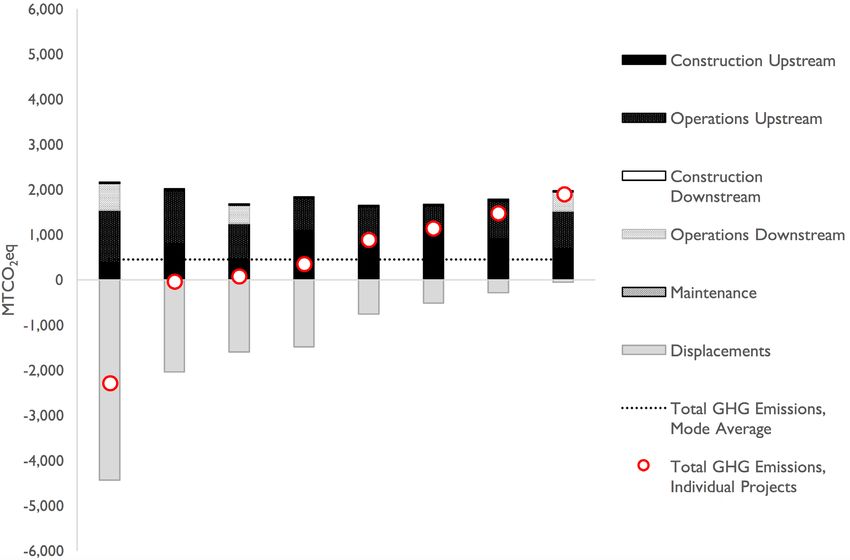
ACKNOWLEDGMENTS

The U.S. Department of Transportation’s Volpe National Transportation Systems
Center (Volpe Center) in Cambridge, Massachusetts, prepared this report for
the Federal Transit Administration (FTA) Office of Environmental Programs. The
Volpe project team included Gina Filosa, Carson Poe, Alexandra Oster, Leslie
Stahl, Dr. Aviva Brecher, Rebecca Blatnica, Andrew Malwitz, and Adam Perruzzi.

Maya Sarna of FTA’s Office of Planning and Environment, Office of Environmental
Programs guided the design of the methodology, analysis of the data, and
development of the report.

FTA and the Volpe Center wish to thank the numerous stakeholders who
contributed data useful in completing this research, including staff from
Intercity Transit, Utah Transit Authority, New York City Transit, Southeastern
Pennsylvania Transportation Authority, Massachusetts Bay Transportation
Authority, Transit Authority of River City, Los Angeles County Metropolitan
Transportation Authority, King County Metro Transit, Bi-State Development
Agency.

Special thanks also are due to John Davies and Jeff Houk of the Federal Highway
Administration; Christopher VanWyk, Jeffrey Roux, Kenneth Cervenka, and
Nazrul Islam of FTA’s Office of Planning and Environment; Joshua Proudfoot and
Aaron Toneys of Good Company; Christopher Porter of Cambridge Systematics;
and Dr. Mikhail Chester of Arizona State University. Their insight and feedback
greatly assisted the project team’s efforts in developing this report.

                                       FEDERAL TRANSIT ADMINISTRATION            viii
ABSTRACT

The National Environmental Policy Act (NEPA) requires federal agencies to
disclose and analyze the environmental effects of their proposed actions. The
Federal Transit Administration (FTA) currently believes assessing the effects of
greenhouse gas (GHG) emissions and climate change for transit projects at a
programmatic level is practicable. This programmatic assessment serves to (1)
report on whether certain types of proposed transit projects merit detailed
analysis of their GHG emissions at the project level and (2) be a source of
data and analysis for FTA and its grantees to reference in future environmental
documents for projects where detailed, project-level GHG analysis is not vital.

                                        FEDERAL TRANSIT ADMINISTRATION             ix
ACRONYMS AND ABBREVIATIONS
APTA American Public Transportation Association
BRT Bus Rapid Transit
CEQ Council on Environmental Quality
CIDI Compression-ignition direct-injection
CIG Capital Improvement Grants Program
CNG Compressed natural gas
CO2 Carbon dioxide
CR Commuter rail
DR Demand response
eGRID Emissions & Generation Resource Integrated Database
EPA Environmental Protection Agency
FHWA Federal Highway Administration
FTA Federal Transit Administration
GHG Greenhouse gas
GREET Greenhouse Gases, Regulated Emissions, and Energy Use in
Transportation
HR Heavy rail
ICE Infrastructure Carbon Estimator
kWh Kilowatt hour
LNG Liquefied natural gas
LPG Liquefied petroleum gas
LR Light rail
MBTA Massachusetts Bay Transportation Authority
MPO Metropolitan planning organization
MT Metric ton
MTCO2e Metric ton of carbon dioxide equivalent
NEPA National Environmental Policy Act
NTD National Transit Database
PaLATE Pavement Lifecycle Assessment Tool
SI Spark-ignition
TCRP Transit Cooperative Research Program
TIP Transportation Improvement Plan
TRB Transportation Research Board
USDA U.S. Department of Agriculture
VMT Vehicle miles traveled
FEDERAL TRANSIT ADMINISTRATION xEXECUTIVE The National Environmental Policy Act (NEPA) requires federal agencies to
SUMMARY disclose and analyze the environmental effects of their proposed actions. The
Federal Transit Administration (FTA) currently considers it practicable to assess
the effects of greenhouse gas (GHG) emissions and climate change for transit
projects at a programmatic level. This programmatic assessment serves to:
• Report on whether certain types of proposed transit projects merit detailed
analysis of their GHG emissions at the project-level.
• Provide a source of data and analysis for FTA and its grantees to reference
in future environmental documents for projects in which detailed, project-
level GHG analysis would provide only limited information beyond what is
collected and considered in this programmatic analysis.
The project team developed and applied a GHG emissions Typology Matrix
(Matrix) to estimate partial lifecycle emissions for the construction, operations,
and maintenance phases of sample bus rapid transit (BRT), streetcar, light rail,
commuter rail, and heavy rail projects. A full lifecycle assessment accounts for
the GHG emissions from raw material extraction through materials processing,
manufacture, distribution, use, repair and maintenance, and disposal or recycling.
The Matrix represents a lookup table of select emissions factors that allows
users to estimate GHG emissions that transit project development generates,
less personal vehicle emissions displaced due to transit’s “ridership effect” (i.e.,
shifting drivers from private vehicles). The Matrix offers practitioners a simplified
resource for estimating GHG emissions using limited project information.
Results suggest that BRT and streetcar projects generate relatively low levels of
GHG emissions primarily due to their low infrastructure needs and low annual
transit vehicle miles traveled (VMT). Results for light rail projects suggest that
projects with a high ridership effect, regardless of length, alignment, and number
of stations, result in a net reduction in GHG emissions. Similarly, commuter rail
projects with a high ratio of displaced VMT to transit VMT are expected to result
in low or net reductions in GHG emissions. Heavy rail projects also may have this
impact, but the sample was too small to draw this conclusion.
In cases in which project characteristics and assumptions are similar to those
analyzed here, transit agencies considering BRT, streetcar, light rail, commuter
rail, and heavy rail projects may incorporate this programmatic assessment by
reference into their NEPA analyses. It is recommended that light, commuter, and
heavy rail projects that have characteristics that differ from the sample analyzed
here use the Matrix or another locally-recommended approach to make project-
specific GHG emissions estimates in their NEPA analyses.
In no case is the use of the Matrix mandatory, and transit agencies should work
with FTA Regions to determine whether to conduct project-specific analyses and
the best approach for doing so.
FEDERAL TRANSIT ADMINISTRATION 1SECTION
Introduction
1 Human activities have elevated atmospheric concentrations of greenhouse gases,1
particularly carbon dioxide (CO2), to levels unprecedented in at least the last
800,000 years. These emissions, along with emissions from natural substances
and processes, are drivers of climate change (Intergovernmental Panel on
Climate Change 2014). In the United States, transportation is a leading source
of greenhouse gas (GHG) emissions, accounting for the second largest portion
of U.S. GHG emissions after electricity production (Environmental Protection
Agency 2015). Within the transportation sector in 2014, light-duty vehicles2
accounted for the majority (61%) of GHG emissions, whereas bus and rail
accounted for a comparatively small proportion, 1% and 2%, respectively (EPA
2016a).
The National Environmental Policy Act of 1969, as amended (42 U.S.C. 4321-4327
and 40 C.F.R. Parts 1500-1508) (NEPA), requires federal agencies to evaluate
and disclose the environmental effects of their proposed actions. NEPA analyses
of GHG emissions and climate change pose difficult challenges in assuring that
meaningful analysis is provided. Virtually any human activity, including those
that federal agencies fund or permit, can cause emissions of GHGs, yet it is
unlikely that any individual project would generate enough GHG emissions to
significantly influence global climate change. Instead, a project contributes to
the global climate impact incrementally and cumulatively, combining with the
emissions from all other sources of GHGs. In August 2016, the Council on
Environmental Quality (CEQ) released final guidance for federal agencies on
how to consider the impacts of their actions on global climate change in their
NEPA reviews (CEQ 2016). The guidance provides a framework for agencies to
consider the effects of a proposed action on climate change, as indicated by its
estimated GHG emissions. The guidance emphasizes that agency analyses should
be commensurate with projected GHG emissions and climate impacts and that
they should employ appropriate quantitative or qualitative analytical methods to
ensure that useful information is available to inform the public and the decision-
making process in distinguishing between alternatives and mitigations.
The CEQ guidance acknowledges that incorporation by reference is of great
value in considering GHG emissions or the implications of climate change for
the proposed action and its environmental effects. The guidance notes that “an
agency may decide that it would be useful and efficient to provide an aggregate
1
Greenhouse gases include carbon dioxide, methane, nitrous oxide, hydrofluorocarbons,
perfluorocarbons, and sulfur hexafluoride. The common unit of measurement for greenhouse
gases is metric tons of CO2 equivalent (MTCO2e).
2
Includes passenger cars and light-duty trucks.
FEDERAL TRANSIT ADMINISTRATION 2SECTION 1: INTRODUCTION
analysis of GHG emissions or climate change effects in a programmatic analysis
and then incorporate by reference that analysis into future NEPA reviews” (CEQ
2016). The Federal Transit Administration (FTA) considers it practicable to
assess the effects of GHG emissions and climate change for transit projects at a
programmatic level.
This programmatic assessment presents results from an analysis to estimate
direct and indirect GHG emissions generated from the construction, operations,
and maintenance phases of projects across selected transit modes. The findings
provide a reference for FTA and its grantees to use in future NEPA documents
to describe the effects of proposed transit investments on partial lifecycle GHG
emissions.3 This assessment’s results can inform transit project proponents who
are considering the implications GHG emissions of future transit investments or
who might independently want to evaluate the GHG emissions benefits and cost
of such investments.
3
A full lifecycle assessment accounts for GHG emissions from “cradle to grave—in other words,
from raw material extraction through materials processing, manufacture, distribution, use,
repair and maintenance, and disposal or recycling. See the Methodology and Data Limitations
sections for information on the phases included in this assessment.
FEDERAL TRANSIT ADMINISTRATION 3SECTION
Methodology
2 The project team’s analytical approach involved creating a typology matrix of
GHG emissions factors4 and then applying the typology matrix to a sample of
transit project scenarios to estimate the GHG emissions generated. Each of
these aspects is described below. The assessment focuses on GHG emissions
from transit projects in the United States.
Typology Matrix of GHG Emissions
The project team extensively reviewed literature to understand the state of the
practice in quantifying GHG emissions associated with transit projects and to
identify and assess existing GHG estimation tools and emissions factors. The
literature review included research studies, peer-reviewed practice papers, white
papers, and federal funding and oversight programs published primarily between
2005 and 2015.
Generally, the literature acknowledges transit’s role in reducing GHG emissions,
largely holding that public transportation produces lower GHGs per person trip
than personal vehicles (e.g., American Public Transportation Association [APTA]
2014, Chester et al. 2013, Transit Cooperative Research Program [TCRP]
2013, Southworth et al. 2011, FTA 2010, TCRP 2010a, and TCRP 2008). This
is especially the case when transit ridership levels are high enough such that
more emissions are displaced from private travel than are emitted from transit
vehicles themselves or when transit spurs denser land use development patterns
(TCRP 2010b, TCRP 2015, Transportation Research Board 2009). A subset of
researchers has challenged the degree to which transit systems can offset or
displace other transportation system emissions (O’Toole 2008, Greene and
Plotkin 2011).
Despite the considerable body of literature regarding transit’s GHG emissions
role, project-level quantification of transit GHG emissions has been limited.
Currently, few state and local governments require the project-level analysis
of GHG emissions during the environmental review process. The project team
investigated the requirements for completing project level analyses in places in
which such requirements do exist, as well as more than 120 recent environmental
documents for transit projects in these and other locations to understand better
4
An emission factor is the average GHG emission rate from a given source, relative to units of
activity.
FEDERAL TRANSIT ADMINISTRATION 4SECTION 2: METHODOLOGY
where project-specific GHG analyses have occurred, the methods and tools
used, and the associated data needs. 5
The project team then identified a comprehensive list of GHG emission sources
for the construction, maintenance, and operation phases of a transit project.
The emissions sources were classified by transit mode, vehicle and fuel type,
and facility type. The transit modes considered were those reported to FTA’s
National Transit Database (NTD), the nation’s primary resource for information
and statistics on American transit systems. For the purposes of this assessment,
some NTD transit modes were consolidated into broader categories due to the
similarities of their emissions sources. Others were excluded from the analysis
due to their low and infrequent receipt of federal funding relative to other modes
or the lack of available data regarding their associated GHG emissions (see Table
2-1).6
Table 2-1 NTD Modes Consolidated Mode
Consolidated Heavy Rail (HR) Heavy Rail (HR)
Transit Modes Alaska Railroad
for Programmatic Commuter Rail (CR) Commuter Rail (CR)
Assessment Hybrid Rail
Light Rail (LR) Light Rail (LR)
Streetcar Streetcar
Bus Rapid Transit
Commuter Bus
Bus Rapid Transit
Conventional Bus, includes Articulated Bus
Trolleybus
Demand Response (DR), including DR Taxi
DR/Vanpool
Vanpool
Ferryboat Excluded
Aerial Tramway
Cable Car
Inclined Plane
Jitney Excluded
Publico
Monorail/Automated Guideway or People Mover
The project team used the literature review to identify available tools and data
resources to estimate the direct and indirect GHG emissions generated from
each of the identified transit GHG emissions sources. Direct GHG emissions are
caused by sources that a transit agency owns or controls, typically transit vehicle
power, propulsion, and maintenance, and power production or fuel combustion
5
As of June 2016, California and Massachusetts require project-level GHG emissions
quantification for all statewide projects subject to the respective state environmental policy acts.
Minnesota, New York, and Washington have requirements that apply only to projects under
jurisdiction of select agencies with GHG or climate change analysis policy requirements.
6
Ferryboats were excluded due to a lack of available data and/or tools regarding their associated
GHG emissions.
FEDERAL TRANSIT ADMINISTRATION 5SECTION 2: METHODOLOGY
at transit facilities. Indirect transit GHG emissions are produced by a separate
organization as a result of a transit agency’s activities, such as the purchase of
electricity to power light rail vehicles or facilities or the contracted construction
of a transit facility.
A convention of GHG inventory reporting protocols is to categorize GHG
emissions by “scope” (Climate Registry 2013, World Resources Institute 2010,
EPA 2016):
• Scope 1 (direct) GHG emissions include direct emissions from vehicle
fleet operations, facilities, and sources under the transit agency’s operational
control. The decisions a transit agency makes (regarding propulsion
technology, for example) can directly influence the annual volume of
greenhouse Scope 1 emissions.
• Scope 2 (indirect) GHG emissions are emissions from purchased
electricity, heating and cooling, and steam that are consumed within the
transit agency’s organizational boundaries. Although these emissions are the
result of a transit agency’s activities, the emissions are produced by other
emitters, typically power plants.
• Scope 3 (other) GHG emissions are indirect emissions not included
in Scope 2. Although emissions from these sources are also a result of the
transit agency’s activities, they are ultimately sources beyond the agency’s
control, as they reflect the GHG emissions from personal vehicles between
residences or other locations to and from transit stations and/or work.
The comprehensive list of transit GHG emissions sources was narrowed to align
with the consolidated transit modes and data or tools available to estimate their
GHG emissions. Table 2-2 presents the transit emission sources included in this
analysis by their scopes.
FEDERAL TRANSIT ADMINISTRATION 6SECTION 2: METHODOLOGY
Table 2-2 GHG Emissions Sources Included in Matrix by Scope
Emissions Sources Excluded from
Direct (Scope 1) Indirect (Scope 2) Indirect (Scope 3)
Related to Matrix7
Construction • Tree removal • Contracted • Construction-induced
transitway track, congestion
station, and parking • Third rail system of
construction electrification
• Contracted paving of • “Other” facilities’ construction
separated rights-of- (administrative buildings,
way maintenance/storage facilities,
• Contracted catenary intermodal hub, traction
system construction/ substations, etc.).
copper • Transit vehicle manufacture
Maintenance • Routine transitway • Routine station and facility
maintenance maintenance
• Routine pavement • Waste disposal
maintenance
• Routine vehicle maintenance
Operations • Operation of transit vehicles • Purchased • Transit access trips • Operation of “other” facilities
fueled by non-electricity fuels electricity for (i.e., administrative buildings,
• Boiler/furnace combustion transit vehicles, intermodal hubs, etc.)
for stations and maintenance/ stations, • Electricity/steam transmission
storage facilities. maintenance/ and distribution losses
• Operation of non-revenue storage facilities, • Refrigerants
vehicles fueled by non- and parking
electricity fuels facilities.
Displacements • Operation of • Congestion relief
personal vehicles • Transit-oriented development
The project team used available GHG emissions factors and estimation tools to
develop a “GHG Emissions Typology Matrix” (Matrix). The Matrix (Table 2-3)
represents a lookup table of select emissions factors that allows users to calculate
partial lifecycle GHG emissions estimates by transit mode for the construction,
maintenance, and operations phases of transit project development, less personal
vehicle emissions displaced due to transit’s “ridership effect.” It provides scalable
estimates for upstream and downstream emissions for each emissions source8 in
that it presents the emissions per unit of each GHG emissions source in terms of
metric tons of CO2 equivalent (MTCO2eq).9 Although the Matrix lacks the precision
that may be attainable by using more complex emission models or route-specific
ridership estimates, it provides a resource to generate coarse but informative
estimates of GHG emissions for a broad range of transit projects. The following
section provides more detail about the emission factors included in the Matrix.
7
These sources were excluded due to a lack of data or tools available to estimate their GHG
emissions. Transit vehicle manufacture was excluded due to a lack of data that reflect the
diversity of transit vehicle types that transit agencies in the United States use.
8
See the Methodology section for information on the upstream and downstream emissions
associated with each phase.
9
Carbon stock loss due to removal of trees is presented in the Matrix as metric tons of CO2 /
tree, not CO2eq/tree.
FEDERAL TRANSIT ADMINISTRATION 7SECTION 2: METHODOLOGY
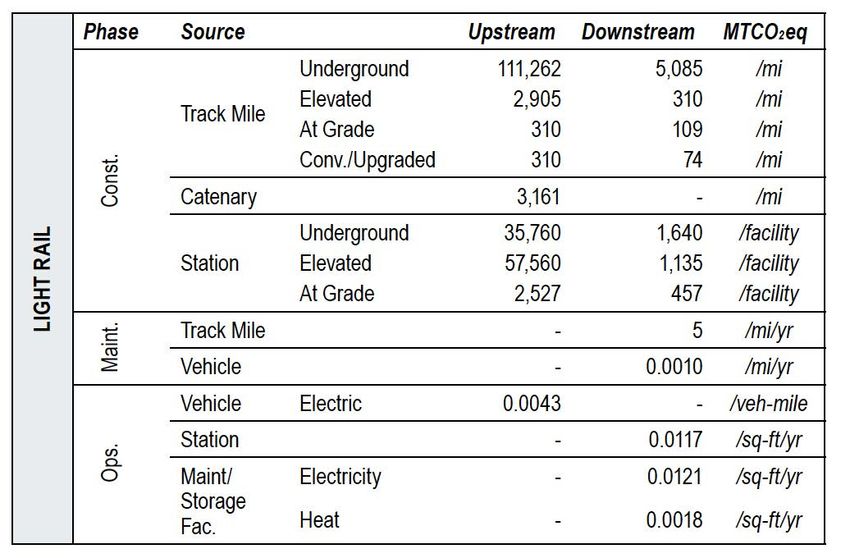
Table 2-3 Transit GHG Emissions Factor Typology Matrix
Phase Source Upstream Downstream MTCO2eq
Underground 111,262 5,085 /mi
Track Mile Elevated 3,223 717 /mi
At Grade 580 362 /mi
Const.
Catenary 3,161 - /mi
Underground 143,384 1,640 /facility
HEAVY RAIL
Station Elevated 133,694 1,135 /facility
At Grade 81,764 457 /facility
Track Mile - 5 /mi/yr
Maint.
Vehicle - 0.0003 /mi/yr
Vehicle Electric 0.0030 - /veh-mile
Station - 0.0117 /sq-ft/yr
Ops.
Maint/ Electricity - 0.0121 /sq-ft/yr
Storage
Fac. Heat - 0.0018 /sq-ft/yr
Phase Source Upstream Downstream MTCO2eq
Underground 111,262 5,085 /mi Phase Source Upstream Downstream MTCO2eq
Elevated 3,223 717 /mi New BRT Lane/ROW 248 197 /mi
Track Mile
At Grade 580 362 /mi Conv./Upgraded Lane/ROW 158 70 /mi
Const.
Conv./Upgraded - - /mi Trolleybus Catenary 902 - /mi
Const.
Catenary 3,161 - /mi Station 2,527 9 /facility
BUS/BUS RAPID TRANSIT
COMMUTER RAIL
Underground 143,384 1,640 /facility Pavement, BRT - 3 /mi/yr
Maint.
Station Elevated 133,694 1,135 /facility Vehicle - 0.00005 /veh/yr
At Grade 81,764 457 /facility Vehicle Electric 0.0017 0.0000 /veh-mile
Track Mile - 5 /mi/yr Diesel 0.0005 0.0027 /veh-mile
Maint.
Vehicle - 0.0010 /mi/yr Biodiesel 0.0001 0.0022 /veh-mile
LNG 0.0007 0.0026 /veh-mile
Vehicle Electric 0.0029 - /veh-mile
CNG 0.0008 0.0026 /veh-mile
Ops.
Diesel 0.0109 0.0029 /veh-mile
Station Electricity - 0.0117 /sq-ft/yr
Station - 0.0117 /sq-ft/yr
Ops.
Heat - 0.0017 /sq-ft/yr
Maint/ Electricity - 0.0121 /sq-ft/yr
Storage Maint/Storage Facility Electricity - 0.0152 /sq-ft/yr
Fac. Heat - 0.0018 /sq-ft/yr Heat - 0.0010 /sq-ft/yr
FEDERAL TRANSIT ADMINISTRATION 8SECTION 2: METHODOLOGY
Table 2-3 (cont’d.) Transit GHG Emissions Factor Typology Matrix
Phase Source Upstream Downstream MTCO2eq
Vanpool Diesel 0.0002 0.0011 /mi
Gas 0.0002 0.0010 /mi
DR, VANPOOL, DISPLACED AUTOS
Ethanol -0.0001 0.0013 /mi
Sedan/Auto Gas, Ethanol 0.0001 0.0003 /mi
CNG, LPG 0.0001 0.0003 /mi
H (gaseous) 0.0005 - /mi
HEV 0.0001 0.0002 /mi
Ops.
Bio/Diesel 0.0000 0.0003 /mi
School Bus Diesel 0.0003 0.0015 /mi
Biodiesel 0.0001 0.0012 /mi
LPG 0.0003 0.0015 /mi
CNG 0.0004 0.0014 /mi
Demand Diesel 0.0005 0.0027 /mi
Response Bus Biodiesel 0.0001 0.0022 /mi
CNG 0.0008 0.0026 /mi
Phase Source Upstream Downstream MTCO2eq
Lot 1 - /space
PARKING
Ops. Const.
Garage 5 - /space
Lot - 0.0001 /space/yr
Garage - 0.0001 /space/yr
CARBON STORAGE Upstream Downstream MTCO2eq
C Sequestration Loss Due to Tree Removal - 0.8368 /tree/yr
FEDERAL TRANSIT ADMINISTRATION 9SECTION 2: METHODOLOGY
Typology Matrix Data Sources
Table 2-4 lists the data resources used to develop the emissions factors included
in the Matrix. The following section describes each of the data resources in
depth.
Table 2-4 Phase Mode Sources Data Resource
Typology Matrix Data New, at-grade HR, CR, LR track
Sources New, elevated HR, CR, LR track
New, underground HR, CR, LR track
Converted or upgraded existing LR track FHWA ICE
Rail10 New, at-grade HR, CR, LR station
New, elevated HR, CR LR station
New, underground HR, CR, LR station
Construction Rail catenary system Hanson et al. 2014
BRT new lane or right-of-way
BRT converted or upgraded lane FHWA ICE
Bus/BRT New, at-grade station
Trolleybus catenary system Hanson et al. 2014
Surface parking
Parking FHWA ICE
Structured parking
Rail HR, CR, LR vehicle Chester, 2008
Maintenance HR, CR, LR track FHWA ICE
Bus/BRT
BRT pavement FHWA ICE
HR electric NTD electricity use
LR electric and VMT data; EPA
Rail CR electric eGRID 2012
CR diesel and biodiesel GREET
Vehicle Electric vehicle
Operation Diesel vehicle
Bus/BRT Biodiesel vehicle GREET
LNG vehicle
CNG vehicle
DR/Vanpool Sedans, vans, buses of various fuel types GREET
Station electricity Energy use data from
Station heating one transit agency
Rail
Maintenance/storage electricity Energy use data from
Maintenance/storage heat seven transit agencies
Facility Station electricity Energy use data from
Operation Station heating one transit agency
Bus/BRT
Maintenance/storage electricity Energy use data from
Maintenance/storage heat seven transit agencies
Surface parking
Parking FHWA ICE
Structured parking
Carbon Carbon sequestration loss due to tree USDA; Zhao and
Storage removal Sander (2015)
10
Rail includes heavy rail, commuter rail, light rail, and streetcar.
FEDERAL TRANSIT ADMINISTRATION 10SECTION 2: METHODOLOGY
Construction-related Emissions Factors
In the construction phase of a transit project, upstream emissions are the
emissions associated with the extraction, transport, and production of the
materials used in the construction of the facilities (e.g., asphalt, concrete, base
stone, and steel). Downstream construction emissions are tailpipe emissions
resulting from the operation of construction vehicles and equipment. The
primary data sources for construction-related GHG emissions factors in the
Matrix are the Federal Highway Administration’s (FHWA) Infrastructure Carbon
Estimator (ICE) and research by Hanson et al. (2014).
FHWA’s ICE is a spreadsheet tool that estimates the lifecycle energy and
GHG emissions from the construction and maintenance of transportation
facilities. ICE’s lifecycle emissions include those resulting from the operation of
construction vehicle and equipment and the embodied energy and emissions
associated with the extraction, transport, and production of the materials
(i.e., asphalt, concrete, base stone, and steel) used in the construction of
the transportation facilities. The information in ICE is based on a nationwide
database of construction bid documents, data collected from state Departments
of Transportation, and consultation with transportation engineers and lifecycle
analysis experts. ICE use emission factors from the Pavement Lifecycle
Assessment Tool (PaLATE).
Hanson et al. (2014) provides a technique to assess the GHG emissions
associated with the construction of commuter rail projects, with focus given
to the lifecycle emissions associated with materials used to construct track,
catenary systems, station platforms, parking facilities, and tunnels and bridges.
Maintenance-related Emissions Factors
Maintenance-phase GHG emissions are all considered downstream emissions.
The Matrix includes GHG emission factors for maintenance of track/lane-miles
and transit vehicles. The GHG emission factors for track/lane-mile maintenance
are based on FHWA’s ICE. The ICE tool accounts for direct emissions associated
with routine maintenance activities such as snow removal and vegetation
management, among other activities. The ICE tool used data from the Los
Angeles County Metropolitan Transportation Authority (LACMTA) and the
NTD to estimate total fuel use for rail-related maintenance activities.
The Matrix’s GHG emission factors for vehicle maintenance are based on
research by Chester (2008), which calculated the GHG emissions for vehicle
maintenance for buses and rail. GHG emission rates for bus vehicle maintenance
are based on a 40-foot bus. Chester provides GHG emission rates for rail
vehicle maintenance, which includes routine maintenance (standard upkeep and
inspection), cleaning, and flooring replacement, for four types of vehicles: Bay
Area Rapid Transit (BART) heavy rail trains, Caltrain commuter rail trains, Muni
FEDERAL TRANSIT ADMINISTRATION 11SECTION 2: METHODOLOGY
light rail trains, and the Massachusetts Bay Transit Authority’s (MBTA) Green
Line light rail trains. The emissions factors in the Matrix for the heavy rail and
commuter rail maintenance are from the Chester report; the emissions factors
in the Matrix for light rail vehicle maintenance are an average of the Muni and
MBTA light rail vehicle emissions estimates from Chester (2008).
Operations-related Emissions Factors
Vehicle Operations
The Matrix includes upstream and downstream GHG emissions factors for
the operation of road- and rail-based transit vehicles across a range of fuel
sources. During the operations phase, upstream emissions are associated with
the extraction, production, and transportation of the vehicle fuel; downstream
emissions are the tailpipe emissions resulting from the operation of a transit
vehicle.
Emissions factors for road-based vehicles, including buses, were derived from
Argonne National Laboratory’s Greenhouse Gases, Regulated Emissions, and
Energy Use in Transportation (GREET) Model, 2015 release.
The Matrix’s downstream emissions factors for road vehicle operations
represent GREET’s default “pump-to-wheels”11 emissions factors for the 2015
simulation year. The Matrix’s upstream emissions (well-to-pump)12 figures for
road vehicle operations were derived by subtracting GREET’s pump-to-wheels
emissions factors from GREET’s “well-to-wheels” emissions factors:
Upstream vehicle operations emissions = GREET well-to-wheels – GREET pump-to-wheels
The vehicle types in the Matrix use the following GREET vehicle types:
• Electric bus: Heavy-Duty, Transit Bus, Electric Vehicle, U.S. mix
• Diesel bus: Heavy-Duty, Transit Bus, Compression-ignition direct-injection
(CIDI) diesel
• Biodiesel bus: Heavy-Duty, Transit Bus, CIDI biodiesel
• Liquefied natural gas (LNG) bus: Heavy-Duty, Transit Bus, Spark-ignition (SI)
Vehicle LNG
• Compressed natural gas (CNG) bus: Heavy-Duty, Transit Bus, SI Vehicle CNG
• Demand response bus: Use same as buses above
• Vanpool diesel: Light Heavy-Duty Vocational Vehicles with diesel as baseline
• Vanpool gas: Medium Heavy-Duty gasoline as baseline
11
Pump-to-wheel emissions are the operational emissions associated with the vehicle technology
(i.e., tail pipe emissions and the energy efficiency of the vehicle).
12
Well-to-pump emissions are those associated with producing the fuel used in the vehicle.
FEDERAL TRANSIT ADMINISTRATION 12SECTION 2: METHODOLOGY
• Vanpool ethanol: Light Heavy Duty, diesel baseline; ethanol as fuel
• All Sedan/Autos: Spark-ignition internal combustion engine vehicles, except for
biodiesel, which is CIDI internal combustion engine vehicle
• School bus diesel: Heavy-Duty, School Bus, CIDI diesel
• School bus biodiesel: Heavy-Duty, School Bus, CIDI biodiesel
• School bus liquefied petroleum gas (LPG): Heavy-Duty, School Bus, SI Vehicle
LPG
• School bus CNG: Heavy-Duty, School Bus, SI Vehicle CNG
The Matrix’s emissions factors for each rail mode’s electric vehicle operations
are based on energy consumption rates derived from energy use and transit
vehicles mile traveled (VMT) data reported in the NTD13 and electricity emission
rates from the EPA’s Emissions & Generation Resource Integrated Database
(eGRID) 2012. The following calculations were made for each rail mode:
(1) Total electricity use for years 2010–2014 (kilowatt-hours (kWh) /
Total VMT for years 2010–2014 = kWh used per VMT
(2) kWh per VMT * eGRID2012 annual total output emission rate14 =
GHG emissions per VMT
Commuter rail consumes both diesel and electricity; however, NTD does not
report VMT by diesel and electricity separately.15 The VMT of 4 of 24 commuter
rail systems nationwide for which NTD has data reported are powered all
electrically. For electrically-powered commuter rail, VMT and kWh data from
NTD 2014 for the four all-electric commuter rail systems were used to calculate
the energy consumption information used in the Matrix’s commuter rail electric
operations factors. For diesel and biodiesel-powered commuter rail, GREET was
used to estimate GHGs following the method described in Appendix A.
Facility Operations
The Matrix includes GHG emission factors for the operation of both rail
and bus stations and maintenance and storage facilities. The project team
calculated emissions factors for maintenance and storage facilities based on
annual electricity and heating usage data that seven transit agencies provided
for a variety of their facilities; the estimates for GHG emissions from station
electricity are based on data from two subway stations. The project team
aggregated the information and estimated the average annual electricity and
13
The project team analyzed the GREET rail module as an alternative data source for estimating
GHG emissions from rail operations. See Appendix A for a description of the analysis.
14
eGRID annual total output emission rates are available at www.epa.gov/sites/production/
files/2015-10/documents/egrid2012_summarytables_0.pdf, last accessed 9/16/16.
15
Data for one biodiesel-only commuter rail system is reported to the NTD.
FEDERAL TRANSIT ADMINISTRATION 13SECTION 2: METHODOLOGY
heating fuel usage per square foot by facility type.16 The aggregate average annual
electricity data (kWh) and heat data, provided in gallons of heating oil, therms
of natural gas, and cubic feet of natural gas, were converted to GHG emissions
using the following conversion factors:
1 kWh electricity = 0.000689551 MTCO2 (per EPA)17
0.01010 MCF natural gas = 1 kWh electricity18
1 therm = 29.3001 kWh electricity
1 gallon residual fuel oil (#6 oil) = 43.9 kWh electricity19
Parking Emissions
The Matrix includes GHG emission factors for the construction of structure
(garage) and surface parking on a per-space basis using data from FHWA’s ICE.
ICE’s parking emissions include those from the operation of construction vehicle
and equipment, and the embodied energy and emissions associated with the
extraction, transportation, and production of the materials (i.e., asphalt and base
course stone) required to construct parking facilities.
Carbon Storage Emissions Factors
The Matrix includes an emissions factor for the annual, per-tree carbon
sequestration20 loss due to tree removal. The project team referred to data from
the U.S. Department of Agriculture (USDA), Novak and Crane (2002), and Zhao
and Sander (2015). The Matrix figure was derived as follows:
(1) 0.22801 MT C stored per urban tree based on data from 11 American
cities (Novak and Crane 2002, Zhao and Sander 2015)
(2) For every 1 MT C stored annually, approximately 3.67 MTCO2 are
sequestered per year (USDA)
(3) 0.22801 MT C stored * 3.67 MTCO2 sequestered per year = 0.8368
MTCO2 sequestered/tree/year
16
Although cubic footage is the preferred unit of measurement for building size, the project team
was limited to the available square footage information.
17
CO2 only
18
Energy Information Administration, www.eia.gov/tools/faqs/faq.cfm?id=667&t=8.
19
www.think-energy.net/energy_units.htm.
20
Carbon sequestration describes the process by which carbon is removed from the atmosphere
and stored in carbon sinks such as oceans, forests, or soils.
FEDERAL TRANSIT ADMINISTRATION 14SECTION 2: METHODOLOGY
The Matrix does not include emissions factors for gains in carbon storage due to
tree plantings; however, the U.S. Forest Service offers a Tree Carbon Calculator
that allows users to make species-, age-, and diameter-specific estimates.21
Typology Matrix Data Quality and Limitations
Construction-Related Emissions
Underground track miles, downstream emissions: ICE’s estimates for
downstream emissions resulting from the construction of new underground
track miles differ based on (1) where the project is located and (2) whether the
track is constructed through hard or soft stone. This is because the analysis for
an underground tunnel involves an estimate of electricity used for the operation
of a tunnel boring machine.22 GHG emissions associated with producing
electricity vary depending on the fuel(s) used to produce the electricity. Since
the fuel mix for electricity production varies geographically across the country,
underground tunnel construction emissions vary depending upon where the
project is located. Constructing tunnels through hard stone also generally
requires more electricity than doing so through soft stone, resulting in relatively
elevated emissions. The Matrix’s underground track construction emissions
factor is based on construction through hard stone in the State of Colorado,
corresponding to ICE’s most conservative emissions estimate (i.e., generates the
greatest amount of GHG emissions).23
Rail and BRT station construction: Due to wide variability in the size,
design, and amenities offered among transit stations, within a transit mode
and among different transit modes, it is difficult to create generic assumptions
regarding station construction. ICE includes emissions factors for commuter
rail stations that are based on the materials required for station structures and
platforms, but the tool does not provide details on the transit station design
upon which its station construction emissions are based. Other potential data
sources for station construction emissions factors exist. For example, Hanson
et al. (2014) includes emissions factors for commuter rail stations that are based
on the materials required for station platforms. It does not include any additional
structures due, according to the authors, in part to the wide variety of potential
structures, ranging from bus shelters to large buildings that provide commuters
with various amenities, such as heated waiting areas. The Matrix’s station
construction emissions figures use ICE’s emissions estimates in order to include
emissions associated with the structure as well as the station platforms.
21
The calculator is available at www.fs.usda.gov/ccrc/tools/tree-carbon-calculator-ctcc.
22
ICE does not include emissions estimates for tunnel blasting.
23
The conservative estimate is 5,085 MTCO2eq per track mile. For comparison, the emissions
factor associated with new construction of one mile of underground track through soft soil
in California, which represents the low-end of the ICE’s underground track construction
emissions range, is 3,204 MTCO2eq per track mile.
FEDERAL TRANSIT ADMINISTRATION 15SECTION 2: METHODOLOGY
Commuter rail emissions: The Matrix’s commuter rail track and commuter
rail station construction emissions factors are based on ICE’s heavy rail
construction estimates. FHWA’s ICE tool provides data for heavy and light rail
only and does not currently include data specific to commuter rail.
Catenary: The Matrix’s catenary system construction emissions factors are
based on data for commuter rail electrified track from Hanson et al. (2014).
The material components for catenary systems in the Matrix’s emissions factors
for commuter rail and light rail include the emissions associated with the steel
and aluminum in the scaffolding and copper in the copper wire. The trolleybus
catenary system emissions factors includes the emissions associated with the
copper component only as the copper requirements for trolleybus overhead
wires are expected to be similar to that for commuter rail. No data regarding
the amount of copper in heavy rail’s third rail or the GHG emissions associated
with that component were readily available and thus are not included in this
analysis or in the Matrix. Due to the lack of data it is unknown whether heavy
rail’s third rail copper component is a considerable source of emissions.
Vehicle Operations-related Emissions
Electric vehicles: The emissions factors in the Matrix for electrically
powered vehicles use the “U.S. Mix” region from the EPA’s eGRID2012, which
represents an average value for the country. The U.S. Mix region emission
rates overestimate emissions for electrically-powered vehicles in regions with
cleaner electricity generation mixes and underestimate emissions for the same
in regions where electricity production is less clean. EPA’s eGRID also provides
GHG emission data at the subregion level, which reflect more region-specific
electricity generation. The eGRID subregion electricity emission factors are
provided in Appendix B.
Transit vehicle operations: GHG emissions factors for transit vehicles are
based solely on VMT by vehicle and fuel type and do not account for additional
location specific factors such as different fleet mixes, vehicle age distributions,
load factors, and speed profiles.
Fuels for buses, demand response vehicles, and vanpools: The Matrix
does not include a comprehensive accounting of all vehicle fuels for buses,
demand response vehicles, and vanpools. Buses operating with gasoline, liquefied
propane gas, ethanol, kerosene, and hydrogen were not included in the Matrix
because data were not readily available.
Facility Operations-related Emissions
Facility operations: Due to the wide variability in transit station and facilities
in term of size, design, amenities offered, and operating efficiencies, it is difficult
to create generic assumptions regarding their associated electricity and heat
FEDERAL TRANSIT ADMINISTRATION 16SECTION 2: METHODOLOGY
usage. This challenge was compounded by the fact that transit agencies provided
the project team with limited data for stations; the current station operation
GHG emissions factor is based on only two data points from one transit agency.
Furthermore, the electricity and heating figure for rail and bus maintenance
and storage facilities are based largely on older buildings. As such, the emission
factors for facility operations in the Matrix are likely conservative because new
buildings are likely more energy efficient than older buildings. Projects to retrofit
or upgrade facilities are expected to improve efficiencies by design.
Displaced Emissions
Congestion relief and land use effect: In addition to displacing VMT,
transit—especially when met with high ridership—can help reduce congestion
and spur more compact, transit-oriented development, thus avoiding GHG
emissions that may have otherwise occurred. Mode shift to transit has the
potential to displace emissions caused by traffic congestion (APTA 2009). Such
congestion relief benefits are achieved through improved operating efficiency of
private automobiles, including reducing idling in stop-and-go traffic, promoting
shorter trips, or avoiding automobile trips all together. Potentially greater GHG
reductions can be achieved through denser development that transit helps to
induce. Some researchers believe that this “land use effect” may result in the
largest GHG emissions reductions, albeit over a decade or longer timeframe
given the relatively slow pace of land development.24 Therefore, when the
congestion relief and land use effect are factored, the total net GHG emissions
for each transit mode is expected to be lower than reported here; data were not
available to estimate the degree of the additional reductions at a programmatic
level.25
Other displaced emissions: The programmatic analysis does not consider
GHG emissions displaced due to a reduced need for highway maintenance or
emission reductions associated with displaced personal vehicle ownership as a
result of the new transit project.
Scenario Testing
The project team quantified the GHG emissions from a sample of transit
projects to analyze the range of emissions associated with different transit
modes and project characteristics (Table 2-5).
24
Nahlik and Chester (2014) explored how desired development patterns and behaviors can be
integrated with lifecycle cost analysis to more fully understand the benefits and costs of moving
people closer to transit.
25
Regarding the land use effect, TRCP Report 176 offers a calculator for estimating the associated
GHG emissions reductions. The calculator could not be applied at a programmatic scale due to
its location-specific nature.
FEDERAL TRANSIT ADMINISTRATION 17SECTION 2: METHODOLOGY
Table 2-5 Emissions Sources Included Emissions Sources Excluded
GHG Emissions • Transitway track construction
Sources in Scenario • Paving of separated rights-of-way
Construction-
Results by Inclusion • Station construction
related • Tree removal
• Parking construction
Status Emissions
• Catenary system construction/
copper
• Routine maintenance of
Maintenance-
transitway
related
• Routine maintenance of pavement
Emissions
• Routine maintenance of vehicles
• Boiler/furnace combustion for stations
and maintenance/storage facilities
Operations- • Purchased electricity for stations,
• Transit vehicle miles traveled
related maintenance/storage facilities, parking
(VMT)
Emissions facilities
• Transit access trips
• Operation of non-revenue vehicles
Displaced • Personal vehicle VMT
Emissions • Transit VMT
The sample included 36 transit projects that applied for funding through the
Section 5309 Capital Investment Grants (CIG) Program in fiscal years 2015
through 2018. The sample included 12 bus rapid transit projects, 10 light rail
projects, 8 streetcar projects, 4 commuter rail projects, and 2 heavy rail
projects. The project team used information provided on the CIG templates for
the following project characteristics to quantify the emissions associated with
each transit project:
• Length of transitway and type of alignment (at-grade, elevated, below-grade)
• Count of stations and their locations in space (at-grade, elevated, below-
grade)
• Count of parking spaces and type (surface or structure)
• Annual VMT by transit mode/technology (the change in annual transit VMT26
between the build and the no-build scenario) for the forecast year
• Annual personal automobile VMT and Transit VMT displaced (the change in
annual VMT between the build and the no-build scenario) for the forecast
year
• Catenary system construction
Due to a lack of available information for the sample transit projects, the
following emission sources were not included in the scenario testing:
• Operation of stations and maintenance/storage facilities
• VMT associated with transit access trips
26
For rail modes, VMT was reported in terms of total rail passenger car mileage.
FEDERAL TRANSIT ADMINISTRATION 18SECTION 2: METHODOLOGY
• Operation of non-revenue vehicles
• Tree removal
To calculate a project’s expected total annual GHG emissions the project team
summed each transit project’s estimated amortized construction emissions,27
annual maintenance-related emissions, and annual operations-related emissions
minus annual displaced emissions. (See Appendix C for the detailed results.)
Scenario Testing Data Quality and Limitations
The following section outlines the assumptions and methods used to generate
GHG emissions estimates for transit projects sample:
• Amortized construction emissions: The Matrix’s construction GHG
emissions emission factors represent the total amount of emissions per
unit to complete construction. The project team amortized construction
emissions over a 50-year period, which corresponds to the minimum useful
lifespan of facilities.28 Using a truncated amortization period for transit
scenarios or example projects would increase the total annual GHG
emissions reported for the project.
• Track and catenary construction emissions: The project team used
mileage figures for rail transit projects as presented in the CIG templates.
The project team then relied on information in projects’ environmental
documents to determine whether catenary overhead systems would be
used to supply the electricity to power the respective transit vehicles. All
sample streetcar and light rail projects were found to use a catenary system.
The project team assumed the catenary systems would be overhead for the
project’s entire length.
• BRT construction: The Matrix includes emissions associated with
constructing a new BRT lane and right-of-way and for converting or
upgrading a lane. All BRT projects analyzed were assumed to be new fixed-
guideway BRT lanes and thus involve pavement construction.
• Annual VMT forecasts: Using travel forecasts and transit operating plans,
project sponsors provide FTA with estimated annual transit and automobile
VMT for no-build29 and build30 scenarios for the current year and a horizon
27
The short-term construction emissions are divided over the life of a project to develop annual
construction-related emissions estimates.
28
FTA Circular 5010.1D Chapter IV. 3.f.(2)(e).
29
The no-build scenario for the current year is the existing transportation system excluding the
proposed transit project. The horizon year no-build is the existing transportation system plus
transportation investments committed in the Transportation Improvement Plan (TIP) or the
metropolitan planning organizations’ (MPO’s) fiscally-constrained long range transportation
plan excluding the proposed transit project.
30
The current year build scenario reflects the transit project’s opening year service plan. The
future build scenario is the existing transportation system plus transportation investments
committed in the TIP or the MPO’s fiscally constrained long-range transportation plan plus the
proposed transit project.
FEDERAL TRANSIT ADMINISTRATION 19You can also read