GREENHOUSE GAS INVENTORY FY2021
←
→
Page content transcription
If your browser does not render page correctly, please read the page content below
1

                                                  GREENHOUSE
                                                      GAS
                                                   INVENTORY

                     FY2021

                                                TFG FY2021
                          SUMMARY CARBON FOOTPRINT REPORT
                                               30 July 2021

                                                                       Final Version

    E-mail: info@carboncalculated.co.za | www.carboncalculated.co.za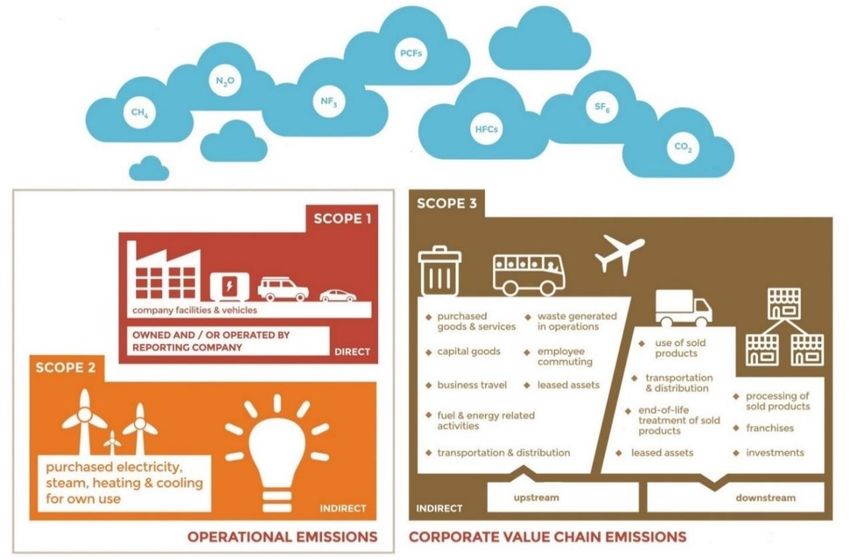
2                                                                              2

TABLE OF CONTENTS

1.   REPORT OVERVIEW – EXECUTIVE SUMMARY                                  3
2.   INTRODUCTION                                                         6
3.   REQUIRED INFORMATION                                                 11
4.   METHODOLOGY, EXCLUSIONS AND ASSUMPTIONS                              11
5.   INFORMATION ON TFG’S EMISSIONS                                       14
6.   ADDITIONAL INFORMATION UNDER THE GHG PROTOCOL                        16
7.   ILLUSTRATED SUMMARY                                                  20
8.   COMPARISON OF EMISSIONS AND INTENSITY                                23
CONTACT INFORMATION                                                       25

TFG FY2021 Summary Carbon Footprint Report | 30 July 2021 | Version 1.0

3                                                                                                                               3

    SECTION A

1. REPORT OVERVIEW – EXECUTIVE SUMMARY
Figure 1 is a summary of the emissions and company metrics reported by TFG in FY2021.

                                                       SCOPE 1       SCOPE 3

                                                    Fugitive         Purchased Goods        T&D Losses          Upstream
      Stationary Fuels
                                                   Emissions
                                                                        & Services         Fuel & Energy       Distribution

            69   tCO2e                               1 696   tCO2e
                                                                       9 806   tCO2e      17 676 tCO2e         24 871 tCO2e

                                                                         Waste                                Other Business
       Mobile Fuels                             On-site Renewable                           Air Travel
                                                                                                                  Travel
                                                      Energy
                                                                         771   tCO2e          401 tCO2e           395   tCO2e
          1 985    tCO2e                                 0   tCO2e

          Total Scope 1             3 750 tCO2e
                                                       SCOPE 2

                                                                        Employee            Upstream           Downstream
                                  Purchased                            Commuting          Leased Assets        Leased assets
                                  Electricity
                                                                       6 797     tCO2e        481   tCO2e          18   tCO2e

                           Total Scope 2           175 863   tCO2e           Total Scope 3                    61 216 tCO2e

          Total Scope         179 613                                                                          1 362 tCO2e
                                           tCO2e                               Outside of Scopes
             1&2

    FTE 9.601                     Revenue 5.047                         FTE 18 708                          Revenue 35 586

                  EBITDA 27.570                                                          EBITDA 6 515

Figure 1: Summary of TFG’s FY2021 emissions and company metrics

TFG FY2021 Summary Carbon Footprint Report | 30 July 2021 | Version 1.0
4                                                                                                                 4

REPORT OVERVIEW – EXECUTIVE SUMMARY CONTINUED

                                                                FY2019    FY2020       FY2021       % Change

                                          Scope 1 Total           4 672     5 215           3 750       -28%

                                          Scope 2 Total         153 096   166 655     175 863           6%

                                          Scope 1 & 2 Total     157 768   171 870    179 613            5%

    Metrics                     FY2019    FY2020      FY2021 % Change

    Full-time employees (FTE)   16 555    17 433      18 708     7%

    Total employees             29 121    29 776      34 891     17%

    Group EBITDA (Rm)           8 531.8   8 513.3     6 514.8   -23%

    Group Revenue (Rm)          37 128    38 477      35 586     -8%

                                          Intensity                              FY2019       FY2020     FY2021

                                          Scope 1&2 tCO2e/FTE                       9.530       9.859     9.601

                                          Scope 1&2 tCO2e/Total employees           5.418       5.772     5.148

                                          Scope 1&2 tCO2e/EBITDA (Rm)            30.505       20.188     27.570

                                          Scope 1&2 tCO2e/Retail turnover (Rm)      4.249       4.467     5.047

TFG FY2021 Summary Carbon Footprint Report | 30 July 2021 | Version 1.0
5                                                                                                                                5

Table 1: COMPARATIVE EMISSIONS BETWEEN YEARS INCLUDING PERCENTAGE CHANGE FOR
TFG AFRICA, TFG LONDON AND TFG AUSTRALIA

                                                              Metric tonnes of CO2e                            % Change
TFG
                                                      FY2019          FY2020        FY2021                   FY20 vs. FY21
Total Scope 1                                             4 672           5 215        3 750                         -28%
Total Scope 2 – purchased electricity                   153 097              166 655            175 8631                  6%
Total Scope 1 & 2                                       157 768              171 870            179 613                   5%
Total Scope 3                                             66 650               75 193             61 216               -19%
Outside of Scopes                                          2 542                2 743               1 362              -50%
TFG Africa
Total Scope 1                                              4 484                5 016               3 664              -27%
Total Scope 2 – purchased electricity                   150 959              164 816            166 663                   1%
Total Scope 1 & 2                                       155 443              169 832            170 327
6 6 2. INTRODUCTION TFG is a diverse group with a portfolio of 29 fashion retail brands. As at the end of the 2021 financial year, the Group was trading in 4 284 outlets across 26 countries on five continents and reported a Group turnover of R35 586 million (FY2020: R38 477 million). The company was established in 1924 and was listed on the Johannesburg Stock Exchange (JSE) in 1941. The retail brands offer clothing, jewellery, cellphones, accessories, cosmetics, sporting apparel and equipment, and homeware and furniture from value to upper market segments. The Group’s retail brands, as at March 2021, are shown in Figure 2 below. Figure 2: TFG retail brands for FY2021 TFG’s three business segments each have their own local management teams, which report into the Group’s head office in Cape Town. Retail brands within these business segments are supported by centralised support services structures. The percentage contribution to turnover was: TFG Africa 67%, TFG London 5%, TFG Australia 16%, and TFG e-commerce 12%. The reporting period of this CFR is TFG’S 2021 financial year (01 April 2020 – 31 March 2021). TFG FY2021 Summary Carbon Footprint Report | 30 July 2021 | Version 1.0
7 7
TFG Africa operations that are included in the reporting boundary totalled 2 929 stores. The majority of
those stores were in South Africa (2 710), with the remaining 219 stores in: Botswana (44), Lesotho (20),
Namibia (106), Eswatini (18) and Zambia (31), all of which reported electricity consumption. The TFG
London operations totalled 801 outlets (210 stores and 591 concessions) of which 567 outlets were
included in the boundary, and TFG Australia operations totalled 554 outlets (521 stores and 33
concessions) of which 518 outlets were included in the boundary.
This FY2021 CFR constitutes the fourteenth carbon footprint report commissioned by TFG and should be
compared against previous carbon footprint calculations in order to review changes in annual
consumption, boundaries and areas of improvement. All reports have been prepared using the GHG
Protocol Corporate Accounting and Reporting Standard methodology.
Within the GHG Protocol, accounting and reporting are guided by five principles – relevance,
completeness, consistency, transparency and accuracy – to ensure that reported information represents
a true and fair account of emissions. These principles are intended to underpin all aspects of GHG
accounting and reporting according to the GHG Protocol, and to which Carbon Calculated subscribes in
the delivery of all its reports.
In accordance with the GHG Protocol, clear organisational and operational boundaries have been
defined and agreed to by TFG, and the relevant activity data has been supplied. This CFR covers
emissions from the business activities of TFG Africa, TFG London and, for the first time, TFG Australia.
It is important to highlight that under the GHG Protocol, the reporting of both Scope 1 direct emissions and
Scope 2 indirect emissions is compulsory. All Scope 3 emissions, (i.e., those from supply chain activities),
are reported at the discretion of the reporting company.
As a result, the GHG-emitting activities covered by the CFR include:
Direct emissions (referred to as Scope 1), resulting from fuel used by TFG-owned or TFG-controlled
equipment (stationary fuels); fleet vehicles (mobile fuels); air-conditioning, refrigeration, and fire-
suppressing gas refills (fugitive emissions) and onsite renewable energy. Although renewable energy
generated onsite produces few to no emissions, consumption is reported within Scope 1 so that the
total kilowatt hours consumed by a company is measured year-on-year.
TFG FY2021 Summary Carbon Footprint Report | 30 July 2021 | Version 1.08 8
Indirect emissions from purchased electricity (referred to as Scope 2).
Selected indirect emissions in the supply chain (referred to as Scope 3), resulting from TFG’s business
travel activities; its employee commuting; upstream distribution by courier and freight; the
consumption of paper products, marketing materials, and packaging; transmission and distribution
(T&D) losses from purchased electricity; upstream and downstream leased assets and waste disposal.
Figure 3 below shows the detailed breakdown of Scopes and emission categories.
Figure 3: Illustration of Scopes and emission categories
The CFR covers 18 708 FTEs, 1 563 860 square metres (m2) of floor area, R6 515m EBITDA and R35 586m
Group revenue.
Carbon Calculated has gone to all reasonable lengths to ensure that the primary information provided
by TFG is correct. Carbon Calculated is not liable for any inaccuracies that this information might
contain. This CFR, in its entirety, is both material and complete and is intended for TFG internal use only.
Information may, however, be extracted for reporting purposes, such as for submission into
international and national GHG registries and for purposes of sustainability reporting. It may also be
presented for third-party verification purposes.
TFG FY2021 Summary Carbon Footprint Report | 30 July 2021 | Version 1.09 9
Table 2: OVERVIEW OF TFG’S FY2021 GHG EMISSIONS
REPORTING PERIOD: TFG’s financial year (01 April 2020 – 31 March 2021)
CARBON FOOTPRINT CALCULATION CONDUCTED ON: TFG Africa, TFG London and TFG Australia
METHODOLOGY: GHG Protocol – Corporate Accounting and Reporting Standard
GHG CONSOLIDATION APPROACH: Operational Control
Company Metrics
Total TFG employees 34 891
Total full-time TFG employees (FTE) covered by CFR 18 708
Total square metreage of space reported (including stores) 1 563 8602
Total square metreage of space reported (excluding stores) 247 8143
TFG Group Retail Revenue (ZARm) 35 586
TFG Group EBITDA (ZARm) 6 514.80
Scope 1 Direct Emissions Metric tonnes of CO2e
Stationary fuel emissions 69.28
Fugitive emissions 1 695.90
Mobile fuel emissions 1 984.93
On-site renewable energy emissions 0.00
TOTAL SCOPE 1 EMISSIONS 3 750.11
Scope 2 Indirect Emissions Market-based Location-based
Purchased electricity 175 862.924 175 862.92
TOTAL SCOPE 2 EMISSIONS 175 862.925
TOTAL SCOPE 1 & 2 EMISSIONS 179 613.03
Intensity Metrics
Scope 1 & 2 emissions per total employee (tCO2e/employee) 5.148
Scope 1 & 2 emissions per full-time employee (tCO2e/FTE) 9.601
Scope 1 & 2 emissions per square metre of building incl. stores (tCO2e/m2) 0.115
Scope 1 & 2 emissions per Group Revenue (tCO2e/ZARm) 5.047
Scope 1 & 2 emissions per ZARm Group EBITDA (tCO2e/ZARm) 27.570
2 Area for TFG London only includes stores and Hobbs HO (proxy) – area data for remaining facilities was not available.
3 Area for TFG London only includes Hobbs HO (proxy) – area data for remaining facilities was not available.
4 TFG’s market-based electricity is identical to location-based electricity because no supplier-provided contractual instruments
were reported in FY2021.
5 In dual reporting (market-based and location-based methodologies), the Scope 2 total is for each respective methodology and
not the combined totals of both methodologies.
TFG FY2021 Summary Carbon Footprint Report | 30 July 2021 | Version 1.010 10
Table 3: OVERVIEW OF TFG’S FY2021 GHG EMISSIONS – CORPORATE VALUE CHAIN
Metric tonnes of CO2e
TOTAL SCOPE 1 EMISSIONS: Direct emissions from owned/controlled operations 3 750.11
TOTAL SCOPE 2 EMISSIONS: Indirect emissions from the use of purchased electricity 175 862.92
TOTAL SCOPE 1 & 2 EMISSIONS 179 613.03
Scope 3 Indirect Emissions
1. Purchased goods and services Paper – products 855.23
Paper – marketing 1 846.29
Packaging 7 104.52
9 806.04
2. Capital goods Not evaluated
3. Fuel- and energy-related activities Electricity T&D losses 17 675.64
4. Upstream transportation and distribution SA distribution 21 151.94
SA freight 3 718.97
24 870.91
5. Waste generated in operations Waste to landfill 746.01
Recycling and compost 24.82
770.83
6. Business travel Car hire 14.69
Air travel 401.34
Accommodation 77.73
Travel claims 302.71
796.47
7. Employee commuting 6 797.23
8. Upstream leased assets Purchased electricity 457.34
Gas – LPG 23.61
480.94
9. Downstream transportation and distribution Not reported
10. Processing of sold products Not applicable
11. Use of sold products Not reported
12. End-of-life treatment of sold products Not reported
13. Downstream leased assets Tenant electricity 17.64
14. Franchises Not reported
15. Investments Not reported
TOTAL SCOPE 3 EMISSIONS 61 215.71
Outside of Scopes:
Non-Kyoto Protocol GHG emissions 1 362.42
TFG FY2021 Summary Carbon Footprint Report | 30 July 2021 | Version 1.011 11 SECTION B 3. REQUIRED INFORMATION 3.1. BASE YEAR TFG Africa has set 2008 as the base year for carbon footprint calculations because this was the year that best represented the reporting boundaries with reliable and transparent data. There has been a significant change to the organisation’s boundary during the reporting period with the acquisition of Jet Stores, however it is difficult to assess the true impact this has had on materiality based on comparative emissions since these have been dramatically affected by the COVID-19 pandemic. A more detailed assessment of the relevance of the current base year may be required going forward. Emissions for TFG in tCO2e in 2008 were as follows: Scope 1: 3 620, Scope 2: 88 774, Scope 1 and 2: 92 394, Scope 3: 36 136 and Outside of Scopes: 1 047. For a historical record of TFG emissions from FY2019, see Table 13. A base year for TFG, including TFG London and TFG Australia, has not been set. Once accurate and reliable data becomes available, consideration should be given to setting a baseline for the Group. 4. METHODOLOGY, EXCLUSIONS AND ASSUMPTIONS This CFR has been completed using the GHG Protocol. The following exclusions and/or assumptions are noted in relation to the reporting boundary as well as the Scope 1, Scope 2 and Scope 3 emissions covered by the CFR: 4.1. ORGANISATIONAL BOUNDARY EXCLUSIONS Emissions generated by the following facilities and/or entities are excluded from the reporting boundary: TFG London excluded 234 of its 801 outlets (stores and concessions) as data was not available. TFG Australia excluded 36 of its 554 outlets (stores and concessions) as data was not available. TFG FY2021 Summary Carbon Footprint Report | 30 July 2021 | Version 1.0
12 12
4.2. OPERATIONAL BOUNDARY EXCLUSIONS AND ASSUMPTIONS
Scope 1 – Direct Emissions
TFG London’s Whistles Head Office, the DCs for Phase Eight and Whistles, and the Hobbs Shoe
Factory – excluded due to data unavailable.
TFG Africa’s new Jet DC – fugitive gas consumption data was not available.
Diesel in bowsers for TFG Africa is excluded as this is stored fuel and not combusted.
Scope 2 – Indirect Emissions
TFG London’s Whistles Head Office, the DCs for Phase Eight and Whistles, and the Hobbs Shoe
Factory – excluded due to data unavailable.
It was assumed that all TFG London electricity was from the UK.
Electricity consumption for TFG Australia stores was estimated based on the kWh per square metre
of actual consumption of a select few stores, which was then applied to all stores and emissions
calculated based on each store’s territory or region.
Scope 3 – Indirect Emissions
Refer to Table 4 for any category or activity exclusions within the reporting year.
TFG FY2021 Summary Carbon Footprint Report | 30 July 2021 | Version 1.013 13
Table 4: SPECIFIC SCOPE 3 EMISSION CATEGORIES AND EXCLUSIONS ACCORDING TO THE CORPORATE
VALUE CHAIN FOR TFG IN FY2021
Category Scope 3 category Evaluation status Reason for exclusions
Relevant, partially reported:
TFG purchases a wide variety of consumables
Paper products
from various sources, for which much of the
1 Purchased goods and services Marketing material – paper
data is currently unavailable or has not been
Packaging – various
evaluated.
Water (consumption only)
2 Capital goods Relevant, not reported Information not evaluated
Fuel- and energy-related Relevant, reported: Excludes homeworker emissions as data was
3
activities (not in Scopes 1 or 2) Electricity T&D losses not available
Relevant, reported distributors (TFG TFG distributes a wide variety of products
Africa only): from various sources. Currently, not all
Upstream transportation and
4 Third party logistics relevant information is available or has been
distribution
Courier services evaluated. TFG London and Australia did not
Freight – sea & air report on transport and distribution.
TFG London – Hobbs HO, Whistles HO and
Phase Eight MIQ Logistics did not report
Relevant, reported: waste. Proxy used for Courier London waste.
Waste generated in
5 Landfill waste No waste data for stores reported by TFG
operations
Recycling and compost Australia and Africa as they are usually within
malls where waste is difficult to separate and
measure.
Relevant, reported:
Car hire
Travel reported by TFG Africa only includes
6 Business travel Air travel
travel for South African operations.
Accommodation
Travel claims
Commuting was only calculated for
permanent full-time employees. Occupancy
7 Employee commuting Relevant, calculated
was estimated to account for reduced travel
due to COVID-19.
Relevant, reported (TFG Australia only):
Upstream leased assets (not
8 Purchased electricity Not applicable
in Scopes 1 or 2)
Purchased gas
Downstream transportation
9 Relevant, not reported Information not evaluated
And distribution
TFG sells products that do not require further
10 Processing of sold products Not relevant, explanation provided
processing.
TFG retail brands offer a variety of lifestyle
products and the company has no control
11 Use of sold products Relevant, not yet calculated over consumer use, hence this has been
excluded. The majority of TFG merchandise
does not produce emissions during usage.
TFG has no control over the disposal of
End-of-life treatment of sold
12 Relevant, not yet calculated products by consumers, hence this has been
products
excluded.
Relevant, reported:
13 Downstream leased assets Not applicable
Tenant electricity
14 Franchises Not relevant, explanation provided TFG does not operate any franchises.
15 Investments Not relevant, explanation provided Information not evaluated
TFG FY2021 Summary Carbon Footprint Report | 30 July 2021 | Version 1.014 14
SECTION C
5. INFORMATION ON TFG’S EMISSIONS
5.1. TOTAL SCOPE 1 & 2 EMISSIONS
The GHG Protocol requires carbon footprint calculations to include, as compulsory reporting, all direct
emissions under Scope 1 and indirect emissions under Scope 2.
All emissions are calculated using emission factors and reported as carbon dioxide equivalent (CO2e)
gases as required by the GHG Protocol. Unless otherwise stated, emission factors are sourced from
Defra6.
5.2. COMPANY INTENSITY METRICS
Intensity metrics are indicators that provide a comparison of the amount of CO2e relevant to an
operational indicator. TFG utilises the following metrics: FTEs, floor area in square metres, EBITDA, and
Group revenue. In 2020, the accounting policy for EBITDA changed to after IFRS 16 EBITDA. Thus,
EBITDA for FY2018 and FY2019 was restated.
5.3. SCOPE 1 EMISSIONS
Scope 1 emissions are from sources owned or controlled by the reporting company, e.g., generators,
refrigeration, air-conditioning units.
Table 5 provides a breakdown of TFG’s direct Scope 1 consumption and carbon emissions for FY2021.
Please note that throughout the CFR, all consumption, and emissions in tonnes of CO2e are rounded to
two decimal places7 and intensity metrics are rounded to three decimal places.
6 Defra, Guideline to Defra’s GHG Conversion Factors for Company Reporting; Annexes Updated in August 2020.
7 Should the figures in the breakdown tables of this CFR be summed manually, there may be variances of 0.01 (up or down)
from the totals stated herein due to rounding of data to two decimal places.
TFG FY2021 Summary Carbon Footprint Report | 30 July 2021 | Version 1.015 15
Table 5: TFG’S DIRECT SCOPE 1 EMISSIONS IN FY2021
Metric tonnes of
Description Units Total consumption
CO2e8
Stationary fuel Litres – diesel in equipment 25 775.009 69.28
Kilograms – R407a 164.40 346.39
Kilograms – R410a 615.98 1 286.17
Kilograms – R417 11.00 25.81
Fugitive gas10
Kilograms – R407c 20.00 35.48
Kilograms – R32 3.05 2.06
Total 814.4311 1 695.90
Litres – diesel 544 337.36 1 259.96
Mobile fuel – on-road Litres – petrol 269 719.63 724.97
Total 814 056.9812 1 984.93
Renewable energy
kWh – solar renewable energy13 112 086.00 0.00
generated on-site
5.4. SCOPE 2 EMISSIONS – MARKET-BASED AND LOCATION-BASED EMISSIONS
Scope 2 emissions are associated with the consumption of purchased electricity, heat or steam from a
source that is not owned or controlled by the reporting company, e.g., an electricity utility such as Eskom.
Scope 2 emissions are reported according to either the location-based or market-based approach.
Table 6 provides a breakdown of TFG’s indirect Scope 2 consumption and carbon emissions for FY2021.
8 Unless otherwise stated, all emission factors are provided by Defra, Guideline to Defra’s GHG Conversion Factors for Company
Reporting; Annexes. Updated in August 2020.
9 Excludes 7 000 litres stored in bowsers, as this fuel was not combusted during the reporting year. TFG Australia reported zero
consumption of diesel in generators and TFG London reported only 200 litres due to the extensive COVID-19 lockdown in the UK.
10 The GWP for air-conditioning, fire suppressant and refrigeration gas refills are sourced from the IPCC fourth assessment report.
11 Fugitive excludes the new Jet DC as data was not provided. TFG Australia reported zero consumption of fugitive gas in FY2021.
12 Mobile fleet fuel was from TFG Africa (269 720 litres petrol and 265 141 litres diesel) and TFG London (4 579 litres diesel) for
delivery vehicles. TFG London reported zero consumption by company fleet vehicles due to COVID-19 and TFG Australia do not
own or have operational control over any fuel-combustion vehicles.
13 On-site renewable solar energy is produced at the Prestige Manufacturing Caledon facility and has been since 2016.
TFG FY2021 Summary Carbon Footprint Report | 30 July 2021 | Version 1.016 16
Table 6: TFG’S INDIRECT SCOPE 2 EMISSIONS FROM PURCHASED ELECTRICITY IN FY2021
Total Metric tonnes of
Description Units
consumption CO2e
Purchased electricity – South Africa kWh location-based 160 510 789.8414 163 721.0115
Purchased electricity – rest of Africa kWh location-based 8 406 927.63 2 941.6016
Purchased electricity – United Kingdom kWh location-based 2 292 380.2117 534.45
Purchased electricity – Australia kWh location-based 10 730 092.3918 8 585.2419
Purchased electricity – New Zealand kWh location-based 732 988.04 80.6320
Total purchased electricity – location-based 182 673 178.11 175 862.92
Total purchased electricity – market-based 182 673 178.11 175 862.9221
SECTION D
6. ADDITIONAL INFORMATION UNDER THE GHG PROTOCOL
6.1. SCOPE 3 EMISSION CATEGORIES
It is widely accepted that reporting on a variety of Scope 3 categories (refer to Appendix A) allows
companies to gain more meaningful and comprehensive information that provides input into their wider
business strategy. Furthermore, reporting of Scope 3 categories is increasingly becoming a focus in
management of corporate carbon emissions. Certain reporting platforms, such as CDP and the SBT
Initiative (SBTi), are steadily requiring greater and more detailed understanding of the entire supply
chain of an organisation, making Scope 3 reporting increasingly important for companies.
14 TFG South Africa electricity is split as follows: stores 144 179 903 kWh (147 064 tCO2e), DCs 2 987 666 kWh (3 047 tCO2e), HO
11 390 287 kWh (11 618 tCO2e), Regional offices 383 516 kWh (391 tCO2e) and Manufacturing 1 569 418 kWh (1 601 tCO2e).
15 South African emission factor for purchased electricity sourced from Eskom’s 2020 Integrated Annual Report.
16 Electricity emission factors sourced from IEA 2019 report for the year 2017. These are accessed through a purchased licence and
cannot be disclosed.
17 TFG London electricity was reported as: Hobbs 641 463 kWh (150 tCO e), Phase Eight 1 542 553 kWh (360 tCO e) and Whistles
2 2
108 365 kWh (25 tCO2e). A FY2020 proxy was required for Hobbs HO (reduced by 50% due to COVID-19 lockdown) as data was not
available. Phase Eight excludes Logistics, and Whistles excludes Logistics and HO due to electricity being included in lease
agreements.
18 TFG Australia reported electricity for the first time in FY2021. Facilities: Rockwear warehouse 35 408 kWh (29 tCO e), HO 234
2
824 kWh (190 tCO2e) and stores (Australia only) 10 459 861 kWh (8 366 tCO2e). Stores were calculated as using kWh per sqm
estimations based on sample store data, as obtaining this data for all stores is not feasible in the short-term.
19 Australian emission factors for purchased electricity were sourced from National Greenhouse and Energy Reporting
(Measurement) Determination 2008 (schedule 1) and Department of Industry, Science, Energy and Resources.
20 Electricity is for retail stores in New Zealand - emission factor sourced from https://www.mbie.govt.nz/building-and-
energy/energy-and-natural-resources/energy-statistics-and-modelling/energy-statistics/new-zealand-energy-sector-
greenhouse-gas-emissions/.
21 In dual reporting (market-based and location-based methodologies), the Scope 2 total is for each respective methodology and
not the combined totals of both methodologies.
TFG FY2021 Summary Carbon Footprint Report | 30 July 2021 | Version 1.017 17
6.2. RELEVANT SCOPE 3 EMISSIONS
Table 7 outlines Scope 3 emissions generated during TFG’s reporting year from data that was available
and deemed accurate. Please refer to relevant footnotes for further details.
Table 7: TFG’S INDIRECT SCOPE 3 EMISSIONS FROM FY2021
Metric tonnes
Description Units Total consumption
of CO2e22
Tonnes – reams Mondi Rotatrim23 136.53 275.90
Tonnes – reams Sappi Typek24 150.36 364.18
Tonnes – reams other 10.35 9.52
Purchased goods & services –
Tonnes – envelopes 18.83 17.31
paper products
Tonnes – labels 0.55 0.50
Tonnes – till rolls 204.28 187.82
Total 520.90 855.23
Tonnes – magazine paper 1 781.8625 1 638.24
Purchased goods & services –
Tonnes – mailers and flyers 226.2926 208.05
marketing
Total 2 008.15 1 846.29
Tonnes – supplier cartons 3 014.7227 2 261.84
Tonnes – paper packaging 526.57 484.13
Tonnes – plastic packaging 1 319.17 3 430.69
Purchased goods & services – Tonnes – recycled PET bags 1.33 0.80
packaging Tonnes – other plastic 242.12 914.73
Tonnes – metal 2.49 9.70
Tonnes – wood 8.45 2.64
Total 5 114.8628 7 104.52
Kilowatt hours – South Africa 160 510 789.84 16 208.38
Fuel- & energy-related Kilowatt hours – rest of Africa 8 406 927.63 410.02
activities – T&D losses from Kilowatt hours – UK 2 292 380.21 45.96
purchased electricity Kilowatt hours – Australia and NZ 11 463 080.43 1 011.28
Total 182 673 178.11 17 675.64
22 Unless otherwise stated, all emission factors are provided by Defra, Guideline to Defra’s GHG Conversion Factors for Company
Reporting; Annexes. Updated in August 2020.
23 Emission factor for Mondi Rotatrim paper, released October 2020 via private communication.
24 Emission factor for Sappi Typek paper, released June 2020 via private communication.
25 Units of magazine paper were reported by TFG Africa based on a conversion from Rands to number of pages.
26 Excludes mailer and flyers for TFG Australia as consumption was minimal to zero and deemed immaterial. Data was not available
for @Home mailers and flyers so a proxy from FY2020 (assuming 50% reduction) was used.
27 Excludes 282.58t of second-hand cartons in FY2021 as these are deemed to be re-used rather than recycled as in previous years.
28 Packaging for TFG London contained many data irregularities so a proxy from FY2020 was used instead.
TFG FY2021 Summary Carbon Footprint Report | 30 July 2021 | Version 1.018 18
Table 7 continued: TFG’S INDIRECT SCOPE 3 EMISSIONS FROM FY2021
Total Metric tonnes
Description Units
consumption of CO2e
Litres – diesel 7 598 660.71 20 424.21
Upstream transportation &
Litres – petrol 314 400.00 727.73
distribution – SA logistics
Total 7 913 060.71 21 151.94
Tonne.km – sea freight 239 030 454.34 3 162.85
Upstream distribution &
Tonne.km – air freight 490 478.54 556.11
distribution – SA freight
Total 239 520 932.8829 3 718.97
Tonnes – landfill30 761.69 746.01
Tonnes – recycling 1 162.03 24.77
Waste
Tonnes – compost 4.62 0.05
Total 1 928.3431 770.83
Km – petrol 2L 617.00 0.17
Km – diesel 2.0L 2 035.00 0.34
Km – petrol > 2.0 litre 487.00 0.10
Km – avg. vehicle; unknown fuel 973.00 0.17
Total 81 065.0032 14.69
Km – domestic 25 326.35 6.19
Km – short-haul economy class 2 008 792.78 307.31
Km – short-haul business class 38 382.48 8.81
Business travel – air travel33
Km – long-haul economy class 292 341.86 42.73
Km – long-haul business class 85 666.77 36.31
Total 2 450 510.2434 401.34
Bed nights – South Africa 676.00 43.60
Bed nights – rest of Africa 10.00 0.65
Business travel –
Bed nights – Australia 773.00 33.24
accommodation35
Bed nights – New Zealand 19.00 0.24
Total 1 478.00 77.73
29 Freight tonne.km by sea and air has been included by TFG Africa for the first time in FY2021.
30 Emission factor for South Africa waste to landfill was sourced from Friedrich 2013.
31 Data for waste from Courier London (TFG London) was not available; thus a proxy from FY2019 (reduced by 50%) was used.
TFG London waste excludes Hobbs & Whistles HOs and Damsel in a Dress DC. TFG Australia waste was calculated based on
number of collections with average skip weights.
32 Car hire is for travel in South Africa by TFG Africa employees only. No data was available for TFG Australia and TFG London did
not travel at all in FY2021 due to COVID-19.
33 An 8% uplift factor is included to consider non-direct routes and delays/circling. The impact of radiative forcing is also included.
34 TFG Africa reported 2 221 742 km (365 tCO e) but excludes flights for Rest of Africa. TFG Australia reported 228 768 km (36
2
tCO2e) and TFG London did not travel at all in FY2021 due to COVID-19.
35 A country-specific emission factor is used, which has seen significant variances year-on-year since its introduction.
TFG FY2021 Summary Carbon Footprint Report | 30 July 2021 | Version 1.019 19
Table 7 continued: TFG’S INDIRECT SCOPE 3 EMISSIONS FROM FY2021
Total Metric tonnes
Description Units
consumption of CO2e
Km – avg. vehicle (TFG Africa) 59 802.33 10.25
Business travel – travel
Km – avg. vehicle (TFG Australia) 1 706 300.86 292.46
claims
Total 1 766 103.19 302.71
Permanent FTE – TFG Africa 16 973.00 5 805.49
Permanent FTE – TFG London 722.00 112.48
Employee commuting
Permanent FTE – TFG Australia 1 013.00 879.26
Total 18 708.00 6 797.2336
kWh – purchased electricity (TFG
557 730.80 457.34
Australia)
Upstream leased assets
kWh – purchased LPG (TFG Australia) 110 059.72 23.61
Total 667 790.5237 480.94
Downstream leased assets kWh – tenant electricity (TFG Africa) 17 297.00 17.6438
6.3. OUTSIDE OF SCOPES: EMISSIONS FROM GHG EMISSIONS NOT COVERED BY THE KYOTO PROTOCOL
TFG recorded usage of 753 kg (totalling 1 362 tCO2e) of R22 Freon gas refills during the reporting year as
indicated in Table 8.
Table 8: TFG’S DIRECT EMISSIONS FROM OUTSIDE OF SCOPE GHGS IN FY2021
Metric tonnes
Description Units Total consumption
of CO2e
Kgs – HCFC22 (Freon) – South Africa 749.72 1 356.99
39
Fugitive gas (non-Kyoto) Kgs – HCFC22 (Freon) – rest of Africa 3.00 5.43
Total 752.72 1 362.42
36 Employee commuting was calculated using surveys combined with assumptions based on occupancy levels during lockdown.
37 Purchased electricity and LPG is for leased warehouse facilities where TFG Australia have no operational control. Electricity is
for Johnny Bigg at 84 864 kWh (69.59 tCO2e); Connor 1 at 287 723 kWh (236 tCO2e); Connor 2 & 3 estimated at 20 000 kWh
each (32.80 tCO2e); YD at 68 703 kWh (56.34 tCO2e) and Tarocash at 76 440 kWh (62.68 tCO2e). LPG kWh is for Tarocash
warehouse.
38 Tenant electricity from the TFG-owned but not occupied building at 350 Voortrekker Road. TFG do not have operational
control over this facility, thus it is Scope 3.
39 The GWP for air-conditioning, fire suppressant and refrigeration gas refills are sourced from the IPCC fourth assessment
report.
TFG FY2021 Summary Carbon Footprint Report | 30 July 2021 | Version 1.020 20
6.4. WATER CONSUMPTION
The incorporation of water consumption is recommended as an awareness-raising tool. Total water
consumed by TFG in FY2021 was 64 190 kilolitres. Table 9 provides a breakdown of water consumption
per division over 3 years (FY2019–FY2021).
Table 9: TFG’S WATER CONSUMPTION IN KILOLITRES OVER 3 YEARS (FY2018–FY2021)
Description Division FY2019 FY2020 FY2021 % Change
South Africa DCs 4 835.72 6 395.48 9 868.21 54%
Head offices 35 308.25 19 403.47 16 389.51 -16%
TFG Africa – municipal Regional offices 1 544.00 1 168.98 1 285.36 10%
Manufacturing 12 684.71 17 048.93 12 518.59 -27%
Total 54 372.68 44 016.86 40 061.67 -9%
South Africa DCs N/A 4 576.00 4 167.85 -9%
TFG Africa – borehole Head offices N/A 15 341.00 6 849.43 -55%
Total N/A 19 917.00 11 017.28 -45%
Facilities 4 276.00 N/R 2 172.10 N/A
TFG London –
Stores N/R N/R 612.00 N/A
municipal
Total 4 276.00 N/R 2 784.10 N/A
Rockwear warehouse N/R N/R 8 349.24 N/A
TFG Australia –
Head offices N/R N/R 1 978.00 N/A
municipal
Total N/R N/R 10 327.24 N/A
GRAND TOTAL 58 648.68 63 933.86 64 190.2921 21
1% 1%
25%
Scope 1: 3 750
Scope 2: 175 863
Scope 3: 61 216
Outside of Scopes: 1 362
73%
Figure 4: TFG’s emissions in tonnes of CO2e by Scope in FY2021
2%
45% Stationary fuel: 69
Fugitive gas: 1 696
Mobile fuel: 1 985
Generation of electricity: 0
53%
Figure 5: TFG’s Scope 1 emissions in tonnes of CO2e in FY2021
TFG FY2021 Summary Carbon Footprint Report | 30 July 2021 | Version 1.022 22
1%
16%
Purchased goods: 9 806
1%
1% Electricity T&D losses: 17 676
11%
Upstream distribution: 24 871
Waste: 771
Car hire: 1523 23
8. COMPARISON OF EMISSIONS AND INTENSITY
Table 11 provides a comparison of TFG’s carbon footprint over the last three years of reporting
(FY2019–FY2021)40. As a result of the COVID-19 pandemic, it is expected that emissions would be
reduced in FY2020.
Table 11: COMPARISON OF TFG’S EMISSIONS OVER 3 YEARS (FY2019–FY2021)
Metric tonnes of CO2e % Change
Description
FY2019 FY2020 FY2021 FY20/FY21
41
Stationary fuel 136 256 69 -73%
Fugitive gas 1 415 2 123 1 696 -20%
Mobile fuel 3 049 2 836 1 985 -30%
On-site renewable 0 0 0 0%
Total Scope 1 4 599 5 215 3 750 -28%
Total Scope 2 – purchased electricity 153 096 166 655 175 863 6%
Total Scope 1 & 2 157 695 171 870 179 613 5%
Paper products 1 554 937 855 -9%
Marketing 6 695 3 437 1 846 -46%
Packaging 4 315 4 358 7 105 63%
Losses from T&D 13 963 16 260 17 676 9%
Upstream distribution 18 220 22 908 24 871 9%
Waste 757 758 771 2%
Business travel – rental cars 39 63 15 -76%
Business travel – flights 5 228 4 743 401 -92%
Business travel – accommodation 438 235 78 -67%
Travel claims 100 50 303 506%
Employee commuting 15 31842 21 422 6 797 -68%
Upstream leased assets N/R N/R 481 N/A
Downstream leased assets – tenant 14 24 18 -25%
Total Scope 3 66 643 75 193 61 216 -19%
Outside of Scopes 2 542 2 743 1 362 -50%
N/A= Not applicable N/R=Not reported
40 Carbon data for earlier years can be viewed in previous carbon footprint reports.
41 FY2019 stationary fuel was restated in FY2020, as the diesel stored in bowsers was included as generator fuel; however it was
only stored and not consumed. The emissions reduced from 208.09 to 135.76 tCO2e.
42 FTE numbers for FY2019 were restated in FY2020 resulting in a restatement of commuting emissions. Emissions changed
from 15 325 to 15 318 tCO2e.
TFG FY2021 Summary Carbon Footprint Report | 30 July 2021 | Version 1.024 24
8.1. EMISSIONS INTENSITY
Table 12 provides a year-on-year comparison of TFG’s company metrics over the last 3 years (FY2019–
FY2021) with employees having increased due to the inclusion of Jet stores and TFG Australia, and the
significant drop in EBITDA is a result of the COVID-19 pandemic.
Table 12: COMPARISON OF TFG’S METRICS AND INTENSITY OVER 3 YEARS (FY2019–FY2021)
Metric tonnes of CO2e % Change
Description
FY2019 FY2020 FY2021 FY20/FY2143
Total employees44 26 600 26 854 34 891 30%
45
FTEs 15 744 16 200 18 708 15%
46 47
Square meterage (including stores) 1 062 075 1 011 451 1 563 860 55%
48
Group EBITDA (R million) 8 532 8 513 6 515 -23%
49
Group revenue (R million) 37 128.20 38 477.50 35 585.80 -8%
Scope 1&2 tCO2e/Total employees 5.931 5.152 5.148 0%
Scope 1&2 tCO2e/FTE 10.021 10.609 9.601 -10%
2
Scope 1&2 tCO2e/m including stores 0.148 0.170 0.115 -32%
Scope 1&2 tCO2e/EBITDA (Rm) 18.483 20.188 27.570 37%
Scope 1&2 tCO2e/Group revenue (Rm) 4.249 4.467 5.047 13%
43 Increase in employees, FTEs and area is primarily due to the inclusion of TFG Australia in FY2021.
44 Total employees for FY2019 and FY2020 exclude Australia as it was outside the reporting boundary.
45 FTEs for FY2019 and FY2020 exclude Australia as it was outside the reporting boundary.
46 Area excludes all facilities within TFG London as data was not available for FY2020.
47 Area for TFG London only includes stores and Hobbs HO (proxy) – area data for remaining TFG London facilities was not
available. Increase in area primarily due to the inclusion of TFG Australia, TFG London stores and Jet stores for TFG Africa.
48 In 2020, the accounting policy for EBITDA changed from before to after IFRS 16 EBITDA. Group EBITDA for FY2019 was restated
from 5 171.9 to 8 531.8. This is for the Group – broader than the reporting boundary, which is only TFG Africa and TFG London.
49 Group revenue replaced retail turnover as a metric in FY2021.
TFG FY2021 Summary Carbon Footprint Report | 30 July 2021 | Version 1.025 25 CONTACT INFORMATION Robyn Ferrar Carbon Calculated, Carbon Footprint Analyst robyn@carboncalculated.co.za Telephone: 021 712 4390 Cell: 082 735 7796 Nici Palmer Carbon Calculated, Founding Member nici@carboncalculated.co.za Telephone: 021 712 4390 Cell: 082 549 7930 Nyarai Pfende Head of TFG Sustainability nyaraip@tfg.co.za Telephone: +27 021 937 5315 Cell: 083 381 4968 TFG FY2021 Summary Carbon Footprint Report | 30 July 2021 | Version 1.0
You can also read