Griffy Lake Nature Preserve Vegetation Monitoring Update - Summer 2017
←
→
Page content transcription
If your browser does not render page correctly, please read the page content below
Griffy Lake Nature Preserve
Vegetation Monitoring Update

         Summer 2017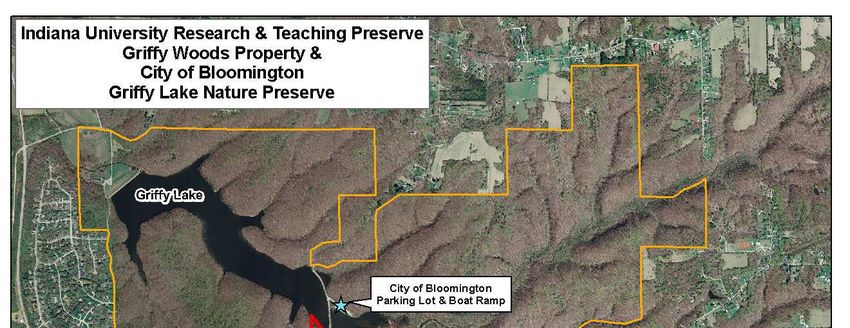
History of Deer Population in Indiana
• early 1900s: Essentially all deer in Indiana killed by
  hunting and habitat destruction
• 1930s: Deer reintroduced to state
• 1950s: Populations re-established and modern
  hunting programs begun
• 1990s - present: Historic high deer
   populations
• Forest vegetation in Bloomington area             more
  affected by deer than other                  nearby
  areas
Causes of High Deer Populations
Primary causes of deer increase
    – improved forage from agriculture & towns                                                   12
                                                                                                                                                                                               •
                                                                                                                                                                                                   •

    – elimination of natural predators                                                           10
                                                                                                                                                                   •
                                                                                                                                                                       ••
                                                                                                                                                                            •
                                                                                                                                                                                      ••
                                                                                                                                                                                           •
                                                                                                                                                                                                       •

                                                                            Deer per square km
                                                                                                                                                               •                • •

    – increase in edge habitat preferred by deer                                                  8
                                                                                                      ••• •
                                                                                                              •                              ••• •
                                                                                                                                                     • •
                                                                                                                                                           •

                                                                                                  6                                     ••
                                                                                                                  •                 •

    – supplemental feeding                                                                        4
                                                                                                                      ••
                                                                                                                         ••• ••
                                                                                                                                •

    – warmer winters                                                                              2

    – hunters (and regulations) often favor bucks                                                 0
                                                                                                  1960   1965          1970   1975           1980     1985              1990           1995                2000

    – Reduction in number of hunters                                                                          Deer populations in
                                                                                                              Wisconsin from 1960
                                                                                                              to 2000

 Images from Fairfield County, Conn. Deer Management Alliance. www.deeralliance.com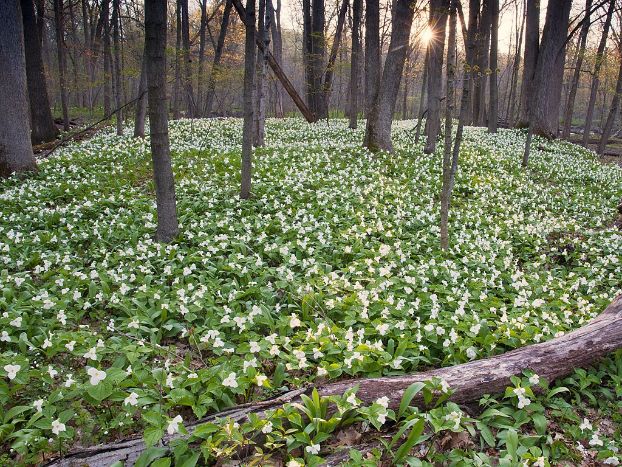
Effects of Deer on Ecological Communities
Study of Effects of Deer on Indiana State Parks by George
   Parker and Chris Webster in 1996
• Unhunted state parks had
   – fewer tree seedlings and shrubs

   – lower % cover of herbaceous species

   – higher cover of unpalatable species

• Since state park hunts began, there has been a dramatic
  increase in understory forest diversity and plant coverage

• In Wisconsin, several state parks without hunting lost over
  50% of plant species
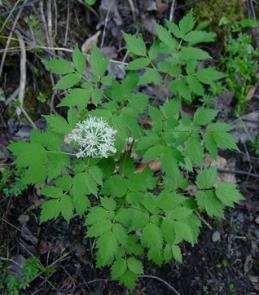
Effects of Deer Browsing on a Forest Herb
Large-flowered Trillium, Trillium grandiflorum
Fraction in Each Life Stage

                                                                               Population Growth Rate
                                                                                                                              increasing
                                                                                                                              population
Reproductive Value

                                                                                                                              declining
                                                                                                                              population

                                                                                                        Average % Herbivory
                                   % Herbivory
                                          Knight, Caswell, and Kalisz. 2009. Forest Ecology and Management 257: 1095.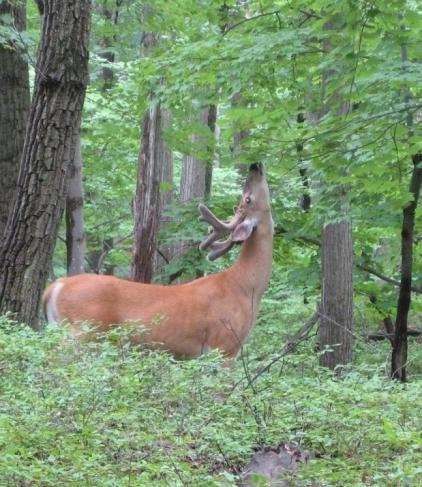
Griffy Lake Nature Preserve
Comparative Vegetation Data
             2017
 Data collected by Peter Slothower 28 April – 12 May 2017
     Data summarized by Angie Shelton, 18 May 2017
All six species
have fewer
flowering
plants at GLNP.

See detailed view of
less common
species on next
slide.
All six species
Subset of species   have fewer
on previous graph   flowering
                    plants at GLNP.

                    Graph shows only the
                    less common species
                    from previous slide.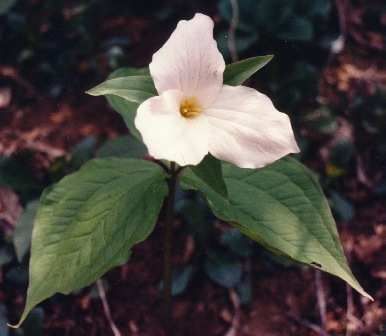
Largest plants
of all six
species were
shorter at
GLNP than
other sites.
Why Survey Spring Ephemerals?
• Very susceptible to deer
  browsing: first fresh green food
  after winter
• Most species are long-lived
  perennials that have to get
  several years old before they
  have energy to make flowers
• If plants are browsed, they may
  grow back smaller next year and
  delay flowering.
• This can lead to extinction of
  local populations.
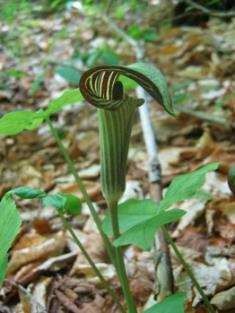
Indicator Species for Deer in Indiana
                  Height of these species is a good
                  indicator of deer browsing
                  intensity in Indiana (Webster and
                  Parker 1996)
                                            Average Height
                                                 (cm)
                                           control   fenced
                      jack-in-the-pulpit    10.6      14.0

                      sweet cicely           -        14.7

                      white baneberry       10.3      20.5
Effect of Deer on Plant Height
After protection
from deer, plants
grow taller.
Taller plants have
greater chance
of reproduction.Ecological Effects of Deer Overpopulation
• increases plant invasions (Vavra et al 2007, Baiser et al 2008)
• reduces size of eaten and uneaten plants (Heckel et al 2010)
• increases soil compaction (Heckel et al 2010)
• inhibits natural succession and tree regeneration (Côté et al 2004,
Rooney & Waller 2003)
• causes shift to alternative community types (Webster et al 2008,
Augustine et al 1998, Waller & Alverson 1997)
• reduces habitat for birds, small mammals, other animals
(McShea & Rappole 2000)
• reduces food resources for other herbivores (Côté et al 2004)
• reduces litter depth (Heckel et al 2010)
• increases bare soil erosion and sediment runoff
• increases disease in deer populations (Côté et al 2004)
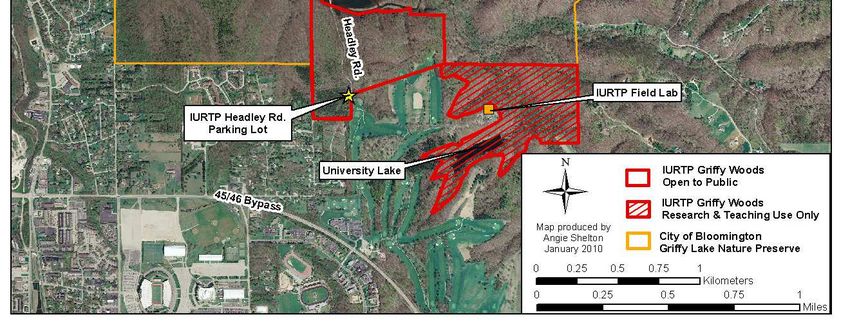
• makes humans cranky (countless citizens)• Researcher in IU Biology Department • Work for IU Research and Teaching Preserve • Map of Preserve Sites/ Map of Griffy ownership • ERAC chair • Advisor for Deer Task Force
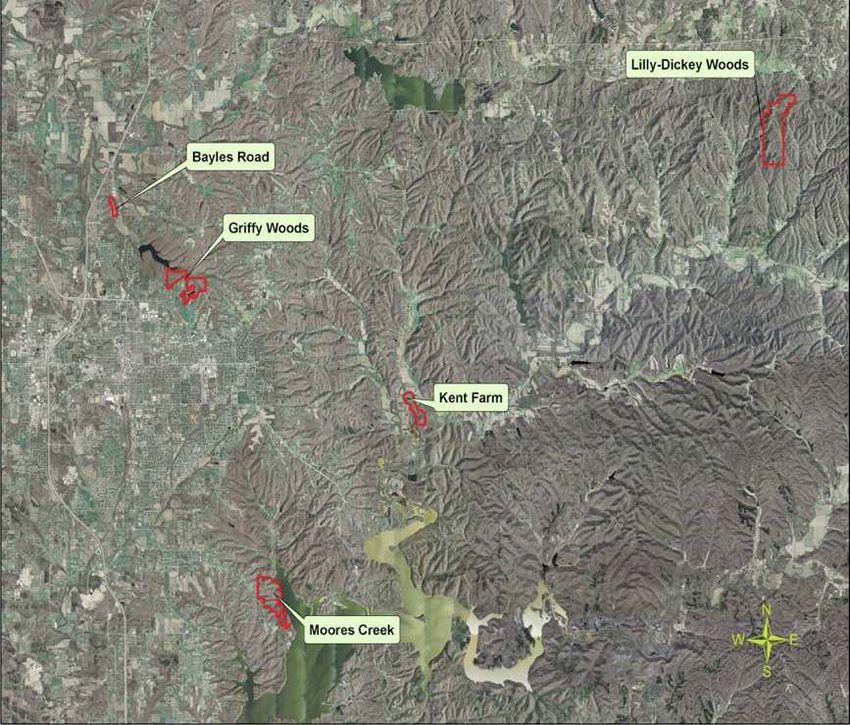
Griffy Woods Deer Density
                                                                              Hwy 37             Locations of Pellet
                                                                                                   Count Surveys
                          350
                                    9 – 95
                                   per plot
                          300                                                                                   Nashville
average pellet piles/ha

                          250                                        45/46

                          200                                                                                  Hwy 46
                                                                        3rd
                                                                        St
                          150
                                                                                       Hwy 446
                          100
                                               2–5        0–6
                          50                  per plot   per plot

                            0
                            Griffy Woods
                               Griffy Moores
                                          Lilly
                                             Creek
                                        Moores  Dickey
                                                   Lilly Woods
                                Woods         Creek      Dickey               Approximately 11 times more
                                                         Woods
                                                                              pellet piles at Griffy Woods than
                          * Plot Area = 1664 m2. 1 ha = 10,000 m2.
                                                                              at two other nearby Preserves.
Effects on Woody Plants
open forest plot fenced forest plot
28 woody plants 204 woody plants
7 species 21 speciesVegetative Structure
20
P < 0.0001 Unfenced
Japanese stiltgrass is more
# Touches by Vegetation
16 Fenced abundant in controls than
exclosures.
12
P = 0.0003 Suggests interaction between
8 deer and invasive species.
P = 0.0211
4
Plot invaded by Stiltgrass
300
Control
# Touches by Vegetation
0 250
20 60 140 Exclosure
Height (cm) 200
150
Vegetation is significantly more abundant 100
inside exclosures at all heights within 50
browse range. Data collected after 2-3 0
years of fencing. 20 60 140
Height Above Ground (cm)Tree and Shrub Seedlings
40
P = 0.0047 Outside exclosures: Control
35
- No native trees are
Exclosure
30 regenerating
25 - Dominated by invasives
# new seedlings
unpalatable
and unpalatable species
20 invasive
15
native trees
10
5
0
pawpaw
viburnum
multiflora rose
honeysuckle
spicebush
beech
barberry
musclewood
sassafras
privet
grape
sugar maple
ash
hickory
tree or shrub speciesYou can also read