Guide to Reading Your PCMH Report
←
→
Page content transcription
If your browser does not render page correctly, please read the page content below
Guide to Reading
Your PCMH Report
This guide explains how to read your PCMH report and can help you with the following:
• Find specific information in the report
• Understand the connection between sections of the report and program requirements

     Things to know about your PCMH report
     • The report provides information based on current performance data
        — Data is displayed for a one-year time period. The exact timeframe is noted on each
          page.
     • The report shows information about your PCMH practice
        — For pooled practices, the information for your shared performance entity will be
          provided in the shared performance entity report (see “Guide to Reading Your
          Pool Report”)
        — All PCMHs who are associated with a pool will receive a shared performance entity
          report.
The PCMH program seeks to reward primary care physicians for high-quality care that drives system-wide
quality and efficiency. The PCMH program is part of the Arkansas Health Care Payment Improvement
Initiative, a multi-payer collaboration between Arkansas Blue Cross Blue Shield, Arkansas Medicaid,
Arkansas State and Public School Employees Plan, QualChoice of Arkansas, Arkansas Health and
Wellness Solutions, United Healthcare and Walmart.

                  Visit us online to login to the portal and access PCMH resources

                        www.paymentinitiative.org
    Our website has the following:
    • PCMH program details including the PCMH                     The website also has a link to
      Program Policy Addendum and methodology                     the online portal. Use a secure
      used to calculate metrics                                   username and password for the
    • Archived webinars on the PCMH program,                      ability to perform the following:
      guidance on interpreting reports and                         •   View your full report
      understanding shared performance                             •   Submit required program
    • Frequently asked questions, where to direct                      data
      your questions, and links to resources

      Contact our knowledgeable provider support teams with questions and feedback
•   Your Medicaid provider representative at Arkansas Foundation for Medical Care can be reached at
    1-501-212-8600 or PCMH@afmc.org
•   DXC Technology Arkansas Health Care Payment Improvement Unit can be reached at
    1-866-322-4696, locally at 1-501-301-8311, or via email at ARKPII@dxc.com
Why do I get so many reports?
The Arkansas PCMH program runs on calendar years. Each calendar year, the program Medicaid Little RockMedicaid
Clinic Little RockApril
123456789 Clinic
2019 (Q1) 123456789 July–2013
PCMH report 2019 performance period
is refined a bit, with its own list of practice support activities and incentive, core, quality,
and informational metrics.
Although each program spans one calendar year, claims processing takes time. More
than 95% of claims are filed and processed within three months, but Medicaid rules give
PCMH Report for Period of 10/01/2017 to 09/30/2018
providers 365 days from the date of service to file claims, so each calendar year will
PCMH Configuration – 2019 Performance Period:
continue to be processed for 12 further months. Therefore, a practice that is enrolled in Little Rock Clinic
the 2018 program will continue to receive reports for several quarters, and if that practice
is also enrolled in the 2019 program, it will receive a separate report for that configuration. NOTICE: Health information included in this report is protected under HIPAA rules. The information is disclosed to
the healthcare provider (covered entity) only for carrying out healthcare operations. The information must be
safeguarded, used, transmitted, and disclosed only in accordance with the HIPAA rules. The information contained
in these reports is intended solely for use in the administration of the Medicaid program. The data in the reports is
neither intended nor suitable for other uses, including the selection of a health care provider. For more information,
please visit www.paymentinitiative.org.
0
Additionally, the Arkansas PCMH program requires at least 1,000 beneficiaries be
attributed to a PCMH for at least six months in order for that PCMH to be eligible for shared performance
payments. To help more practices qualify for these payments, PCMHs below that threshold may voluntarily pool with
other PCMHs to reach the 1,000-beneficiary threshold, and any small PCMH not enrolled in a pool will be placed
in either the statewide default pool or the petite pool for shared performance purposes. Each PCMH enrolled in a
voluntary pool, the petite pool, or the statewide default pool will receive both a provider report that pertains only to
that PCMH and a pool report (also called a shared performance entity report), which contains data from all PCMHs
in the pool. Standalone PCMH practices that have at least 1,000 attributed beneficiaries will only receive a provider
report. Starting in 2019, all practices with less than 300 beneficiaries may voluntarily pool with other PCMHs to reach
the 1,000 minimum requirement.
Finally, though the Arkansas PCMH program runs on a calendar-year basis and metrics are processed quarterly,
provider reports allow PCMHs to see how their performance compares to the state-wide average across a 12-month
period. Because of the time required for claims processing, each report’s 12-month time frame will end either about
six months prior to when the report will be released or at the end of the configuration’s calendar year. These reports
are usually released near the end of each calendar quarter.
So near the end of the third quarter of 2019, for example, a PCMH that was enrolled in both the 2018 and 2019
versions of the program and was in a voluntary pool both years will receive a 2018 provider report and a 2018 pool
report, which both will cover the period ranging from January 1, 2018, to December 31, 2018, and a 2019 provider
report and a 2019 pool report, which both will cover the period ranging from April 1, 2018, to March 31, 2019.
What reports to expect in coming quarters
Report Run Performance Period (2018) Performance Period (2019*) Report Delivery (Month Year)
Q2 2019 1/1/18 - 12/31/18 1/1/18 - 12/31/18 June 2019
Q3 2019 1/1/18 - 12/31/18 4/1/18 - 3/31/19 September 2019
Q4 2019 N/A 7/1/18 - 6/30/19 December 2019
Q1 2020 1/1/18 - 12/31/18 10/1/18 - 9/30/19 April 2020
Q2 2020 N/A 1/1/19 - 12/31/19 June 2020
Q3 2020 N/A 1/1/19 - 12/31/19 September 2020
Q1 2021 N/A 1/1/19 - 12/31/19 April 2021
*Quality metrics – HPB PCP, Infant Wellness, Child Wellness, Adolescent Wellness, URI, HbA1c, COB, Tamiflu, Controlling
BP, HbA1c Poor Control, Tobacco Use
1Your report provides information on four areas
Medicaid Little RockMedicaid
Clinic Little RockApril
123456789 Clinic
2019 (Q1) 123456789 July–2013
PCMH report 2019 performance period
To be evaluated after
PCMH overview 2019 performance period
Services paid through 02/14/2019 for claims from 10/01/2017 to 09/30/2018 18
Practice support activities status based on provider portal entries as of 12/31/2018
PCMH overview
Attributed Point in Time Beneficiaries, 01/01/2019
Beneficiaries attributed to you for at least 6 months, 10/01/2017 - 09/30/2018
(1,000 required during performance period for shared performance eligibility)
Your 6 Month Attributed Patient Panel
6,000
5,200 Summary Data (page 2 of report)
Only saw provider(s) outside
2000
The summary page gives basic data for your PCMH
the PCMH
Did not see any provider 1300
Saw any PCP in the PCMH 1900
0 500 1000 1500 2000 2500
Practice support report (page 3)
Current care coordination Completed 1 out of 1 practice support activities
overview as well as a summary of the
requirements for practice support and shared
PBPM payment, contingent PCMHs must meet activities by the due dates listed on page 3.
on meeting activity.
$4.50
performance payments once the performance period
Shared performance report (pages 5-9)
Meeting 6 out of 11 evaluated quality metrics
M
At least two-thirds required for performance period (p. 7-8)
A
Your Quality Metric Performance
begins.
Statewide Quality Metric Performance
Passing
ing Two-Thirds
Two-Thir
Thirds
Third
irdss Qualit
Quality
Qual
alityy Metrics
M tr Not Passing
Passin
ssingg Two-Thirds
T
Two
wo Th
wo-Thirds
Third
h ddss Qualit
Quality
Q
Qu y Metrics
Metr
Page 2 2
Medicaid Little RockMedicaid
Clinic Little RockApril
123456789 Clinic
2019 (Q1) 123456789 July–2013
PCMH report 2019
2016 performance period Medicaid Little RockMedicaid
Clinic Little RockApril
123456789 Clinic
2019 (Q1) 123456789 July–2013
PCMH report 2019
2016 performance period
Practice supportt reportt
Practice Support Data (page 3 of report)
Metric Performance Summary
Practice support activities status based on provider portal entries as of 09/30/2018 Services paid through 02/14/2019 for claims from 10/01/2017 to 09/30/2018
Pass Fail Not evaluated this quarter / Under validation Pass Fail Not evaluated this quarter / Not eligible for metric
Practice support activity Due date Status Quality Metric Summary Status
1. % of a practice’s high priority beneficiaries who
The practice support report includes progress report
# seen by PCP at least 2x in past 12 months
A. Identify top 10% of high-priority patients (including behavioral clients) 03/31/2019 have been seen by any PCP within their PCMH at
# high-priority beneficiaries
least twice in the past 12 months
2. % beneficiaries who turned 15 months old during # 15 month old beneficiaries with at least five
the performance period who receive at least five wellness visits
B. Make available 24/7 access to care. 06/30/2019 wellness visits in their first 15 months (0 – 15 months) # beneficiaries 0-15 months
on activities. This element will be tied to practice
# 3-6 year old beneficiaries with one or more
3. % of beneficiaries 3-6 years of age who had one or
wellness visits per year
more well-child visits during the measurement year
C. Track same-day appointment requests 06/30/2019 # beneficiaries 3-6 years
# 12-20 year old beneficiaries with one or more
4. % of beneficiaries 12-20 years of age who had one
wellness visits per year
or more well-care visits during the measurement year
# beneficiaries 12-20 years
support payments (PMPM) during the performance
D. Capacity to receive direct e-messaging from the patients 06/30/2019
5. % of beneficiary, age 1 year and older, events with # beneficiary events that were prescribed an
antibiotic
a diagnosis of non-specified URI that had antibiotic # events for beneficiaries 1 year and older with a
treatment during the measurement period diagnosis of non-specified URI
E. Childhood / Adult Vaccination Practice Strategy 06/30/2019
6. % of diabetes beneficiaries who complete annual # with HbA1C testing
period.
HbA1C, between 18-75 years of age # diabetic beneficiaries age 18–75 years
F. Join SHARE or participate in a network that delivers hospital discharge
06/30/2019
information to practice within 48 hours # beneficiaries that were prescribed two or more
7. % of beneficiaries age 18 and older with concurrent
prescriptions
use of prescription opioids and benzodiazepines
# of beneficiaries age 18 and older
G. Medication Management 06/30/2019 # of beneficiaries who received Tamiflu
Metric Performance Data (page 4 of report)
8. % of beneficiaries 1-18 years of age who received
antibiotic on the same day
Tamiflu and respiratory antibiotics on the same day
# beneficiaries 1–18 years old
9. % of patients 18-85 years of age who had a # patients with blood pressure reading
H. Care Plans for High Priority Patients 12/31/2019
diagnosis of hypertension and whose blood pressure = 84% opioids and
% of patients 18-85 years of age 80% 27
benzodiazepines
who had a diagnosis of hypertension 50 Pending Pending submission of eCQM metric
% of patients who turned 15 30 0 20results
40 through
60 80 100
months old during the performance and
2019 Qual.who
% beneficiaries level:whoseHow to interpret the legend for metrics charts1
Legend for quality and core metrics
The legend below applies to the shared performance quality and core metrics (pages 6-9)
• These symbols indicate whether current performance meets qualifying levels
• In instances where there are less than 25 beneficiaries, that metric will not be evaluated
— For example, if two out of the seventeen quality metrics cannot be evaluated, the PCMH
would have to meet two-thirds of the fifteen evaluated quality
q y metrics
Pass Fail Not evaluated this quarter / Not eligible for metric
Symbol Legend description Details
Pass The current performance in this report
meets qualifying levels for the metric
The current performance in this report
Fail does not meet qualifying levels for the
Fail
metric
Not evaluated this quarter/ Metric data relies on data reported
Not eligible for metric in the provider portal that is not yet
due or the PCMH/Pool does not meet
minimum eligibitily criteria for the metric
Legend for incentive metrics
The legend below applies to the shared performance incentive metrics (page 6)
• These symbols indicate the percentile rank of your current performance, if applicable
• For the incentive focus metric, in instances where there are less than 25 beneficiaries, the
metric will not be evaluated
1st – 10th percentile 11th – 35th percentile 36th + percentile Not evaluated this quarter / Not eligible for metric
Symbol Legend description Details
1st – 10th percentile PCMH/Pool is currently at or below the 10th percentile for
this metric.
11th – 35th percentile PCMH/Pool is currently between 11th - 35th percentile for
this metric.
36th + percentile PCMH/Pool is currently above the 36th percentile for this
metric.
Not evaluated this quarter / Metric is not evaluated this quarter or the PCMH/Pool did
Not eligible for metric not meet the minimum denominator requirements to be
measured for the metric.
1 Relevant to charts and metrics for shared performance (pages 5 - 9)
3How to interpret your summary data
Summary
Su Page
A Medicaid
Medi
Med
Me
APC
edi
PCMH
P
dic
d
diiiccaid
ai
CM overview
Little RockMedicaid
Clinic Little RockApril
123456789 Clinic
2019 (Q1) 123456789 July–2013
PCMH report 2019 performance period
To be evaluated after
P
PCMH Overview Serv
Services
Ser
Se
erv paid through 02/14/2019 for claims from 10/01/2017 to 09/30/2018 18
2019 performance period
Practice support activities status based on provider portal entries as of 12/31/2018
The overview gives basic facts about your PCMH overview
practice as of the time periods specified Attributed Point in Time Beneficiaries, 01/01/2019 6,000
Beneficiaries attributed to you for at least 6 months, 10/01/2017 - 09/30/2018 5,200
(1,000 required during performance period for shared performance eligibility)
▪ “Attributed point in time beneficiaries” shows the Your 6 Month Attributed Patient Panel
number of beneficiaries that were attributed to your
Only saw provider(s) outside
the PCMH
2000
1300
PCMH as of the start of the performance period
Did not see any provider
Saw any PCP in the PCMH 1900
(i.e. January 1 for Q1) 0 500 1000 1500 2000 2500
Practice support report (page 3)
▪ “Beneficiaries attributed to you for at least 6 Current
Cur
Cu
C u
urr
ur
rrre care coordination Completed 1 out of 1 practice support activities
months” counts only beneficiaries assigned to B PBPM
P
PB
o
BPM payment, contingent
n meeting
on me
me activity.
PCMHs must meet activities by the due dates listed on page 3.
primary care physicians in your PCMH for at least $4.50
6 months in the report period Shared performance report (pages 5-9)
M
Meeting 6 out of 11 evaluated quality metrics
A least two-thirds required for performance period (p. 7-8)
At
• The 6 Month Attributed Patient Panel is broken Your
You
Yo
Yo
our
ur
u QQuality Metric Performance
down into three categories to assist population A
management. The three categories are:
— Only saw provider outside the PCMH Statewide Quality Metric Performance
— Did not see any provider
— Saw any PCP in the PCMH Passing Two-Thirds Quality Metrics Not Passing Two-Thirds Quality Metrics
2
• Two graphs are provided to assist PCMHs in their
quality metric performance and how it compares to
all PCMHs enrolled in the program.
These two graphs are:
— Your Quality Metric Performance
— Statewide Quality Metric Performance
B
Practice
Pra Support Report Summary
This section provides two main data points of estimated care coordination payments and
requirement to continue receiving practice support, including payments.
▪ Care coordination estimates are based on historical numbers and the risk profile of patients
▪ In order to continue receiving practice support, including payments, practices must meet all
activities by the required due dates
Completed 1 out of 1 practice support activities
PCMHs must meet activities by the due dates listed on page 3.
4Performance Based Incentive Payments Summary
C
Medicaid Little RockMedicaid
Clinic Little RockApril
123456789 Clinic
2019 (Q1) 123456789 July–2013
PCMH report 2019 performance period
Shared performance report
Services paid through 12/31/2018 for claims from 10/01/2017 to 09/30/2018
PBIP summary
Data is PCMH-level. Participating practices in a shared performance entity will receive an entity-level report as
In
Incentive Metric Performance
well.
Incentive Metric Performance
You 1st – 10th percentile 11th – 35th percentile 36th + percentile
Adolescent Wellness
100%
Hundreds
90%
This page provides a population breakdown to provide PCMHs
80%
Rate
70%
60%
a graphical representation of their Focus and Incentive metric
50%
Emergency Department Utilization
performance compared to the rest of the PCMHs/Pools
enrolled in the PCMH/Pool rankings as referenced below.
100%
Hundreds
90%
80%
Rate
70%
60%
50%
Acute Hospital Utilization Adolescent Wellness
100%
100%
Hundreds
90%
Hundreds
80%
Rate
70% 90%
60%
80%
Rate
50%
70%
Note: For PBIP, incentive metric performance will be evaluated at the shared performance entity level.
60%
50% 5
D
P
PBIP Summary
This page is broken into three sections to assist
PCMHs/Pools in their PBIP metrics:
▪ Core metrics that determine if PCMHs are meeting minimum
metric requirements. Medicaid Little RockMedicaid
Clinic Little RockApril
123456789 Clinic
2019 (Q1) 123456789 July–2013
PCMH report 2019 performance period
Core Metrics Shared performance report
Services paid through 12/31/2018 for claims from 10/01/2017 to 09/30/2018
Pass Fail Not evaluated this quarter / Not eligible for metric PBIP summary
Legend: You PCMH Statewide Average Qualifying Level
Metric You (10/01/2017-09/30/2018) Current performance Core Metrics
Pass Fail Not evaluated this quarter / Not eligible for metric
Metric You (10/01/2017-09/30/2018) Current performance
% of patients who turned 15 30 % of patients who turned 15 30
months old during the performance
months old during the performance period who only received 0-1 40
80%
80
period who only received 0-1 40 80 wellness visits in their first 15
months
50
80% 0 20 40 60 80 100
wellness visits in their first 15 50 2019 Qual. level:Understanding the status of your practice support
activities
Practice Support Report
Legend: Pass Fail Not evaluated this quarter / Under validation
Medicaid Little RockMedicaid
Clinic Little RockApril
123456789 Clinic
2019 (Q1) 123456789 July–2013
PCMH report 2019
2016 performance period
Practice supportt reportt
Practice support activities status based on provider portal entries as of 09/30/2018
Pass Fail Not evaluated this quarter / Under validation
Practice support activity Due date Status
A. Identify top 10% of high-priority patients (including behavioral clients) 03/31/2019
B. Make available 24/7 access to care. 06/30/2019
C. Track same-day appointment requests 06/30/2019
D. Capacity to receive direct e-messaging from the patients 06/30/2019
E. Childhood / Adult Vaccination Practice Strategy 06/30/2019
F. Join SHARE or participate in a network that delivers hospital discharge
06/30/2019
information to practice within 48 hours
G. Medication Management 06/30/2019
H. Care Plans for High Priority Patients 12/31/2019
I. Patient Literacy Assessment Tool 12/31/2019
J. Ability to receive patient feedback 12/31/2019
K. Care instructions for High Priority Patients 12/31/2019
L. 10-day Follow up after an Acute Inpatient Stay 12/31/2019
M. Developmental / Behavior Health Assessment for Children and
12/31/2019
Adolescents
3
Pre-defined activities come from the PCMH Program Policy Addendum
▪ The provider portal at https://secure.ahin-net.com/ahin/logon.jsp should be used to submit materials
for completed activities. You can also link to the provider portal on www.paymentinitiative.org.
▪ The status will show a green circle whenever the activity has been submitted, subject to
verification. A red circle will be present if the activity was not submitted. Activities which are under
validation or are required to be completed by a later date will be marked with a gray circle.
6Understanding the status of your metric
performance summary
Metric Performance Summary
Legend: Pass Fail Not evaluated this quarter / Not eligible for metric
Medicaid Little RockMedicaid
Clinic Little RockApril
123456789 Clinic
2019 (Q1) 123456789 July–2013
PCMH report 2019
2016 performance period
Metric Performance Summary
Services paid through 02/14/2019 for claims from 10/01/2017 to 09/30/2018
Pass Fail Not evaluated this quarter / Not eligible for metric
Quality Metric Summary Status
1. % of a practice’s high priority beneficiaries who
# seen by PCP at least 2x in past 12 months
have been seen by any PCP within their PCMH at
# high-priority beneficiaries
least twice in the past 12 months
2. % beneficiaries who turned 15 months old during # 15 month old beneficiaries with at least five
the performance period who receive at least five wellness visits
wellness visits in their first 15 months (0 – 15 months) # beneficiaries 0-15 months
# 3-6 year old beneficiaries with one or more
3. % of beneficiaries 3-6 years of age who had one or
wellness visits per year
more well-child visits during the measurement year
# beneficiaries 3-6 years
# 12-20 year old beneficiaries with one or more
4. % of beneficiaries 12-20 years of age who had one
wellness visits per year
or more well-care visits during the measurement year
# beneficiaries 12-20 years
5. % of beneficiary, age 1 year and older, events with # beneficiary events that were prescribed an
antibiotic
a diagnosis of non-specified URI that had antibiotic # events for beneficiaries 1 year and older with a
treatment during the measurement period diagnosis of non-specified URI
6. % of diabetes beneficiaries who complete annual # with HbA1C testing
HbA1C, between 18-75 years of age # diabetic beneficiaries age 18–75 years
# beneficiaries that were prescribed two or more
7. % of beneficiaries age 18 and older with concurrent
prescriptions
use of prescription opioids and benzodiazepines
# of beneficiaries age 18 and older
# of beneficiaries who received Tamiflu
8. % of beneficiaries 1-18 years of age who received
antibiotic on the same day
Tamiflu and respiratory antibiotics on the same day
# beneficiaries 1–18 years old
9. % of patients 18-85 years of age who had a # patients with blood pressure reading
diagnosis of hypertension and whose blood pressureHow to read metrics charts1
Metrics charts
The format of metrics charts are consistent across shared performance metrics
(pages 6 - 9), and additional informational metrics (pages 10 - 14)
• Informational metrics do not show qualifying levels (known as 2019 targets) because they are
not evaluated as part of the PCMH program requirements, but they do show the state average
The result for this report’s time period is shown
in green font if qualifying levels are met, red This report’s time period is The dotted line displays the
font if qualifying levels are not met and black labeled here in the header qualifying level
font if there are not enough beneficiaries to
evaluate this metric
Legend: You PCMH Statewide Average Qualifying Level
Metric You (10/01/2017-09/30/2018) Current performance
% of beneficiaries who turned 15 80
months old during performance
period with >= 5 well-child visits 40
80%
during first 15 months of life 27
2
50
0 20
0 40 60 80 100
2019 Qual. level: >= 62%
Pre-published qualifying levels The numbers reflect the patients in your The state average indication is a rate of
from the PCMH Program Policy PCMH who are included in the denominator average calculation that is comprised of eligible
Addendum and numerator of this metric PCMHs that met the metric requirements
1 Relevant to charts and metrics for shared performance (pages 5 - 9), and additional informational data (pages 10 - 14)
sections of the report
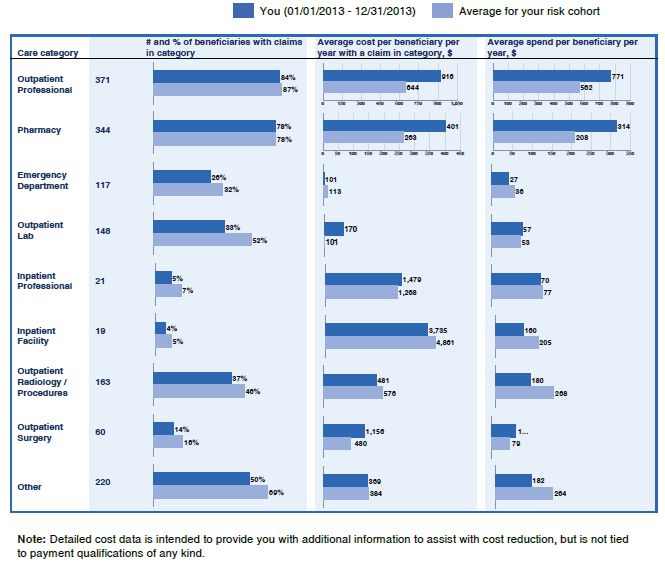
8Understanding your cost data
Cost data by care category Cost data by care category is
displayed in the additional data
Medicaid Little RockMedicaid
Clinic Little RockApril
123456789 Clinic
2019 (Q1) 123456789 July–2013
PCMH report 2019 performance period
section of the report (page 15)
Additional data for informational purposes A
Services paid through 02/14/2019 for claims from 10/01/2017 to 09/30/2018
Additional metrics not
ot tied to pay
payments (Informational
mational metrics are intended to assist improvement
improve efforts)
Number and percentage of
N
beneficiaries with claims in the care
A B
(07/01/2015
You (10/01/2017
10
0///0
01
0 2017 -– 0
1//2
/2017 06/30/2016)
09/
09/30/2018)
9
9/ State
te a
C
aver
ave
average
ve
ver
errage
category - enables you to understand
Outpatient
Professional
the breadth of membership involved
Pharmacy
Emergency B
Department
Average cost per beneficiary per
A
Outpatient
Lab
D year with a claim in the category -
Inpatient
Professional
allows you to understand what the
value is of an average patient
Inpatient
Facility
Outpatient
Radiology/
C
Outpatient
Procedures
Outpatient
Surgery Average spend in the care category
A
Other
per beneficiary per year (across all
attributed beneficiaries) - allows you
to see what the total value is of
continued improvement in a category
D
Statewide average -
S
enables you to identify areas for
improvement, i.e. where your
15
performance is below that of your
peers
Cost information shows a comparison of your spend by care category to participating practices
• The data is intended to provide insight around where your spend occurs compared to your peers
enabling you to focus on areas for improvement
• The care categories are the same categories used in Arkansas Payment Improvement Initiative
(AHCPII) episode reports. Over time, these will be refined to highlight data particularly relevant to
patient centered medical homes
• Care categories include: outpatient professional, pharmacy, emergency department, outpatient lab,
inpatient professional, inpatient facility, outpatient radiology / outpatient procedures, outpatient
surgery, and others
• The data is not tied to payment qualifications of any kind
Note: For additional detail on care categories refer to the “PCMH Program Policy Addendum” on the AHCPII website.
9You can also read