Gut Microbiome-Derived Uremic Toxin Levels in Hemodialysis Patients on Different Phosphate Binder Therapies
←
→
Page content transcription
If your browser does not render page correctly, please read the page content below
Research Article

                                                               Blood Purif                                                                Received: September 21, 2020
                                                                                                                                          Accepted: May 27, 2021
                                                               DOI: 10.1159/000517470                                                     Published online: August 10, 2021

Gut Microbiome-Derived Uremic Toxin
Levels in Hemodialysis Patients on
Different Phosphate Binder Therapies
Lin-Chun Wang a Leticia M. Tapia a Xia Tao a Joshua E. Chao a Ohnmar Thwin a
Hanjie Zhang a Stephan Thijssen a Peter Kotanko a, b Nadja Grobe a
aRenal   Research Institute, New York, NY, USA; bIcahn School of Medicine at Mount Sinai, New York, NY, USA

Keywords                                                                                           ments, by the Bristol Stool Scale (BSS), and pill usage were
Hemodialysis · Uremic toxins · Phosphate binders ·                                                 assessed weekly. Results: The SEV group reported a 3.3-fold
Sucroferric oxyhydroxide · Sevelamer carbonate                                                     higher frequency of BSS stool types 1 and 2 (more likely con-
                                                                                                   stipated, p < 0.05), whereas the SFO group reported a 1.5-
                                                                                                   fold higher frequency of BSS stool types 5–7 (more likely
Abstract                                                                                           loose stool and diarrhea, not significant). Participants in the
Introduction: Constipation is prevalent in patients with kid-                                      SFO group showed a trend toward better adherence to
ney failure partly due to the use of medication, such as phos-                                     phosphate binder therapy (SFO: 87.6% vs. SEV: 66.6%, not
phate binders. We hypothesized that serum levels of gut mi-                                        significant). UTOX, serum phosphorus, nutritional and liver
crobiome-derived uremic toxins (UTOX) may be affected by                                           function markers, and tryptophan were not different be-
the choice of phosphate binder putatively through its im-                                          tween the two groups. Conclusion: There was no difference
pact on colonic transit time. We investigated two commonly                                         in the gut microbiome-derived UTOX levels between phos-
prescribed phosphate binders, sevelamer carbonate (SEV)                                            phate binders (SFO vs. SEV), despite SFO therapy resulting in
and sucroferric oxyhydroxide (SFO), and their association                                          fewer constipated participants. This pilot study may inform
with gut microbiome-derived UTOX levels in hemodialysis                                            study design of future clinical trials and highlights the impor-
(HD) patients. Methods: Weekly blood samples were collect-                                         tance of including factors beyond bowel habits and their as-
ed from 16 anuric HD participants during the 5-week obser-                                         sociation with UTOX levels.              © 2021 The Author(s)
vational period. All participants were on active phosphate                                                                                 Published by S. Karger AG, Basel

binder monotherapy with either SFO or SEV for at least 4
weeks prior to enrollment. Eight UTOX (7 gut microbiome-
derived) and tryptophan were quantified using liquid chro-                                             Introduction
matography-mass spectrometry. Serum phosphorus, nutri-
tional, and liver function markers were also measured. For                                             The loss of kidney function in kidney failure patients
each substance, weekly individual levels, the median con-                                          is accompanied by the retention of a host of metabolites
centration per participant, and differences between SFO and                                        [1]. Many of these uremic retention solutes have been
SEV groups were reported. Patient-reported bowel move-                                             shown to negatively affect the functioning of cells and or-

karger@karger.com        © 2021 The Author(s)                                                      Correspondence to:
www.karger.com/bpu       Published by S. Karger AG, Basel                                          Nadja Grobe, nadja.grobe @ rriny.com
                         This is an Open Access article licensed under the Creative Commons
                         Attribution-NonCommercial-4.0 International License (CC BY-NC)
                         (http://www.karger.com/Services/OpenAccessLicense), applicable to
                         the online version of the article only. Usage and distribution for com-
                         mercial purposes requires written permission.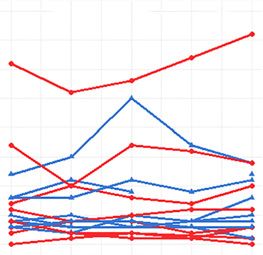
gans, resulting in the uremic syndrome [2]. Some of these      pacts the generation of gut-derived UTOX as longer co-
uremic toxins (UTOX) are derived from colon microbes           lonic transit time is associated with higher UTOX levels
[3–7]. Gut microbiome dysbiosis – changes in composi-          [7].
tion and function of the gut microbiome – is common in
kidney failure patients. One contributing factor to gut
dysbiosis is the change of gastrointestinal tract environ-        Materials and Methods
ment by the influx of urea, uric acid, and oxalate from the
                                                                   Study Design
blood into the gut. A previous study revealed that the             The study presented here is a multicenter, 6-week observation-
dominant microbiota in kidney failure patients are fami-       al study conducted at 4 HD clinics in New York, NY, USA. The
lies expressing urease, urate oxidase, and p-cresol- and       inclusion criteria were kidney failure patients on thrice weekly HD
indole-forming enzymes [8]. These enzymes generate             regimen, ≥18 years of age at the time of informed consent, and on
metabolites that are subsequently absorbed into the blood      active phosphate binder monotherapy with either SFO or SEV for
                                                               at least 4 weeks prior to enrollment. Seventeen study participants
and, in some cases, further metabolized into UTOX in the       were enrolled from September 2018 to March 2019 with no follow-
liver. Some toxins are highly protein-bound and thus are       up afterward. The exclusion criterion was inability to maintain di-
inefficiently removed by conventional hemodialysis             ary to track binder usage and bowel movements. Sixteen study par-
(HD) treatment [9]. Their accumulation in kidney failure       ticipants completed all study visits; 1 patient was withdrawn due
patients may contribute to systemic inflammation and           to relocation (Fig. 1). All study participants were anuric and treat-
                                                               ed with polysulfone dialyzers.
chronic kidney disease (CKD) progression [10–12]. Fur-             Study participants were seen on a scheduled mid-week treatment
ther, elevated levels of these protein-bound UTOX have         day once a week for 6 consecutive weeks. An interview was adminis-
been associated with higher all-cause and cardiovascular       tered in the first week, which included study participants’ binder pre-
mortality [13]. However, it is important to acknowledge        scription and bowel habits. In the subsequent 5 weeks, predialysis
that to date no causal relationship between colon-derived      blood samples were collected to measure UTOX and other biomark-
                                                               ers related to phosphate binder therapy, nutritional status, and liver
UTOX and poor clinical outcomes has been established.          function. Seven gut-derived UTOX were selected to test the hypoth-
    Dialysis patients frequently suffer from constipation      esis: trimethylamine-N-oxide (TMAO), indoxyl glucuronide (IG),
as a result of prolonged colonic transit time [14]. Pro-       phenylacetylglutamine (PAG), IS, 3-carboxy-4-methyl-5-propyl-
longed colonic transit time can result in increased protein    2-furanpropionic acid (CMPF), PCS, and hippuric acid (HA; derived
fermentation, altered gut microbiota, and subsequent           from both the gut microbiome and mammalian sources). For com-
                                                               parison, we also measured mammalian-derived kynurenic acid
changes in the production of UTOX precursors [7].              (KYNA) and nutritional marker tryptophan (TRP). A weekly diary
Chronic constipation is partly due to the use of medica-       was provided to the study participants to capture phosphate binder
tion, such as phosphate binders [14]. Interestingly, one of    usage and bowel movements. Satisfaction and frequency of bowel
the significant side effects of iron-based (sucroferric oxy-   movements along with stool consistency, determined by Bristol Stool
hydroxide [SFO]) phosphate binders is more frequent            Scale (BSS) [20], were assessed to indicate the bowel habit for each
                                                               patient. On the BSS, types 1 and 2 were considered as likely consti-
bowel movements, loose stool, and diarrhea [15–17]. If         pated, types 5–7 as likely loose stool or diarrhea, and types 3 and 4
patients on SFO (Velphoro®) experience more frequent           were regarded as normal. Bowel satisfaction was evaluated using a
bowel movements, their colonic transit time may be             numeric scale from 1 (unsatisfactory) to 10 (completely satisfactory).
shorter than patients on a widely prescribed phosphate         The adherence to phosphate binder therapy was determined by
binder, sevelamer carbonate (SEV; Renvela®), who re-           weekly pill counts. The adherence was calculated as the percentage
                                                               of the actual number (pill count) to the expected number (prescrip-
ported higher rates of constipation [15]. The combina-         tion) of pills consumed. UTOX levels, phosphate binder usage and
tion of these factors may induce overgrowth of proteo-         bowel habits, were analyzed until March 2021. All study procedures
lytic species, which favors the production of both toxic       were approved by Western Institutional Review Board® (Protocol
metabolites (e.g., p-cresyl sulfate [PCS], phenyl acetic       number: #20181972) and performed in accordance with the princi-
acid, indoxyl sulfate [IS], and indole 3-acetic acid) and      ples of the Declaration of Helsinki. The signed written informed con-
                                                               sent forms were obtained from all participants for this study.
proinflammatory substances (e.g., PCS) in kidney failure
patients [18, 19].                                                Sample Preparation
    We hypothesized that serum levels of gut microbiome-          Serum was aliquoted and stored at −80°C until analysis. For
derived UTOX may be affected by the choice of phos-            UTOX and TRP analysis, samples were prepared according to
phate binder putatively through its impact on colonic          Dunn et al. [21] with some modifications. Briefly, 50 µL serum was
                                                               spiked with 25 µL internal standard cocktail consisting of [D9]-
transit time. This hypothesis was built on two observa-        trimethylamine N-oxide, [13C6]-IS, and [D7]-PCS (Cambridge Iso-
tions: (a) clinically, SEV induces constipation, while SFO     tope Laboratories, Inc., Tewksbury, MA, USA). Aliquots of serum
causes transient diarrhea [15]; (b) colonic transit time im-   from each participant were combined and served as quality control

2                    Blood Purif                                                       Wang/Tapia/Tao/Chao/Thwin/Zhang/
                     DOI: 10.1159/000517470                                            Thijssen/Kotanko/Grobe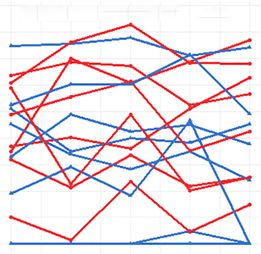
Identified patients on SEV and/or SFO in four HD clinics
                                                                  (n = 152)

                                                                                                              Did not approach due to
                                                                                                            logistic difficulties (n = 109)

                                                           Approached for informed
                                                               consent process
                                                                  (n = 43)

                                Did not consent (n = 26)                        Consented and enrolled (n = 17)
                            • Not interested (n = 23)                                    (SEV: 8, SFO: 9)
                            • On both SEV & SFO (n = 2)
                            • On other phosphate binder
                              therapy (n = 1)
                                                                                                                       Withdrawn from SFO group
                                                                                                                        due to relocation (n = 1)

                                                                                     Completed the study and
                                                                                        analyzed (n = 16)
                                                                                         (SEV: 8, SFO: 8)

                       Fig. 1. Flowchart of the cohort. SEV, sevelamer; SFO, sucroferric oxyhydroxide; HD, hemodialysis.

samples. An external standard curve for each substance of interest         and 175 V, skimmer 65 V, Oct 1 RF Vpp 750 V, VCap 4,000 V, and
quantified by liquid chromatography-mass spectrometry (LC-MS)              Nozzle Voltage 500 V for positive mode; VCap 2,000 V and Nozzle
was prepared in 4% human serum albumin. Samples were extract-              Voltage 2,000 V for negative mode. A standard curve consisting of
ed with 150 µL ice-cold methanol followed by centrifugation for            5 levels for UTOX and TRP was used to calculate accuracy and
15 min at 4,300 rpm and 4°C. The supernatant was dried down                precision for 3 quality control samples measured in triplicates at
using a centrifugal vacuum evaporator without heating and dried            low, mid, and high concentrations of UTOX and TRP.
extracts were resuspended in 0.01% formic acid and 1 mM ammo-
nium formate for LC-MS analysis.                                               Statistical Analysis
                                                                               Descriptive statistics including measures of central tendency
    Sample Analysis                                                        (mean, median) and spread (standard deviation, interquartile range)
    Serum phosphate, nutritional markers, and liver enzymes were           for continuous variables and number and frequency for categorical
analyzed using a Pentra C400 biochemistry analyzer (Horiba, Ir-            variables were compiled. For each UTOX, TRP, and routine clinical
vine, CA). UTOX and TRP levels were analyzed using a 1290 Infin-           diagnostic biomarkers, we calculated the median concentration per
ity II high-performance liquid chromatograph coupled to a 6545             participant and then the median across all participants within each
Quadrupole Time-of-Flight mass spectrometer (Agilent Technol-              group. We also reported the differences in median serum concentra-
ogies Inc., Santa Clara, CA, USA). UTOX and TRP were separated             tions between the treatment groups. A mixed-effects model was em-
on a reverse-phase column (Luna C18 4.6 × 150 mm, 3 µm, Phe-               ployed to investigate UTOX levels between different binder therapies
nomenex, Torrance, CA, USA) at a flow rate of 0.75 mL/min. The             (SEV vs. SFO) during the observational period (R Foundation for
gradient mobile phase consisted of mobile phase A (0.01% formic            Statistical Computing, Vienna, Austria).
acid and 1 mM ammonium formate in water) and mobile phase B
(0.01% formic acid and 1 mM ammonium formate in methanol).
The gradient started at 1% mobile phase B, which was changed
linearly over the next 6.5 min until reaching 40%. Over the next 1.5           Results
min, the percentage was increased linearly to 90% followed by a
linear increase to 100% over 3.5 min, where it was kept for 0.5 min.          There was no significant difference between the two
The mobile-phase composition was allowed to return to the initial          treatment groups regarding sex, age, race, body mass in-
conditions, which were held for 3 min to equilibrate the column.
The following MS parameters were used: m/z 50–1,000, gas tem-              dex, comorbidities, dialysis vintage, adherence to binder
perature 350°C, drying gas 12 L/min, nebulizer 35 psig, sheath gas         therapy, duration of phosphate binder treatment, Kt/V,
temperature 400°C, sheath gas flow 12 L/min, fragmentor 125 V              and normalized protein catabolic rate (Table 1). Pill bur-

Phosphate Binders and Uremic Toxin                                         Blood Purif                                                              3
Levels                                                                     DOI: 10.1159/000517470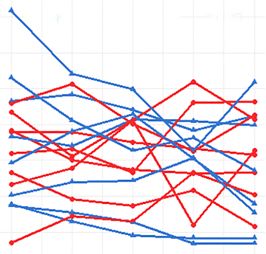
Table 1. Study participants’ characteristics

                              Characteristic                                                  Total (n = 16)     SEV (n = 8)    SFO (n = 8)

                              Female/male                                                     5/11                3/5            2/6
                              Age, years                                                      55.1±13.7          58.3±13.5      51.9±14.0
                              BMI, kg/m2                                                      27.5±5.9           27.1±7.1       27.9±4.9
                              Hemodialysis vintage, years                                      4.8±3.8            5.1±4.6        4.4±3.2
                              Equilibrated Kt/V                                               1.38±0.16          1.42±0.20      1.35±0.12
                              Duration of phosphate binder treatment, years                    2.0±1.6            3.0±1.9        1.3±0.8
                              Phosphate binder treatment adherence,* %                        77.1±34.5          66.6±25.0      87.6±40.9
                              Bowel habit satisfaction score**                                 6.3±2.6            5.5±3.5        7.1±1.5
                              nPCR, g/kg/day                                                  1.03±0.17          1.05±0.22      1.01±0.12
                              Race, n (%)
                                 White                                                            8 (50)            4 (50)         4 (50)
                                 African-American                                                 7 (44)            4 (50)         3 (37)
                                 Asian                                                            1 (6)             0 (0)          1 (13)
                              Comorbidities, n (%)
                                 Type 2 diabetes                                                 3 (19)             1 (13)         2 (25)
                                 Hypertension                                                   13 (81)             6 (75)         7 (88)
                                 Chronic heart failure                                           1 (6)              1 (13)         0 (0)
                                 Secondary hyperparathyroidism                                  16 (100)            8 (100)        8 (100)
                                 HIV                                                             3 (19)             1 (13)         2 (25)

                                  Values are mean±standard deviation or count (percentage) as appropriate. BMI, body mass index; SEV,
                              sevelamer carbonate; SFO, sucroferric oxyhydroxide; nPCR, normalized protein catabolic rate; HIV, human
                              immunodeficiency virus.
                                  * The phosphate binder treatment adherence was calculated as the percentage of the actual number (pill count)
                              to the expected number (prescription) of pills consumed.
                                                           pills taken (pill count )
                                  Adherence =                                                  ´100% .
                                              perscription (pill number expected to be taken )
                                 ** Bowel habit satisfaction on a scale of 1–10 was assessed at the time of enrollment and reported by the study
                              participants.

                                                                             den was lower in the SFO group versus the SEV group
                150
                                                                ■ SFO        (mean 2.6 vs. 6.4, respectively). Simultaneous lanthanum
                                                                ■ SEV
                                                                             carbonate intake was recorded for 1 patient in the SEV
                                                                             group. The SEV group reported a 3.3-fold higher fre-
                100                                                          quency of stool types 1 and 2 (more likely constipated,
    Frequency

                                                                             p < 0.05), whereas the SFO group reported a trend toward
                                                                             a 1.5-fold higher frequency of stool types 5–7 (more like-
                 50                                                          ly loose stool and diarrhea, not significant) (Fig. 2). When
                                                                             scoring bowel habit satisfaction on a scale from 1 (unsat-
                                                                             isfactory) to 10 (completely satisfactory), patients in the
                  0                                                          SFO group showed a trend toward higher scores than the
                      0   1      2      3      4       5   6     7           SEV group (7.1 vs. 5.5, respectively). Individual phos-
                                       Stool type
                                                                             phate levels, nutritional markers, such as normalized
                                                                             protein catabolic rate, albumin and total protein, liver
Fig. 2. Bowel movements in 16 participants over 5 weeks stratified           function markers, and total and direct bilirubin were as-
per treatment group. Stool types 1–7 were categorized according              sessed over 5 weeks (Fig. 3; Table 1). Phosphate levels did
to the Bristol Stool Scale. The number 0 is not part of the Bristol          not differ between the SEV and SFO groups (Table 2).
Stool Scale. It means an absence of a daily bowel movement. Type
1, nut-like; type 2, lumpy sausage; type 3, sausage with cracks; type        Nutritional markers, such as albumin and total protein,
4, smooth snake; type 5, soft blobs; type 6, fluffy pieces; type 7, wa-      liver function markers, and total and direct bilirubin
tery. SFO, sucroferric oxyhydroxide; SEV, sevelamer carbonate.               were not different between the 2 groups (Table 2). A total

4                             Blood Purif                                                           Wang/Tapia/Tao/Chao/Thwin/Zhang/
                              DOI: 10.1159/000517470                                                Thijssen/Kotanko/Grobe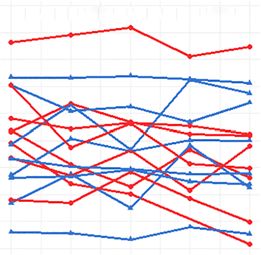
Color version available online
                                                                        SEV                                        Normal range:
                             4.5   Normal range:       p = 0.79                                                8                                   p = 0.67                      10        Normal range:      p = 0.97
                                                                                                                   6.0 – 8.3, g/dL
                                   3.4 – 5.4, g/dL                      SFO                                                                                                                2.5 – 4.5, mg/dL

                                                                                         Total protein, g/dL

                                                                                                                                                              Phosphate, mg/dL
                                                                                                                                                                                  8
    Albumin, g/dL

                             4.0                                                                               7

                                                                                                                                                                                  6
                             3.5
                                                                                                               6

                                                                                                                                                                                  4

                                   2        3          4      5          6                                         2        3         4        5          6                           2      3         4      5          6
          a                                           Week                                     b                                     Week                         c                                   Week

                         400                                                                             60                                                                      40   Normal range:           p = 0.40
                                                                                                                   Normal range:             p = 0.55                                 10 – 40, U/L
                                                                                                                   7 – 56, U/L

                         300                                                                                                                                                     30
                                    Normal range:                                                        40
                                                              p = 0.18
                                    44 – 147, U/L

                                                                                                                                                              AST, U/L
   ALP, U/L

                                                                                  ALT, U/L

                         200
                                                                                                                                                                                 20
                                                                                                         20

                         100
                                                                                                                                                                                 10

                                   2        3         4       5          6                                         2        3         4       5          6                            2      3         4      5          6
       d                                             Week                                e                                           Week                        f                                    Week

                             1.0   Normal range:                                                        0.5                                        p = 0.69
                                                                  p = 0.63
                                   0.1 – 1.2, mg/dL                                                                Normal range: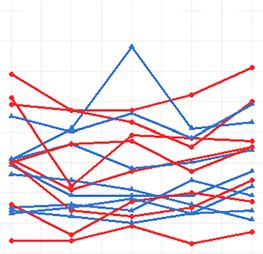
Color version available online
Normal range:
150 Normal range: SEV 20 Normal range: p = 0.87 1.5 ± 0.8, µmol/L p = 0.37
37.7 ± 20.4, µmol/L SFO 3.1 ± 1.3, µmol/L 200
p = 0.17
15
100 150
TMAO, µmol/L
PAG, µmol/L
IG, µmol/L
10
100
50
5 50
0 0 0
2 3 4 5 6 2 3 4 5 6 2 3 4 5 6
a Week b Week c Week
Normal range: Normal range: Normal range:
2.5 ± 18.9, µmol/L p = 0.37 50 1.92 ± 7.5, µmol/L p = 0.75 10.0 ± 12.4, µmol/L p = 0.75
200 200
40
150 150
CMPF, µmol/L
30
PCS, µmol/L
IS, µmol/L
100 100
20
50 10 50
0 0 0
2 3 4 5 6 2 3 4 5 6 2 3 4 5 6
d Week e Week f Week
Normal range: Normal range: Normal range:
p = 0.83 3 p = 0.68 50 p = 0.35
16.8 ± 11.2, µmol/L 0.03 ± 0.01, µmol/L 67.4 ± 10.2, µmol/L
300
40
2
KYNA, µmol/L
TRP, µmol/L
HA, µmol/L
200
30
1
100 20
0 0 10
2 3 4 5 6 2 3 4 5 6 2 3 4 5 6
g Week h Week i Week
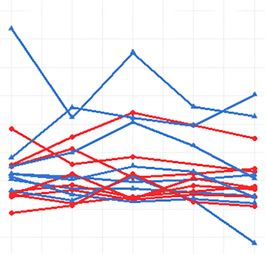
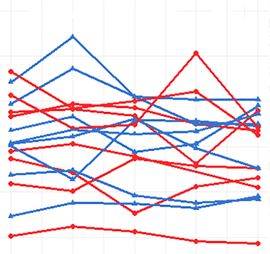
Fig. 4. Serum levels of UTOX and tryptophan in 16 participants over 5 weeks stratified per treatment group.
TMAO (a), IG (b), PAG (c), IS (d), CMPF (e), PCS (f), HA (g), KYNA (h), and TRP (i). SFO, sucroferric oxy-
hydroxide; SEV, sevelamer carbonate; TMAO, trimethylamine-N-oxide, IG, indoxyl glucuronide, PAG, phenyl-
acetylglutamine; IS, indoxyl sulfate; CMPF, 3-carboxy-4-methyl-5-propyl-2-furanpropionic acid; PCS, p-cresyl
sulfate; HA, hippuric acid; KYNA, kynurenic acid; TRP, tryptophan. Comparison between groups over time was
analyzed by a mixed-effects model. The threshold for statistical significance was set to p < 0.05.
6 Blood Purif Wang/Tapia/Tao/Chao/Thwin/Zhang/
DOI: 10.1159/000517470 Thijssen/Kotanko/Grobe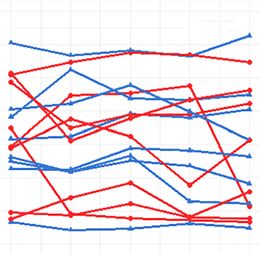
Table 2. Routine clinical diagnostic biomarkers related to nutritional status, phosphate binder therapy, and liver function

Substance               Albumin, g/dL      Total Pt, g/dL     Phosphate, mg/dL ALP, U/L              ALT, U/L      AST, U/L        B-T, mg/dL       B-D, mg/dL

Normal range             3.4–5.4            6.0–8.3            2.5–4.5                 44–147            7–56         10–40          0.1–1.2
ized by slow transit time (constipation), which may lead to           Out of the 9 substances detected by LC-MS in HD se-
production of PCS (p = 0.02) in nondiabetic nondialysis-          rum in the present study, TMAO, IG, PAG, IS, PCS, and
dependent CKD patients [26] and higher levels of total and        HA undergo metabolism in the liver before entering the
free PCS (p < 0.01) and total indole acetic acid (p = 0.04) in    systemic blood stream. The participants in our study did
patients on automatized peritoneal dialysis [27]. While the       not show any liver impairment, as three liver markers
impact of SEV and SFO on colonic transit time is well es-         were not different between the two treatment groups. At
tablished [14, 15], we cannot exclude the possibility that        the individual level, alkaline phosphatase (ALP) was in-
inherent differences in the agents themselves may affect sol-     creased in four SFO participants and one SEV participant.
ute production or intestinal uptake. Our pilot study strong-      Since ALP exists in blood in numerous distinct forms,
ly suggests that it is crucial for future trials to include de-   which originate mainly from bone and liver, slightly ele-
tailed information on microbiome composition, colonic             vated ALP may indicate a disturbance in bone mineral
metabolism, and dietary habits to understand the causal re-       metabolism [36], which is quite common in the kidney
lationship between colonic transit time and individual ure-       failure population. Consistent with previously published
mic toxin levels.                                                 literature [37, 38], the two binders SEV and SFO demon-
    Phosphate binders are also associated with gastroin-          strated equivalent control of serum phosphorus. Addi-
testinal distress, and they may bind molecules other than         tionally, we found that study participants in the SFO
phosphate and may alter the gut microbiota, altogether            group tended to be more compliant to the medication
having systemic effects unrelated to phosphate control            (87.6%) as opposed to patients in the SEV group (66.6%);
[28]. The impact of SEV on uremic toxin levels has been           this may be a result from the lower pill burden of SFO
controversial. In a large-scale (N = 423) observational           [39].
study by Dai et al. [29] comparing SEV users with nonus-              The limitations of our study are its observational na-
ers, SEV use was associated with high serum IS. Another           ture and a small sample size, which may mask the impacts
observational study found a significant reduction in the          of phosphate binder on UTOX blood levels. The evalua-
levels of PCS, not IS, after a 3-month period of SEV treat-       tions of stool consistency and bowel movements rely pri-
ment [30]. The precursor of PCS, p-cresol, was found to           marily on patient-reported information. We observed
be significantly reduced after SEV treatment in a single-         discrepancies between patient-reported medication con-
blind, randomized placebo-controlled trial with patients          sumption and actual pill count. This observation raises a
with stage 3–5 CKD (not on dialysis) [31]. In contrast,           concern about the reliability of patient-reported data and,
Brandenburg et al. [32] reported that 8 weeks of sevelam-         along with the small sample size, prevents us from con-
er hydrochloride treatment increased serum PCS but did            ducting further analysis of adjusting confounding factors.
not change serum IS levels in HD patients. Furthermore,           Similar to previously published literature by Floege et al.
in a multicenter, double-blind, placebo-controlled ran-           [15], nonadherence was slightly more common in the
domized clinical trial to evaluate the adsorptive effect of       SEV group than in the SFO group. Evaluation of fecal
SEV in stage 3b–4 CKD patients, there was no significant          specimen may give more insightful information with re-
decrease in the serum concentration of PCS, IS, and in-           gard to therapy adherence and gut microflora. However,
dole acetic acid after a 12-week course of treatment [33].        due to logistical difficulties, fecal samples were not ob-
Similarly, in a secondary analysis of the NICOREN trial,          tained during the study. Another drawback of our study
SEV did not reduce the circulating levels of protein-             is the lack of a detailed dietary assessment that would al-
bound toxins in HD patients [34].                                 low us to capture the protein-to-fiber ratio and the direct
    To date, the knowledge of the impact of SFO on UTOX           intake of UTOX precursors.
levels is limited. Only one study explored the impact of              In conclusion, there was no difference in the serum
SFO on UTOX in HD patients [35] and revealed that, de-            gut microbiome-derived UTOX levels between phos-
spite a lack of change in the diversity and composition of        phate binders (SFO vs. SEV), although SFO resulted in
the microbiome, UTOX (IS and PCS) were increased. It              fewer constipated participants. Future interventional
is important to note that the design of this and our study        studies with a larger sample size may include factors be-
is different. Iguchi et al. studied HD patients before and        yond bowel habits and their role in affecting the UTOX
after 3 months of SFO administration. In the present              levels.
study, participants were already on SFO binder therapy
for at least 4 weeks (on average 1.3 ± 0.8 years) and UTOX
levels were measured over a shorter period of 5 weeks.

8                     Blood Purif                                                     Wang/Tapia/Tao/Chao/Thwin/Zhang/
                      DOI: 10.1159/000517470                                          Thijssen/Kotanko/Grobe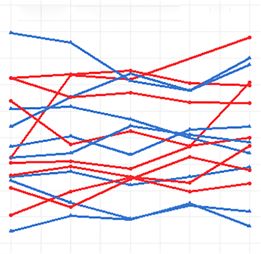
Acknowledgments                                                                    Conflict of Interest Statement

    We would like to thank Nancy Ginsberg, Sujata M. Patel, Bryan                   P.K. holds stocks and S.T. holds performance shares in Fresenius
T. Stengel, Marcella Modugno, Shannah L. Johnson, Brieana                         Medical Care. The other authors declare no competing interest.
Beach, Caroline M. Williams, and Dr. Jochen Raimann for their
contribution to the study; we also thank Dr. John Daugirdas, Uni-
versity of Illinois at Chicago, for initial discussions of the hypoth-                Funding Sources
esis. Part of the study has previously been published as an abstract
at the 2019 American Society of Nephrology Annual Meeting. The                       The study received financial support from the Renal Research
title of the presented poster was “Relationship between Phosphate                 Institute.
Binder Type and Gut Microbiome-Derived Uremic Toxin Levels
in Hemodialysis Patients.”
                                                                                      Author Contributions

   Statement of Ethics                                                                L.W. and L.M.T.S. contributed equally to this work. L.W.,
                                                                                  L.M.T.S., X.T., J.C., O.T., S.T., P.K., and N.G. contributed to the
   All study procedures were approved by Western Institutional                    design and implementation of the research. L.W., L.M.T.S., X.T.,
Review Board® (Protocol number: #20181972) and performed in                       J.C., H.Z., and N.G. analyzed the data. L.W., L.M.T.S., P.K., and
accordance with the principles of the Declaration of Helsinki.                    N.G. wrote the manuscript with input from all authors. N.G. di-
Signed written informed consent forms were obtained from all                      rected the project. All authors provided critical feedback and
participants for this study.                                                      helped shape the research, analysis, and manuscript.

   References
 1 Vanholder R, De Smet R, Glorieux G, Argilés            biota in ESRD. Am J Nephrol. 2014; 39(3):                of the iron-based phosphate binder, sucrofer-
   A, Baurmeister U, Brunet P, et al. Review on           230–7.                                                   ric oxyhydroxide, in dialysis patients.
   uremic toxins: classification, concentration,      9   Lesaffer G, De Smet R, Lameire N, Dhondt A,              Nephrol Dial Transplant. 2015 Jun; 30(6):
   and interindividual variability. Kidney Int.           Duym P, Vanholder R. Intradialytic removal               1037–46.
   2003 May;63(5):1934–43.                                of protein-bound uraemic toxins: role of sol-       17   Koiwa F, Yokoyama K, Fukagawa M, Terao A,
 2 Vanholder R, Fouque D, Glorieux G, Heine               ute characteristics and of dialyser membrane.            Akizawa T. Efficacy and safety of sucroferric
   GH, Kanbay M, Mallamaci F, et al. Clinical             Nephrol Dial Transplant. 2000 Jan; 15(1):50–             oxyhydroxide compared with sevelamer hy-
   management of the uraemic syndrome in                  7.                                                       drochloride in Japanese haemodialysis pa-
   chronic kidney disease. Lancet Diabetes En-       10   Marquez IO, Tambra S, Luo FY, Li Y, Plum-                tients with hyperphosphataemia: a random-
   docrinol. 2016 Apr;4(4):360–73.                        mer NS, Hostetter TH, et al. Contribution of             ized, open-label, multicentre, 12-week phase
 3 Kikuchi K, Itoh Y, Tateoka R, Ezawa A, Mu-             residual function to removal of protein-                 III study. Nephrology. 2017 Apr; 22(4): 293–
   rakami K, Niwa T. Metabolomic search for               bound solutes in hemodialysis. Clin J Am Soc             300.
   uremic toxins as indicators of the effect of an        Nephrol. 2011 Feb;6(2):290–6.                       18   Evenepoel P, Meijers BK, Bammens BR, Ver-
   oral sorbent AST-120 by liquid chromatogra-       11   Watanabe H, Miyamoto Y, Honda D, Tanaka                  beke K. Uremic toxins originating from co-
   phy/tandem mass spectrometry. J Chro-                  H, Wu Q, Endo M, et al. p-Cresyl sulfate                 lonic microbial metabolism. Kidney Int Sup-
   matogr B Analyt Technol Biomed Life Sci.               causes renal tubular cell damage by inducing             pl. 2009 Dec(114):S12–9.
   2010 Nov 1;878(29):2997–3002.                          oxidative stress by activation of NADPH oxi-        19   Sabatino A, Regolisti G, Brusasco I, Cabassi A,
 4 Meyer TW, Hostetter TH. Uremic solutes                 dase. Kidney Int. 2013 Apr;83(4):582–92.                 Morabito S, Fiaccadori E. Alterations of intes-
   from colon microbes. Kidney Int. 2012 May;        12   Vanholder R, Schepers E, Pletinck A, Nagler              tinal barrier and microbiota in chronic kidney
   81(10):949–54.                                         EV, Glorieux G. The uremic toxicity of indox-            disease. Nephrol Dial Transplant. 2015 Jun;
 5 Poesen R, Meijers B, Evenepoel P. The colon:           yl sulfate and p-cresyl sulfate: a systematic re-        30(6):924–33.
   an overlooked site for therapeutics in dialysis        view. J Am Soc Nephrol. 2014 Sep; 25(9):            20   Lewis SJ, Heaton KW. Stool form scale as a
   patients. Semin Dial. 2013 May–Jun; 26(3):             1897–907.                                                useful guide to intestinal transit time. Scand J
   323–32.                                           13   Vanholder R, Pletinck A, Schepers E, Glo-                Gastroenterol. 1997 Sep;32(9):920–4.
 6 Vaziri ND, Wong J, Pahl M, Piceno YM, Yuan             rieux G. Biochemical and clinical impact of         21   Dunn WB, Broadhurst D, Begley P, Zelena E,
   J, DeSantis TZ, et al. Chronic kidney disease          organic uremic retention solutes: a compre-              Francis-McIntyre S, Anderson N, et al. Proce-
   alters intestinal microbial flora. Kidney Int.         hensive update. Toxins. 2018 Jan 8;10(1):33.             dures for large-scale metabolic profiling of se-
   2013;83(2):308–15.                                14   Ikee R, Sasaki N, Yasuda T, Fukazawa S.                  rum and plasma using gas chromatography
 7 Ramezani A, Massy ZA, Meijers B, Evenepoel             Chronic kidney disease, gut dysbiosis, and               and liquid chromatography coupled to mass
   P, Vanholder R, Raj DS. Role of the gut micro-         constipation: a burdensome triplet. Microor-             spectrometry. Nat Protoc. 2011 Jun 30; 6(7):
   biome in uremia: a potential therapeutic tar-          ganisms. 2020 Nov 25;8(12):1862.                         1060–83.
   get. Am J Kidney Dis. 2016 Mar; 67(3): 483–       15   Floege J, Covic AC, Ketteler M, Rastogi A,          22   Wu MJ, Chang CS, Cheng CH, Chen CH, Lee
   98.                                                    Chong EM, Gaillard S, et al. A phase III study           WC, Hsu YH, et al. Colonic transit time in
 8 Wong J, Piceno YM, DeSantis TZ, Pahl M,                of the efficacy and safety of a novel iron-based         long-term dialysis patients. Am J Kidney Dis.
   Andersen GL, Vaziri ND. Expansion of ure-              phosphate binder in dialysis patients. Kidney            2004 Aug;44(2):322–7.
   ase- and uricase-containing, indole- and p-            Int. 2014 Sep;86(3):638–47.                         23   Tanaka H, Sirich TL, Meyer TW. Uremic sol-
   cresol-forming and contraction of short-          16   Floege J, Covic AC, Ketteler M, Mann JF, Ras-            utes produced by colon microbes. Blood Pu-
   chain fatty acid-producing intestinal micro-           togi A, Spinowitz B, et al. Long-term effects            rif. 2015;40(4):306–11.

Phosphate Binders and Uremic Toxin                                                Blood Purif                                                                    9
Levels                                                                            DOI: 10.1159/000517470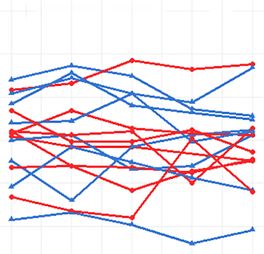
24 Roager HM, Hansen LB, Bahl MI, Frandsen            30 Lin CJ, Pan CF, Chuang CK, Liu HL, Huang          35 Iguchi A, Yamamoto S, Oda A, Tanaka K, Ka-
   HL, Carvalho V, Gøbel RJ, et al. Colonic tran-        SF, Chen HH, et al. Effects of sevelamer hy-         zama JJ, Saeki T, et al. Effect of sucroferric
   sit time is related to bacterial metabolism and       drochloride on uremic toxins serum indoxyl           oxyhydroxide on gastrointestinal microbi-
   mucosal turnover in the gut. Nat Microbiol.           sulfate and p-cresyl sulfate in hemodialysis         ome and uremic toxins in patients with
   2016 Jun 27;1(9):16093.                               patients. J Clin Med Res. 2017 Sep; 9(9): 765–       chronic kidney disease undergoing hemodi-
25 Wing MR, Patel SS, Ramezani A, Raj DS. Gut            70.                                                  alysis. Clin Exp Nephrol. 2020 Aug; 24(8):
   microbiome in chronic kidney disease. Exp          31 Riccio E, Sabbatini M, Bruzzese D, Grumetto          725–33.
   Physiol. 2016 Apr;101(4):471–7.                       L, Marchetiello C, Amicone M, et al. Plasma       36 Park JC, Kovesdy CP, Duong U, Streja E,
26 Ramos CI, Armani RG, Canziani ME, Ribeiro             p-cresol lowering effect of sevelamer in non-        Rambod M, Nissenson AR, et al. Association
   Dolenga CJ, Nakao LS, Campbell KL, et al.             dialysis CKD patients: evidence from a ran-          of serum alkaline phosphatase and bone min-
   Bowel habits and the association with uremic          domized controlled trial. Clin Exp Nephrol.          eral density in maintenance hemodialysis pa-
   toxins in non-dialysis-dependent chronic              2018 Jun;22(3):529–38.                               tients. Hemodial Int. 2010 Apr;14(2):182–92.
   kidney disease patients. J Ren Nutr. 2020 Jan;     32 Brandenburg VM, Schlieper G, Heussen N,           37 Koiwa F, Yokoyama K, Fukagawa M, Akizawa
   30(1):31–5.                                           Holzmann S, Busch B, Evenepoel P, et al. Se-         T. Long-term assessment of the safety and ef-
27 Pereira NBF, Ramos CI, de Andrade LS, Teix-           rological cardiovascular and mortality risk          ficacy of PA21 (Sucroferric Oxyhydroxide) in
   eira RR, Nakao LS, Rodrigues SD, et al. Influ-        predictors in dialysis patients receiving            Japanese hemodialysis patients with hyper-
   ence of bowel habits on gut-derived toxins in         sevelamer: a prospective study. Nephrol Dial         phosphatemia: an open-label, multicenter,
   peritoneal dialysis patients. J Nephrol. 2020         Transplant. 2010 Aug;25(8):2672–9.                   Phase III Study. J Ren Nutr. 2017 Sep; 27(5):
   Oct;33(5):1049–57.                                 33 Bennis Y, Cluet Y, Titeca-Beauport D, El Es-         346–54.
28 Biruete A, Hill Gallant KM, Lindemann SR,             per N, Ureña P, Bodeau S, et al. The effect of    38 Sprague SM, Ketteler M, Covic AC, Floege J,
   Wiese GN, Chen NX, Moe SM. Phosphate                  sevelamer on serum levels of gut-derived ure-        Rakov V, Walpen S, et al. Long-term efficacy
   binders and nonphosphate effects in the gas-          mic toxins: results from in vitro experiments        and safety of sucroferric oxyhydroxide in Af-
   trointestinal tract. J Ren Nutr. 2020 Jan;30(1):      and a multicenter, double-blind, placebo-            rican American dialysis patients. Hemodial
   4–10.                                                 controlled, randomized clinical trial. Toxins.       Int. 2018 Oct;22(4):480–91.
29 Dai L, Meijers BK, Bammens B, de Loor H,              2019 May 17;11(5):279.                            39 Gray K, Ficociello LH, Hunt AE, Mullon C,
   Schurgers LJ, Qureshi AR, et al. Sevelamer use     34 Lenglet A, Fabresse N, Taupin M, Gomila C,           Brunelli SM. Phosphate binder pill burden,
   in end-stage kidney disease (ESKD) patients           Liabeuf S, Kamel S, et al. Does the administra-      adherence, and serum phosphorus control
   associates with poor Vitamin K status and             tion of sevelamer or nicotinamide modify             among hemodialysis patients converting to
   high levels of gut-derived uremic toxins: a           uremic toxins or endotoxemia in chronic he-          sucroferric oxyhydroxide. Int J Nephrol Re-
   drug-bug interaction? Toxins. 2020 May 27;            modialysis patients? Drugs. 2019 Jun; 79(8):         novasc Dis. 2019;12:1–8.
   12(6):351.                                            855–62.

10                         Blood Purif                                                                     Wang/Tapia/Tao/Chao/Thwin/Zhang/
                           DOI: 10.1159/000517470                                                          Thijssen/Kotanko/Grobe
You can also read


