Half Year Results Presentation - 27 Weeks to 4 July 2021 - The Restaurant Group

Page created by Sam Wong
 
CONTINUE READING
Half Year Results Presentation - 27 Weeks to 4 July 2021 - The Restaurant Group
Half Year Results Presentation
27 Weeks to 4 July 2021
Half Year Results Presentation - 27 Weeks to 4 July 2021 - The Restaurant Group
Agenda

                    1.       Introduction      Andy Hornby (CEO)

                    2.       H1 2021 Results   Kirk Davis (CFO)

                    3.       Business update   Andy Hornby

                    4. Q&A                     Andy Hornby and Kirk Davis

2   2021 Half year results
Half Year Results Presentation - 27 Weeks to 4 July 2021 - The Restaurant Group
Group well positioned following restructuring and recapitalisation

                                     •   Strong LFL sales outperformance versus the market
                                     •   Trading performance since re-opening supports an
    FY21                                 increase in our FY21 EBITDA expectations
                                     •   Strengthened ESG Strategy established with clear
                                         targets

                                     •   Sector challenges around VAT normalisation, labour
                                         availability and increased inflationary cost pressures
    FY22
                                     •   Only planning on a gradual recovery in international
                                         air travel

                                     •   Four businesses all capable of delivering good
                                         sustainable shareholder returns
    Longer term                      •   Progressing well on targeted organic growth avenues
                                     •   Lower net debt and substantial liquidity

3   2021 Half year results
Half Year Results Presentation - 27 Weeks to 4 July 2021 - The Restaurant Group
Strong trading outperformance since re-opening
    LFL sales (%) vs 2019 comparable
    for the 15 weeks from 17 May to 29 August 2021
                                                                                                                                               TRG LFL         Market*
                                                                           Market* LFL
                                             TRG LFL Sales                                          Outperformance                            Sales ex VAT   LFL Sales ex
                                                                              sales
                                                                                                                                                 benefit     VAT benefit

        Wagamama                                  +21%                         +8%                         +13%                                   +9%           (4%)

         Pubs                                     +12%                         (2%)                        +14%                                   +2%          (12%)

        Leisure                                   +18%                         +8%                         +10%                                   +6%           (4%)

                                                                             Airport                                                           TRG LFL         Airport
                                             TRG LFL Sales                  passenger               Outperformance                            Sales ex VAT    passenger
                                                                             volumes                                                             benefit       volumes

        Concessions**                             (53%)                       (74%)                        +21%                                  (65%)          (74%)

    *Market refers to Coffer Peach tracker for restaurants (Wagamama and Leisure benchmark), Coffer Peach tracker for pub restaurants (TRG Pubs benchmark)
     Coffer peach LFL sales represent the weighted average of weekly LFL sales reported (internal calculation)

    ** UK air passenger growth used as market benchmark for Concessions

4         2021 Half year results
Half Year Results Presentation - 27 Weeks to 4 July 2021 - The Restaurant Group
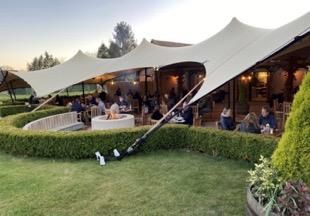
Ongoing sector challenges to navigate in FY22
1                                                                                                            2
    Dine-in customer volumes under pressure                                                                    Labour market pressures

    •     LFL’s supported by VAT reduction which is expected to                                                •    Significant pressure on labour availability resulting in
          normalise in April 2022                                                                                   rising costs

    •     Delivery sales mix remains elevated                                                                  •    Expecting an above inflationary rise in NLW from April
                                                                                                                    2022

3                                                                                                          4
    Increasing inflationary pressures                                                                          International travel recovering slowly

                                                                                                               Airport passenger volumes by month* (vs 2019 comparable)

    •     General food and drink cost inflation due to commodity
          markets and distribution pressures

    •     Material market driven increases in utility costs                                                                                                           -73%
                                                                                                                                                                                             -65%
                                                                                                                        -87%                   -85%
                                                                                                                          P5                     P6                     P7                     P8

    * P5 refers to the period of 2 weeks to 30 May 2021; P6 refers to the period of 5 weeks to 4 July 2021; P7 refers to the period of 4 weeks to 1 August 2021, P8 refers to the period of 4 weeks to 29 August
    2021

5          2021 Half year results
Half Year Results Presentation - 27 Weeks to 4 July 2021 - The Restaurant Group
However evolving market conditions present TRG with good opportunities
         21% capacity reduction in locations where we trade since the
                                                                                                                    Strong growth in delivery market forecast to continue
                                  pandemic

     No. of food and drink sites in close proximity* to our sites**                                           UK delivered foodservice market (£’bn)
                                                  -21%

          34,194              1,160              1,242                                                                                                                          12.6
                                                                                                                                                           +20%

                                                                                                                                                            11.3
                                                                                                                              +36%

                                                                     5,913                                                               10.5

                                                                                       28,199

                                                                                                                      7.7

       As at Mar-20         New sites         Temporary          Permanent As at Aug -21                             2019               2021                2022               2024
                                               closures           closures

      Source: HDI Insights (Credit card transactions analysis)                                               Source: Lumina Intelligence (MCA) Food service delivery report (2021)

    *Within 0.5 miles of each location for Wagamama and Leisure sites and within 5 miles for each Pub site
    **Relates to 355 sites excluding Concession sites

6           2021 Half year results
Half Year Results Presentation - 27 Weeks to 4 July 2021 - The Restaurant Group
Restructured and recapitalised group outperforming the market

• Strong LFL sales outperformance versus the market

• Trading performance since re-opening supports an increase in our FY21 EBITDA
  expectations

• Ongoing sector challenges to navigate through FY22

• Lower net debt and substantial liquidity

7   2021 Half year results
Half Year Results Presentation - 27 Weeks to 4 July 2021 - The Restaurant Group
H1 2021 Results

2021 Half year results

8
Half Year Results Presentation - 27 Weeks to 4 July 2021 - The Restaurant Group
Group financial summary

                                                       2021 HY            2020 HY             2021 HY            2020 HY
                                                          £m                 £m                  £m                 £m
              Column1
                                                       (IFRS 16)          (IFRS 16)           (IAS 17)           (IAS 17)

              Revenue                                    216.8              227.2               216.8                 227.2

              EBITDAR*                                    28.1               21.2                30.1                 16.7

              EBITDA*                                     23.6               18.9                11.2                 (18.3)

              EBITDA margin %*                          10.9%                8.3%               5.2%                  -8.1%

              LBIT / Operating (loss)*                   (18.6)             (41.3)              (8.6)                 (38.9)

              Operating margin %*                        -8.6%             -18.2%              -4.0%              -17.1%

              (LBT)/Loss before tax*                     (39.5)             (62.6)              (19.9)                (47.5)

              (Loss) per share*                          (4.7)p            (11.2)p               n/a                   n/a
              * Adjusted (pre-exceptional charges)

    • Q1 2021 (whilst in lockdown): £60.1m of Revenue and an EBITDA loss (on an IAS 17 basis) of £18.1m
    • H1 EBITDA loss (on an IAS 17 basis) of £6.5m, if exclude business rates relief and government grants benefits

9        2021 Half year results
Half Year Results Presentation - 27 Weeks to 4 July 2021 - The Restaurant Group
Group cash flow
                                                    2021 HY         2020 HY
                                                       £m              £m
                                                                                             Commentary
Column1                                           (Pre IFRS 16)   (Pre IFRS 16)   Analytical review:
Adjusted* EBITDA (IAS 17 basis)                       11.2           (18.3)
     Working capital and non-cash adjustments         2.6            (10.1)       – Improved EBITDA and working
                                                                                    capital performance
Operating cashflow                                    13.8           (28.4)
     Net interest paid                               (14.3)           (7.7)       – Net proceeds of £166.8m from
     Tax paid                                         (0.2)           (2.8)
                                                                                    March 21 capital raise
     Refurbishment and maintenance capital
                                                      (6.7)          (10.6)
     expenditure                                                                  – Net debt (on an IAS 17 basis)
Free cash flow                                       (7.4)           (49.5)         reduced by £108m to £200.3m
     Development capital expenditure                 (5.3)           (14.4)
     Utilisation of onerous lease provisions         (3.4)           (10.2)       – Deferred Covid liabilities of c.£25m
     Exceptional costs                               (7.6)            (6.5)         on the balance sheet as at the half-
     Proceeds from issue of share capital            166.8            54.6          year
     Other items                                       -               2.4
Cash movement                                        143.2           (23.6)       IFRS 16:
Group net debt at start of period                   (340.4)         (286.6)
     Derecognition of finance lease liabilities                                   – IFRS 16 Lease liabilities reduced
                                                       -              2.6           from £483.8m at year-end to
     (IFRS16 transition)
Non-cash movement in net debt                        (3.1)           (0.7)          £434.7m
Group net debt at end of period (IAS 17 basis)      (200.3)         (308.3)
Lease liabilities (IFRS 16 basis)                   (434.7)         (829.8)
                                                                                  – No impact on cash or banking
Group net debt at end of period (IFRS 16 basis)     (635.0)        (1,138.1)        arrangements
* (pre-exceptional charge)

10    2021 Half year results
Lower net debt with substantial liquidity

                                     Debt facility overview                                         Commentary

                                                                                • £450m of long-term debt facilities:
       (£’m)
                                      YE 2020                         HY 2021
                                                                                  – £330m term loan maturing in Q2 2026 with no
                                                                                    amortisation
       High Yield
       Bond
                                          225                            -        – £120m RCF maturing in Q2 2025

       Banking
                                          245                           120     • Flexibility in term-loan structure
       Facilities
                                                                                  – Facilities have a leverage-based margin ratchet –
       Term Loan                            -                           330         decreasing our cost of debt as leverage
                                                                                    decreases
                                                                                  – Term loan offers significant prepayment
       Total                              470                           450
                                                                                    flexibility in line with our plans to reduce leverage

                                                                                • Significant cash headroom
       Net Debt*                         c.340                         c.200

                                                                                • Continue to target Net Debt to EBITDA*** (IAS
       Headroom**                        c.130                         c.235      17) below 1.5 times in the medium term

 * Net debt includes unamortised loan fees
 **Current facilities subject to minimum liquidity covenant of £40m
 *** Pre exceptional charges

11      2021 Half year results
Selected FY21 Guidance

     •   P&L benefit of one-off government support
          – £12.4m in business rates relief and £10.7m in government grants

     •   Total capital expenditure expected to be up to £45m
          – 5 new Wagamama restaurants
          – 5 new delivery kitchens in the UK
          – 2 new Wagamama sites in the US as part of the JV*
          – 1 new freehold Pub
          – Maintenance and IT investment of £20m and Refurbishment capex of £8m

     •   11 Leisure sites closed since March 21, which contributed £2.5m of annualised EBITDA in 2019**

     •   Seeking to reduce risk of further Leisure site closures due to landlord CVA break clauses in June 22

 *20% capex contribution to the sites
 ** Based on 2019 outlet EBITDA

12       2021 Half year results
Business update

2021 Half year results

13
Wagamama: Consistently strong market outperformance

                           LFL sales growth since reopening                                                                             Clear market outperformance

 LFL Sales by month* (vs 2019 comparable)                                                                  YTD LFL Sales ( 15 weeks to 29th August) vs market (vs 2019 comparable)
                                                                             +25%                                                           +21%
                               +23%
        +17%                                          +17%
                                                                                                                                                                               +13%
                                                                                                                                                                    +8%

          P5                     P6                     P7                     P8                                                       Wagamama              Coffer Peach
                                                                                                                                                               Restaurant
                              Includes VAT benefit of c.12%

                           Further improving customer offer                                                                                  Increased delivery mix

                                                                                                           Channel Mix – P7+P8 2019 vs 2021
                                                                                                                                                                                            LFL % (y-o-y)
                                                                                                                  Delivery          11%
                                                                                                                  Takeout            3%                     22%       Delivery                  +146%

                                                                                                                                                             6%       Takeout                   +90%
                                                                                                                     Eat in         86%
         Expansion of vegan range
                                                                                                                                                            72%         Eat in                   +2%
                                                     12 targeted light-touch refurbishments
     Launch of healthy summer range
                                                                                                                               2019 P7+P8              2021 P7+P8
 * P5 refers to the period of 2 weeks to 30 May 2021; P6 refers to the period of 5 weeks to 4 July 2021; P7 refers to the period of 4 weeks to 1 August 2021, P8 refers to the period of 4 weeks to 29 August
 2021

14      2021 Half year results
Pubs: Strong outperformance vs market continues

                           LFL sales growth since reopening                                                                             Clear market outperformance

 LFL Sales by month* (vs 2019 comparable)                                                                  YTD LFL Sales ( 15 weeks to 29th August) vs market (vs 2019 comparable)
        +20%
                                                                                                                                           +12%
                               +14%                                          +15%

                                                       +4%                                                                                                                        +14%

          P5                     P6                     P7                     P8                                                                                     -2%
                                                                                                                                           Pubs              Coffer Peach Pub
                        Includes VAT benefit of c.10%                                                                                                          Restaurant

                                                                                     Key operational initiatives

                                                                                                                                                 More flexible working arrangements for
                              Stretch tents                                              Investment in rooms                                                     teams

 * P5 refers to the period of 2 weeks to 30 May 2021; P6 refers to the period of 5 weeks to 4 July 2021; P7 refers to the period of 4 weeks to 1 August 2021, P8 refers to the period of 4 weeks to 29 August
 2021

15      2021 Half year results
Leisure: Very encouraging market outperformance

                           LFL sales growth since reopening                                                                             Clear market outperformance

 LFL Sales by month* (vs 2019 comparable)                                                                  YTD LFL Sales ( 15 weeks to 29th August) vs market (vs 2019 comparable)
                                                                             +28%                                                            +18%

                               +16%                                                                                                                                            +10%
        +12%                                          +11%                                                                                                          +8%

          P5                     P6                     P7                     P8                                                          Leisure            Coffer Peach
                                                                                                                                                               Restaurant
                              Includes VAT benefit of c.12%

                           Further improving customer offer                                                                                  Increased delivery mix

                                                                                                           Channel Mix – P7+P8 2019 vs 2021
                                                                                                                                                                                            LFL % (y-o-y)
                                                                                                                  Delivery              4%
                                                                                                                                 0%
                                                                                                                  Takeout                                             Delivery                 +465%
                                                                                                                                                            15%

                                                                                                                     Eat in         96%                               Takeout                   +53%
                                                                                                                                                             1%
                                                                                                                                                            84%         Eat in                   +5%
     Investment in food               Increased virtual brand               Improved customer
                                                                                                                               2019 P7+P8              2021 P7+P8
           quality                           presence                          insight tools

 * P5 refers to the period of 2 weeks to 30 May 2021; P6 refers to the period of 5 weeks to 4 July 2021; P7 refers to the period of 4 weeks to 1 August 2021, P8 refers to the period of 4 weeks to 29 August
 2021

16      2021 Half year results
Concessions: Disciplined reopening programme as international travel recovers

        Individual site reopening programme focussing on EBITDA delivery                                                      YTD Market Comparison ( 15 weeks to 29th August)

 Number of trading sites by month*                                                                             YTD LFL Sales vs market (vs 2019 comparable)

                                                                                   21
                                                            18

               7                      8                                                                                                             -53%                                              +21%
                                                                                                                                                                                -74%
                                                                                                                                               Concessions              Airport passenger
              P5                     P6                     P7                     P8                                                                                       volumes
                      21 sites represent c.50% of Concessions estate                                                                             Includes VAT benefit of c.12%
 •         Measured reopening programme focussing on EBITDA delivery
                                                       Operational update

 •         More flexible terms agreed with most airport partners regarding Minimum Guaranteed Rents
 •         Trading significantly ahead of passenger volume declines, benefitting from:
               o     Lower VAT rate
               o     Limited competition operating
               o     Longer dwell times for passengers driving improved spend per head
 •         Only planning on a gradual improvement in airport passenger volumes through 2022 and 2023

     * P5 refers to the period of 2 weeks to 30 May 2021; P6 refers to the period of 5 weeks to 4 July 2021; P7 refers to the period of 4 weeks to 1 August 2021, P8 refers to the period of 4 weeks to 29 August
     2021

17          2021 Half year results
Progressing well on targeted organic growth avenues

                                                   Existing                                                                           2022-2026
                                                                               Roll-out                     2021 new                                               Historical
                                                    estate                                                                            target run-
                                                                               potential                    openings                                                ROIC*
                                                                                                                                       rate p.a

          Wagamama UK
           restaurants                                 144                       180-200                           5                        5-7                       >40%

         Wagamama UK                                                               20-30                         4-5                        5-7
                                                         7                                                                                                             >75%
         delivery kitchens

                  Pubs                                  78                       140-160                           1                        3-5                      >25%**

                                              •     3-4 new US sites due to open in FY22 under JV partnership
             Wagamama
            International                     •     At least 5 new international franchise sites due to open in FY22

     *ROIC refers to return on invested capital defined by 2019 outlet EBITDA/initial capex invested, earned by sites opened from 2015-2017 except for Wagamama delivery kitchens
     ** EBITDA assumed on leasehold basis at 6% interest on freehold component of investment

18        2021 Half year results
Strengthening our ESG Strategy: “Preserving The Future”

                                                Preserving the Future

                            Environmental                                      Social

                                                                                                Foster a
                                                                                            representative,
     Achieve Net Zero Carbon           Enhance existing       Care for our   Care for our
                                                                                              diverse and
        Emissions by 2035            sustainable practices   communities     colleagues
                                                                                               inclusive
                                                                                             environment

                                 Underpinned by strong governance framework

19     2021 Half year results
Strengthening our ESG Strategy: Environmental initiatives
                                                                                               Activity

         • Founding member of hospitality
                   industry body                                                    All direct* energy supplies from                Investing in carbon removal
         • On the advisory board & co-chair                                       renewable sources from October 21               reforestation projects in FY2022
            of emissions working groups

        • Reducing food waste with the SRA’s                                       • New Wagamama, lower plastic                 • Wagamama menu 50% vegan &
                 ‘Bad Taste’ project                                                packaging content range from Q2                 vegetarian by the end of 2021
                                                                                                 2022
         • Donated c.4,000 food bags through                                                                                     • Frankie & Benny's launching new
            the ‘Too Good to Go’ food waste                                       • Trialling a ‘Bowl Return Scheme’                 healthier children’s menu with
                       initiative                                                                                                 increased vegetarian options in Oct
                                                                                                                                                    21
     * Includes electricity, gas & LPG. Where we control the specific supply point for contracting. Excludes landlord supplies

20        2021 Half year results
Strengthening our ESG Strategy: Social initiatives
                                                      Activity

       • Donating all profits from
     Wagamama’s retail range and book                                            • Apprenticeships expected to double
        launches to Young Minds                                                            in 2022 to over 350
                                            • Trustee of homelessness charity
     • Variety of employee fundraising       • Supporting with employment        • Provides qualifications equivalent to
        activities to support charity            opportunities and training           GCSE through to Degree level
                   partners

         Partnership with a specialist       Improved colleague training and
      hospitality focused mental health        development tools providing            Multiple courses underway to
      organisation delivering training to   professional support for our teams        support Diversity & Inclusion
                  colleagues                                                                    initiatives

21     2021 Half year results
Restructured and recapitalised group outperforming the market

• Strong LFL sales outperformance versus the market

• Trading performance since re-opening supports an increase in our FY21 EBITDA
  expectations

• Ongoing sector challenges to navigate through FY22

• ESG Strategy established with clear targets

• Lower net debt and substantial liquidity provides ability for targeted organic growth
  opportunities

22   2021 Half year results
Appendices

2021 Half year results

23
IFRS 16 P&L reconciliation

                                   Trading         IFRS 16          IFRS 16     Non-cash rent                       Trading
                                                                                                   Fixed rent
                                    IAS 17       Depreciation      Interest        items                            IFRS 16
we                                                                                                     £m
                                      £m             £m               £m             £'m                               £m
Revenue                              216.8            -                -              -               -               216.8
     Operating costs*               (205.6)                            -            (6.6)            19.0            (193.2)
EBITDA*                               11.2            -                -            (6.6)            19.0              23.6
     Depreciation, amortisation
                                      (19.9)        (22.3)            -               -                -             (42.2)
     and impairment*
LBIT / Operating (loss)*               (8.6)        (22.3)             -             (6.6)           19.0            (18.6)
     Interest payable*                (11.3)          -              (9.5)             -              -              (20.8)
(LBT)/Loss before tax*                (19.9)        (22.3)           (9.5)           (6.6)           19.0            (39.5)
* Adjusted (pre-exceptional charge)

 • H1 Fixed rent under IAS 17 is significantly reduced due to Covid related rent deals obtained from landlords and airports
 • H1 Depreciation and interest under IFRS 16 is higher than ongoing run-rate due to the completion of some airport
   concession rent deals during the first half
 • Non-cash rent related charge under IFRS 16 is due to the reversal of onerous lease provisions, made under IAS 17

 • Once Covid related rent deals expire and onerous lease provisions unwind, we expect IFRS16 and IAS17 PBT to be
   broadly similar

24    2021 Half year results
IFRS 16 Balance sheet Reconciliation
                                                                              IFRS 16
                                                                  IAS 17    Adjustments   IFRS 16
                              we                                    £m           £m         £m
                              Non-current assets                   888.0       312.6      1,200.6
                                  Intangible assets                599.0          -        599.0
                                  Right of use assets                 -        302.4       302.4
                                  Property, plant and equipment    288.5         7.8       296.3
                                  Net investment in subleases         -          2.9         2.9
                                  Fair value lease assets            0.5        (0.5)         -
                              Current assets                       159.1        (8.8)      150.3
                                  Stock                              5.1          -          5.1
                                  Trade and other receivables       13.4        (1.4)       12.1
                                  Net investment in subleases         -          0.7         0.7
                                  Corporation tax assets            12.6          -         12.6
                                  Prepayments                       12.2        (8.1)        4.0
                                  Cash and cash equivalents        115.8          -        115.8
                              Total assets                        1,047.1      303.8      1,351.0

                              Current liabilities                 (152.9)      (38.3)     (191.2)
                                  Trade and other payables*       (141.4)       30.7      (110.7)
                                  Provisions                       (11.5)        6.4        (5.1)
                                  Lease liabilities                   -        (75.4)      (75.4)
                              Non-current liabilities             (416.5)     (319.0)     (735.5)
                                  Long-term borrowings            (316.0)         -       (316.0)
                                  Non-current lease liabilities       -       (359.3)     (359.3)
                                  Other payables                   (13.6)       13.6          -
                                  Deferred tax liabilities         (50.3)         -        (50.3)
                                  Provisions                       (30.0)       20.2        (9.9)
                                  Fair value lease liabilities      (6.6)        6.6         0.0
                              Total liabilities                   (569.5)     (357.3)     (926.8)

                              Net assets                          477.6        (53.5)     424.1

25   2021 Half year results
Estate mix

                              Estate at   Openings   Closures   Estate at
                              27/12/20                          14/09/21
Column1
Wagamama UK                     142          2          -         144

Frankie & Benny's               106          -         (10)        96

Pub Restaurants                  78          -          -          78

Concessions                      43          2         (3)         42

Chiquito                         22          -          -          22

Other Leisure Brands             9           -         (1)         8

Wagamama Delivery kitchens       5           2          -          7

Total TRG                       405          6         (14)       397

26   2021 Half year results
You can also read