Hazard perception test development for Lithuanian drivers
←
→
Page content transcription
If your browser does not render page correctly, please read the page content below

Hazard perception test development for Lithuanian drivers

Downloaded from: https://research.chalmers.se, 2021-12-10 04:47 UTC

     Citation for the original published paper (version of record):
     Tuske, V., Seibokaite, L., Endriulaitiene, A. et al (2019)
     Hazard perception test development for Lithuanian drivers
     IATSS Research, 43(2): 108-113
     http://dx.doi.org/10.1016/j.iatssr.2018.10.001

N.B. When citing this work, cite the original published paper.

research.chalmers.se offers the possibility of retrieving research publications produced at Chalmers University of Technology.
It covers all kind of research output: articles, dissertations, conference papers, reports etc. since 2004.
research.chalmers.se is administrated and maintained by Chalmers Library

                                           (article starts on next page)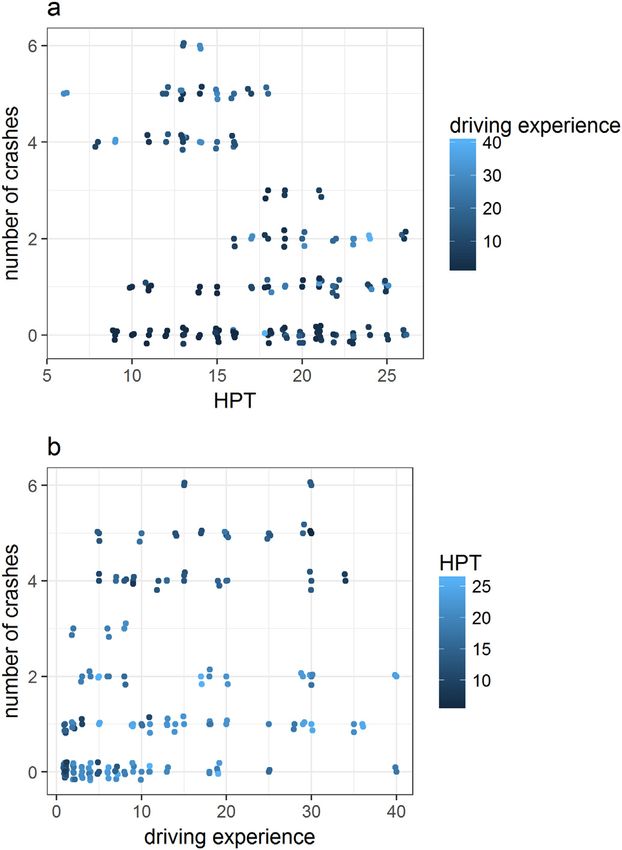
IATSS Research 43 (2019) 108–113

                                                                     Contents lists available at ScienceDirect

                                                                              IATSS Research

Research Article

Hazard perception test development for Lithuanian drivers
Vaida Tūskė a, Laura Šeibokaitė a,⁎, Auksė Endriulaitienė a, Esko Lehtonen b
a
    Vytautas Magnus University, Lithuania
b
    Chalmers University of Technology, Sweden

a r t i c l e            i n f o                            a b s t r a c t

Article history:                                            Hazard perception tests may not be transferable between different countries, due to differences in traffic culture
Received 1 December 2017                                    and infrastructure. Therefore, different instruments might be necessary for assessing hazard perception in vari-
Received in revised form 30 August 2018                     ous countries. The aim of the current study was to develop the Lithuanian hazard perception test based on static
Accepted 5 October 2018
                                                            traffic images and test its psychometric properties. Thirty-four experienced drivers participated in a pilot study,
Available online 17 October 2018
                                                            and 125 drivers with diverse driving experience took part in the main study. The final test contained 27 static
Keywords:
                                                            traffic scenes and the participants were asked to respond if they saw a hazard or not. Results demonstrated
Hazard perception test                                      that the test has satisfactory internal consistency and test-retest reliability. It differentiated between inexperi-
Drivers                                                     enced and experienced drivers, and between those experienced drivers who had less than three or more than
Validity                                                    three crashes in their driving history. The test has sufficient psychometric properties for research; still further
Internal consistency                                        development is needed in order to apply it for individual testing and decisions about licence provision.
Test-retest                                                   © 2018 International Association of Traffic and Safety Sciences. Production and hosting by Elsevier Ltd. This is an
                                                                     open access article under the CC BY-NC-ND license (http://creativecommons.org/licenses/by-nc-nd/4.0/).

1. Introduction                                                                                be of great value in traffic safety promotion as it is thought to be rela-
                                                                                               tively easily influenced during training [16–18].
    Road traffic crashes remain serious public health concern all over the                          Hazard perception is defined as ability to perceive, anticipate and re-
world because of 1.25 million of deaths each year [1]. Within the EU,                          spond to situations in traffic which have a high probability to lead to a
Lithuania takes the fourth highest place by road crash mortality rates                         crash (e.g. Crundall et al. [19]). This ability is related to driving experi-
[2]. This country might be described by some disadvantages in road traf-                       ence, but it is also influenced by age, cognitive functions, and physiolog-
fic system: significant fluctuations of mortality and injury rates in the                         ical responses [16,20–22]. Hazard perception tests have been developed
last decade that are difficult to explain; non-persistent policy in safety                      for testing this skill, and some countries (like UK, Netherlands, and
management; old car fleet; no graduate driving licensing; high share                            Australia) have included it in driver's licensing [6,23,24]. European
of alcohol-related road fatalities; poor attitudes of inh,abitants towards                     Union Directive (Directive 91/439/EEC on driving licenses) recom-
investments into road safety [2–5].                                                            mends using hazard perception measurement in driver training and
    Despite successful investments into the traffic since its membership                        testing [25]. Unfortunately, there is no appropriate tool to deal with haz-
in the EU by 2007, additional efforts to enhance road safety in Lithuania                      ard perception testing in Lithuania.
are thus needed. Researchers and practitioners worldwide acknowledge                               There are some doubts if hazard perception tests are transferable be-
the need of evidence based on modern psychological or educational                              tween different countries, due to differences in legislations, traffic cul-
means that would enhance safe behaviour on the road [6,7]. In this                             ture, and infrastructure [26,27]. Despite the traffic legislation is rather
study, we present the Lithuanian version of a hazard perception test,                          consistent across European countries, including Lithuania (e.g. EU
which could be one of the tools for improving road safety.                                     Directive 2008/96/EC), research data suggested that differences in traf-
    Many psychological factors are reported as having influence upon                            fic safety perception and driving behaviour are more a cultural or infra-
road safety. Some of these are transient like driver distraction while                         structural issue. When comparing driving behaviour across 41 countries
talking to a mobile phone [8,9], whereas some more or less stable prop-                        from all over the world, it was found that traffic violations were related
erties of the individual, like sensation-seeking, attitudes or driving skills                  to the developmental status of the country [28]. Differences in road traf-
[10–12]. Among these, hazard perception is acknowledged as an impor-                           fic risk perceptions were disclosed in the samples of inhabitants from
tant factor contributing to crash involvement [13–15]. This ability might                      Norway, Russia, and India [29]. Similarly, empirical data showed that
                                                                                               behavioural situations can be interpreted differently even in the coun-
                                                                                               tries from same geographical region [30]. Cultural differences can influ-
  ⁎ Corresponding author at: Vytautas Magnus University, Jonavos str. 66-330, Kaunas
LT-44191, Lithuania.                                                                           ence what is seen as normal or acceptable behaviour, and thus change
    E-mail address: laura.seibokaite@vdu.lt (L. Šeibokaitė).                                   the drivers' interpretation of the situation. Differences in perception of
Peer review under responsibility of International Association of Traffic and Safety Sciences.   traffic safety climate were obtained in young drivers' samples in

https://doi.org/10.1016/j.iatssr.2018.10.001
0386-1112/© 2018 International Association of Traffic and Safety Sciences. Production and hosting by Elsevier Ltd. This is an open access article under the CC BY-NC-ND license (http://
creativecommons.org/licenses/by-nc-nd/4.0/).
V. Tūskė et al. / IATSS Research 43 (2019) 108–113                                                               109

Lithuania, Turkey, and Germany [31]. Lesch, Rau, Zhao, Liu [32] and Lim            2.2. Materials, apparatus and test construction
et al. [27,33] revealed that hazard is perceived not equally across cul-
tures with different thresholds for what constitutes a hazard, therefore               The development of the Lithuanian Hazard perception test (HPT-
different instrument might be necessary for assessing hazard percep-               LIT) was conducted in a series of stages: description of the situations
tion in developed and developing countries. Consequently, common                   and hazard types to be represented in the test; collecting photos with
practice in the field is to create country-specific measurement tools                diverse traffic scenes; expert evaluations of images to be included in
based on the assumption that methodology itself is cross-culturally                the tool; pilot study of the face and content validity of the hazard per-
transferable, whereas, the road environment familiarity should be                  ception test. The intention was to design a short, convenient, cost effi-
sustained.                                                                         cient and user-friendly tool.
    Several types of hazard perception tests are employed worldwide.                   First, detailed driving scenarios were prepared based on the litera-
Video-based series of dynamic roadway scenes are frequently used in                ture [36,44,46] and driving legislation in Lithuania. The scenarios in-
many hazard perception tests [26,34,35]. Still images are another widely           volved different traffic participants (vehicles, pedestrians, cyclers, etc.)
used way to assess hazard perception [36,37]. The performance in a                 and potential hazards (Table 1). Potential traffic hazards were defined
driving simulator is perceived as an indicator of hazard perception                to be situations in which the driver must take some unplanned evasive
as well [38,39]. Also, self-reports have been used [36,40]. Scialfa                action to avoid the hazard (usually a collision).
et al. [36] reported some advantages of using still images, like                       Typical circumstances of traffic conditions in Lithuania were consid-
unambiguousness of stimuli, lower cost of development and adminis-                 ered when preparing stimulus for the test in order to develop the new
tration, efficiency in time and stimuli number, etc. Based on this,                 nationally valid instrument. There is a right-hand traffic in Lithuania;
computer-presented still images were chosen for Lithuanian version                 therefore, all pictures were taken from driving in the right lane perspec-
of hazard perception test.                                                         tive. Traffic is less intensive due to lower number of population (less
    The validation of tests is based on an assumption that a good test             than three million inhabitants), less-crowded and smaller towns (the
produces results predicted by the underlying theory. First, a hazard per-          largest town has c. 550 thousand inhabitants) when compared with
ception test should differentiate between inexperienced and experi-                other European countries [47]. Despite increasing investments into traf-
enced drivers, because hazard perception is a learned skill [36,40].               fic infrastructure, the technical quality of urban and rural roads is still
Second, a hazard perception test should be able to identify drivers                quite unsatisfactory. Road deficiencies and traffic intensity are seen
with a high and low crash involvement, because good hazard percep-                 clearly in test materials. Also, specific types of public transport may be
tion skills should decrease crash risk [41].                                       recognized. Only buses and trolleybuses are available for public travel-
    The aim of the current study was to develop the Lithuanian hazard              ling, no trams or trains are operating in the towns. Weather conditions
perception test, which does not currently exist, based on static traffic            typical to Lithuanian climate are captured in pictures. There are about
images and test its criteria and construct validity and psychometric               38% of rainy and cloudy days per year in Lithuania. Heavy rain and
properties (internal consistency and test-retest reliability) among                snow was avoided in stimulus to exclude weather conditions as primary
Lithuanian drivers. Based on previous literature it was expected that              hazard, focusing more on objects and traffic participants. Low light is
driving experience [35,42–44] and having no history of crashes [26,41]             used as a context of driving situation at least in a half of images. Finally,
were positively related to hazard perception abilities, and there would            most prevalent crash types were considered when developing the HPT-
be no gender differences in hazard perception [17,45].                             LIT test. Eighty-two percent of people killed in road crashes are pedes-
                                                                                   trians and car occupants in Lithuania and this rate is significantly higher
                                                                                   than in other countries that have developed and adopted hazard per-
2. Method                                                                          ception tests, like UK and the Netherlands [47]. Because bicycling is
                                                                                   not very common in Lithuania, less images with bicyclist operating on
2.1. Participants

                                                                                   Table 1
    The study used a convenience sample of 159 drivers in total.
                                                                                   A list of driving scenarios for hazard perception test.
Thirty-four experienced drivers (driving experience more than two
years when full licence is acquired; 23 males, 11 females; age M =                   Scenarios                                                              Number of
                                                                                                                                                            scenes
37.03 years, SD = 13.84) participated in the pilot stage where
                                                                                                                                                            included
face and content validity of the developed hazard perception
test was examined. One hundred twenty-five drivers (70 males, 55                      In the distance of 25–45 m vehicle in front is turning right           2
                                                                                     In the distance of 25–45 m vehicle in front is turning left            2
females; age M = 31.89 years, SD = 12.15; driving experience                         In the distance of 25–45 m vehicle in front is breaking                2
M = 11.49 years, SD = 10.45) participated in the main study. They                    In the distance of 25–45 m vehicle in front is parking                 2
were recruited via advertisements or personal invitations from differ-               In the distance of 25–45 m vehicle in front is merging into the lane   2
ent areas of Lithuania, although Kaunas region (the second largest city                of observer
                                                                                     In the distance of 25–45 m vehicle from the opposite lane is           4
of Lithuania) was mostly represented in the sample. Three groups of
                                                                                       turning left
drivers were classified when analysing the results: 32 novice drivers                 In the distance of 25–45 m vehicle is approaching observer's           1
(14 males, 18 females; less than two years of driving experience),                     vehicle head-on
65 experienced drivers having two or less crashes in driving history                 In the distance of 25–45 m pedestrian is crossing or about to cross    4
(37 males, 28 females; driving experience M = 13.88 years, SD =                        the street at the zebra
                                                                                     In the distance of 25–45 m pedestrian is crossing the street at the    2
10.26), and 28 experienced drivers with the record of more than                        carriageway
three traffic crashes based on self-report (19 males, nine females;                   In the distance of 25–45 m vehicle is parked at the roadside           1
driving experience M = 17.54 years, SD = 8.86). Part of this sample                  In the distance of 25–45 m bicyclist is driving in observer's lane     1
(30 drivers, 18 males, and 12 females) participated in the test-retest               In the distance of 25–45 m the road construction is proceeding         1
                                                                                     In the distance of 25–45 m the object is left on the road              1
study with the interval of three weeks between tests. No statistically
                                                                                     In the distance of 25–45 m vehicle in first lane is turning right,      1
significant differences in gender, age or driving experience in this re-                while observer is going in the second lane (no hazard)
test sub-sample were found when compared to the rest of the                          In the distance of 25–45 m vehicle from opposite lane is turning       1
participants.                                                                          right (no hazard)
    Oral informed consent was obtained from each participant and no                  In the distance of 100–150 m vehicle is merging from the right         1
                                                                                       bystreet in the town (no hazard)
reward for participation was offered.
110                                                              V. Tūskė et al. / IATSS Research 43 (2019) 108–113

the road were included, more attention on pedestrians' participation in                      a positive answer, they were asked to describe the hazard in more
the traffic was paid. These characteristics impacted the currents study's                     detail.
method putting efforts in making the stimuli as familiar for participants                       Thirty-four experienced drivers in the pilot study were asked to
as possible. It is assumed that familiarity of environment can influence                      evaluate the potential hazard in each photo. They were presented
the judgement of hazard [32].                                                                with such instruction: “These photos present different traffic scenes.
     Then real-world driving scenes where photographed using digital                         Please look carefully at each photo, imagine that you are a driver partic-
Nikon D3100 DSLR Camera with 18–55 mm lens. Images represented                               ipating in this situation, and decide if there is a potential hazard or not.
urban, rural, residential and freeway environment usually encountered                        The potential traffic hazard is a situation in which the driver must take
by drivers. For safety reasons, photos were taken by a passenger sitting                     unplanned evasive actions to avoid the hazard. You will be permitted
on the right front seat, but otherwise the photos replicated “driver's                       to watch at each image for three seconds”. The total number of correct
eye” view (see Fig. 1).                                                                      answers for each participant was calculated and used as a hazard per-
     Fifty-five initial images were selected by researchers as representing                   ception score.
earlier described scenarios, one third of them did not contain potential                        Only those scenes that were rated by all driving instructors (100%)
hazards (18 photos) and others (37 photos) were treated as containing                        and implementers of the study as having potential hazard were in-
potential traffic hazards. Safe scenes were included in the test based on                     cluded in the final version of the HPT-LIT. These scenes were evaluated
earlier research experience. Scialfa et al. [44] recommended using such                      by 86.7% of drivers in the pilot sample as having a potential hazard,
images so that the participants would not adopt tendency to answer                           showing the good face and content validity of the test [34]. Three photos
‘yes’ every time.                                                                            without potential traffic hazard were included as well. Therefore, the
     The prepared photos were presented to observers during the pilot                        final version of the instrument contained 27 static images presenting di-
study with the help of MS Office Power Point software on 17-in. LCD                           verse traffic situations that were used in the main study.
desktop monitor of portable notebook. The resolution of 1280 × 1024
and viewing distance of approximately 50 cm was used. Each photo                             2.3. Procedure
was presented for three seconds (such time is sufficient to perceive
and make a judgement about the stimuli) [46]. Face and content validity                          Participants of the main study were tested in a single session that
of the initial 55-images version of HPT-LIT were analysed in the pilot                       took approximately 30 min. After a detailed explanation about the
study.                                                                                       study, an oral informed consent was obtained. Participants completed
     First, four driving instructors as traffic safety experts were invited to                the demographic questionnaire with questions about their gender,
evaluate the content of the photos and their potential to measure haz-                       age, driving experience, driving exposure, traffic crashes and offences.
ard perception. All of them were males working for different driving                         Then they were presented with the Lithuanian version of hazard
schools across Lithuania no less than five years. The instructors were                        perception test HPT-LIT composed of 27 static images. Images were
sampled on voluntary basis. No other than being driving instructor in-                       presented on a 17-in. LCD desktop monitor of portable notebook with
clusion criterion was used. Driving instructors were asked to look at                        a resolution of 1280 × 1024, viewing distance of approximately 50 cm.
the images as long as they needed, and then they were asked to evaluate                      Each photo was presented for three seconds; the instruction was the
if the scene had a potential hazard giving the “yes/ no” answer. In case of                  same as in the pilot study. The answers of each participant were
                                                                                             recorded by the researcher, they were coded as follows: true – potential
                                                                                             hazard is detected, false – potential hazard is not detected, or hazard re-
                                                                                             ported when it is absent in the stimuli (Table 2). The total number of
                                                                                             correct answers for each participant was calculated, the higher score
                                                                                             showing better skills in hazard perception (Eq. 1).

                                                                                                             X
                                                                                                             n
                                                                                             HPT score ¼           ai                                                           ð1Þ
                                                                                                             i¼1

                                                                                                Eq. (1) Calculation of the Hazard Perception Test (HPT) score. For
                                                                                             each photo (1 to i) the answer a was transformed to one if correct,
                                                                                             and zero if incorrect (see the confusion matrix at Table 2).

                                                                                             3. Results

                                                                                             3.1. Internal consistency

                                                                                                 Internal consistency of the test was assessed using Cronbach Alpha
                                                                                             coefficient. In the main sample of this study Cronbach Alpha was 0.77,
                                                                                             which indicates a satisfactory internal consistency of the scale, sufficient
                                                                                             for group comparisons in scientific research [48]. Corrected item-total
                                                                                             correlations were within or above the acceptable range of 0.15 and

                                                                                             Table 2
                                                                                             Confusion matrix for transforming ‘yes’ and ‘no’ answers for the calculation of the HPT
                                                                                             score.

                                                                                                                                              Stimulus

                                                                                                                        a                     Hazard                   No hazard

                                                                                               Answer                   ‘yes’                 1                        0
                                                                                                                        ‘no’                  0                        1
            Fig. 1. Examples of the photos with potential traffic hazards.
V. Tūskė et al. / IATSS Research 43 (2019) 108–113                                                                   111

0.50 [49] except for three items which had very low correlations with                         with more than two years of driving experience (Table 3). In line with
total of the score. Still, removal of those three items did not change                        expectations male and female drivers of this sample did not differ in
the score of internal consistency; therefore, all pictures were included                      the scores of HPT-LIT.
in the final version of hazard perception test HPT-LIT.
    The same Cronbach Alpha score of 0.77 was obtained in the smaller                         3.5. Predicting crashes with HPT-LIT
sample which was specifically recruited for test-retest reliability. It
remained stable in both testing periods (in the first and subsequent                               The scores of HPT-LIT, driving experience, number of crashes, gender
testing).                                                                                     are visualized in Fig. 2. Three quasi-poisson models were fitted to pre-
                                                                                              dict the crash involvement in the whole data. The first model included
3.2. Test-retest reliability                                                                  only driving experience and the intercept. The second added HPT sum,
                                                                                              and the third also gender (Table 4). Driving experience and HPT score
    Reliability of the HPT-LIT was assessed following test-retest proce-                      were significant predictors in all the models (p b 0.001), but gender
dure. The same group of participants was approached twice in the pe-                          was not (p = 0.157). Model 2 had a significantly lower residual devi-
riod of three-four weeks. Participants were not provided with any                             ance than Model 1 (203.12 vs. 244.66, deviance = 41.54, F(1,122) =
feedback after the first measurement and they had no specific opportu-                          27.382, p b 0.001). For Model 3 the decrease in the residual deviance
nity to practice hazard perception skills. The Pearson correlation be-                        compared to Model 2 was not significant (200.00 vs. 203.12, deviance
tween the total test score of the first and the second testing was 0.836.                      = 3.12, F(1,121) = 2.083, p = 0.152).
Based on the high correlation [50] between test and retest assessments                            The modelling results show that drivers with more experience had
it can be concluded that repeated answers to hazard perception tasks                          more crashes in the whole sample. This is expected, because more expe-
were stable. HPT-LIT is a reliable tool for hazard perception assessment.                     rience means also more exposure. After controlling the driving experi-
                                                                                              ence, higher scores in HPT-LIT predicted lower crash involvement.
3.3. Criteria validity
                                                                                              4. Discussion
    To evaluate the validity of HPT-LIT several types of validity were in-
vestigated. Criteria validity was tested by the hazard perception skills                          Researchers and practitioners suggest including hazard perception
differences in drivers with two or less traffic crashes and drivers with                       measurement in formal driving licensing [44,52] as this ability might
three or more traffic crashes during the driving history. Previous re-                         predict crash involvement and road safety. Because hazard perception
search has shown that drivers with a history of more than three crashes                       tests can be sensitive to cultural or legislative differences, each country
are less able to recognize hazards on the road [41], thus the cut-off of
three crashes was chosen in this study. Typically, criteria validity is sup-
posed to be demonstrated by correlating new test scores with the scores
of already recognized test in the field [51], but there is no existing haz-
ard perception test in Lithuania yet, therefore, is was chosen to compare
HPT-LIT scores of drivers with different crash history. The data was cal-
culated only in the group of experienced drivers (N = 93) as none of the
inexperienced drivers reported having three or more crashes in their
driving history. The results of current study showed that drivers with
a history of less than three crashes scored higher on HPT-LIT than
drivers who reported more crashes during their driving history
(Table 3). Thus, data confirmed that drivers who have been involved
in no or just in a couple of crashes have better skills of hazard
perception.

3.4. Construct validity

   The construct validity was assessed by measuring the relationship
among HPT-LIT scores, driving experience, and gender. Results of the
current study showed that drivers with less than two years of driving
experience scored significantly lower in HPT-LIT compared with drivers

Table 3
Comparison of HPT-LIT scores in drivers with and without crash history, experienced and
inexperienced drivers, and across the gender.

                      N   Mean Std.      t             df         p        Cohen's d
                               deviation

  Crash history (for experienced drivers)
  Less than three      65 20.51 3.713         9.278    91         b0.001 0.27
    crashes
  Three and more       28 13.32 2.625
    crashes

  Driving experience
  Inexperienced      32 15.00 3.742           −4.054 67.936       b0.001 0.43
  Experienced        93 18.34 4.754
                                                                                              Fig. 2. Visualization of the data. a) HPT score (x-axis), number of crashes (y-axis), driving
  Gender
                                                                                              experience in years (colour), b) driving experience in years (x-axis), number of crashes
  Male                70 17.53 4.880          0.108    119.076 0.914       –
                                                                                              (y-axis), HPT score (colour). Jitter is added to make the overlapping data points
  Female              55 17.44 4.586
                                                                                              distinguishable.
112 V. Tūskė et al. / IATSS Research 43 (2019) 108–113
Table 4 When validating a new research instrument, common practice is to
Parameter estimates and their standard errors (in parentheses) of the quasi-poisson correlate their results with known scales measuring the same construct.
models.
We were not able to implement such validation strategy because there
Model 1 Model 2 Model 3 is no other method for testing hazard perception skills in Lithuania. The
Intercept −0.1321 (0.1718) 1.3987 (0.3163)⁎ 1.5200 (0.3225)⁎ sample size was relatively small and based on convenience sampling.
Driving experience 0.0400 (0.0084) ⁎ 0.0438 (0.0074)⁎ 0.0424 (0.0075)⁎ Prospective self-report data on crash history might be biased due to so-
HPT score −0.0956 (0.0183)⁎ −0.0955 (0.0181)⁎ cial desirability or other confounding variables [15]. Due to small sam-
Gender (female) −0.2688 (0.1886)
ple size there was no possibility in this study to differentiate drivers
⁎ p b 0.001. who were or were not at fault for crashes. It might be expected that
drivers at fault for crashes have even poorer hazard perception skills.
has to validate its own testing instrument. The internal consistency of Taken this into account future studies would be able to report more
newly developed HPT-LIT was 0.77. This score is similar to ones found solid evidence for external validity of current instrument.
in other studies, e.g. Scialfa et al. [44] reported the coefficient 0.75 for In order to use the test in driver training and the licensing process
hazard perception test using dynamic video-scenes, Greyson, Sexton the internal consistency of HPT-LIT must be increased. Based on the lit-
[51] reported scores of internal consistencies from 0.69 to 0.86. Some erature two useful alternatives may be considered: increased number of
tests reached more sound reliability scores necessary for individual test- test inter-related items usually leads to higher reliability [35,51], and
ing, but usually they were using the higher number of stimulus (for ex- differentiation of specific hazard perception skills and their measure-
ample, 91 items in Wetton et al. [24]) or more specified skills of hazard ment might be beneficial [41]. Additionally, validity arguments should
perception (e.g., trajectory prediction or hazard classification judge- be obtained in other vulnerable samples of drivers, like learner and
ments in Wetton et al. [41]). In respect to the internal consistency older drivers, who probably have poorer hazard perception skills [36].
HPT-LIT can be regarded as suitable for research purposes. The test Some criterion validity testing attempts by using other valid instru-
also showed a satisfactory test-retest reliability. ments created in other countries could be implemented. Although cul-
Poorer hazard perception skills are often measured among novice tural suitability of any other hazard perception test requires
drivers when compared to more experienced ones [35,43,44]. At the cautiousness, we invite other researchers to address this issue in further
group level, the newly developed HPT-LIT was able to differentiate be- studies. Similar test tasks and test administration procedures should be
tween inexperienced and experienced drivers. This suggests that the followed in both instruments [43]. Also, similarity of driving environ-
test has the potential to capture deficiencies in hazard perception that ment, especially in terms of right-hand vs. left-hand traffic, has to be en-
is related to novice drivers' inexperience, inefficient scanning of driving sured. Tests, which probe situation awareness (presence of elements,
environment, and poorer recognition of the hazard due to a low number interpretation of the situation, and prediction of what will happen
of past exposures to it [6,51]. next) [54], may be more cultural-independent alternatives for tests
The possibility to differentiate drivers with and without crash in- which requires drivers to evaluate the level of hazardousness [33,43].
volvement history was used as a validity measurement as well. Data
of the current study revealed that drivers with three and more crashes 5. Conclusion
in the driving history scored lower in hazard perception test than
those with a history of less or no crashes. The finding is in line with The newly developed Lithuanian hazard perception test (HPT-LIT)
the results of previous studies [15,26,41] confirming that some variation based on static images was tested. Results demonstrated that the 27-
in crash risk is explained by poorer hazard perception skills. item tool has a satisfactory internal consistency and test-retest reliabil-
The results did not show gender differences in hazard perception ity. At group level, the test is also able to differentiate between inexpe-
which is in line with previous research [17]. This also suggests that the rienced and experienced drivers, and between those experienced
test is a valid measure of hazards perception skills. Of course, the rela- drivers who had less than three or more than three crashes in their driv-
tively small sample requires being cautious in such conclusion, but ab- ing history. After controlling the driving experience, higher scores in the
solute mean hazard perception values of males and females differed test predicted lower crash involvement. In other words, the test has suf-
just 0.11, so it would be difficult to expect a statistically significant dif- ficient psychometric properties for research; still further development
ference even if the sample would be bigger. Therefore, data of the is needed in order to apply it for individual testing and decisions
study evidenced that scores of HPT-LIT were related to driving experi- about licence provision. Cultural specificity of the test should be ex-
ence in expected way but were unrelated to drivers' gender. plored in future studies, especially that might be useful for countries
with low-medium traffic density and high rates of road traffic fatalities.
4.1. Limitations and future directions References
The current HP test required drivers only indicate if the stimulus had [1] World Health Organization (WHO), Global Status Report on Road Safety: Time for
Action, Available at http://www.un.org/ar/roadsafety/pdf/roadsafetyreport.pdf
a hazard or not. While such question has been often used in hazard per- 2009, Accessed date: 17 October 2016.
ception tests, it can be asked if it measures specifically driver's ability to [2] Lithuanian Road Administration, , Available at http://www.lakd.lt/lt.php/eismo_
identify hazards, rather than driver's risk estimate for the situation [53]. saugumas/eismo_ivykiu_statistika/27 2016, Accessed date: 24 January 2017.
[3] International Traffic Safety Data and Analysis Group, Alcohol-Related Road Casual-
For example, a busy urban street can be estimated to be riskier in than a ties in Official Crash Statistics, https://www.itf-oecd.org/alcohol-related-road-casu-
rural road, which may lead the driver to respond ‘yes’ even though he/ alties-official-crash-statistics, Accessed date: 2 May 2018.
she did not identify any particular hazard. Alternative test formats [4] Transport and Road Research Institute, Lietuvos gyventojų Patirties Eismo įvykiuose
Ir nuomonės dėl Asmeninio Finansinio indėlio Jiems mažinti Tyrimas [The Research
based on Endsley's (1995) model of situation awareness (SA) have
on the Experience in Road Crashes of Lithuanians and their Opinion upon Own Fi-
been proposed to address this [54]. For example, asking drivers to nancial Investment to Reduce Crashes].
point out and/or name the hazard can help to ensure that they are [5] Report of SE, Regitra, Lietuvoje ženkliai auga naujų transporto priemonių skaičius
[There is a significant increase of new registered vehicles in Lithuania], https://
responding to a hazard and not to the overall situation and asking
www.regitra.lt/lt/naujienos/lietuvoje-zenkliai-auga-nauju-transporto-priemoniu-
them to predict what will happen next can more directly measure the skaicius, Accessed date: 2 May 2018.
ability to anticipate hazards [26]. However, these processes can influ- [6] F.P. McKenna, M.S. Horswill, J.L. Alexander, Does anticipation training effect drivers'
ence the responses also in simple yes/no format. The advantage of ask- risk taking? J. Exp. Psychol. Appl. 12 (1) (2006) 1–10.
[7] Lithuanian National Public Health Care Strategy for 2016-2023. (2015). No. 1291.
ing only for yes/no responses, however, is that the test is simple and [8] P.A. Hancock, M. Lesch, L. Simmons, The distraction effects of phone use during a
easy to comprehend and rate. crucial driving maneuver, Accident. Anal. Prev. 35 (4) (2003) 501–514.V. Tūskė et al. / IATSS Research 43 (2019) 108–113 113
[9] S.P. Walsh, K.M. White, M.K. Hyde, B. Watson, Dialling and driving: Factors influenc- [31] L. Šeibokaitė, T. Özkan, K. Žardeckaitė-Matulaitienė, A. Endriulaitienė, R.
ing intentions to use a mobile phone while driving, Accident. Anal. Prev 40 (6) Markšaitytė, Traffic safety climate: attitudes towards traffic safety of Lithuanian
(2008) 1893–1900. and Turkish young drivers, Transport means - 2016, Proceedings of the 20th Inter-
[10] T. Nordfjærn, Ö. Şimşekoğlu, M.F. Zavareh, A.M. Hezaveh, A.R. Mamdoohi, T. national Scientific Conference, October 5–7, 2016, Juodkrante, Lithuania. Kaunas
Rundmo, Road traffic culture and personality traits related to traffic safety in Turk- 2016, pp. 513–516.
ish and Iranian samples, Safety Sci. 66 (2014) 36–46. [32] M.F. Lesch, P.L.P. Rau, Z. Zhao, C. Liu, A cross-cultural comparison of perceived haz-
[11] D. Jovanović, K. Lipovac, D. Stanojević, The effects of personality traits on driving- ard in response to warning components and configurations: US vs. China, Appl.
related anger and aggressive behaviour in traffic among Serbian drivers, Transport. Ergon. 40 (5) (2009) 953–961.
Res. F-Traf. 14 (1) (2011) 43–53. [33] P.C. Lim, E. Sheppard, D. Crundall, A predictive hazard perception paradigm differen-
[12] A. Endriulaitienė, L. Šeibokaitė, R. Markšaitytė, K. Žardeckaitė-Matulaitienė, A. tiates driving experience cross-culturally, Transport. Res. F-Traf. 26 (2014) 210–217.
Pranckevičienė, Lietuvių Rizikingas Vairavimas: ką Gali paaiškinti Psichologiniai [34] S.S. Smith, M.S. Horswill, B. Chamber, M. Wetton, Hazard perception in novice and
Veiksniai [Risky Driving of Lithuanians: How Do Psychological Factors Contribute experienced drivers: the effects of sleepiness, Accident. Anal. Prev. 39 (6) (2009)
to it], Vytauto Didžiojo universitetas, Kaunas, 2013. 1177–1185.
[13] S. Boufous, R. Ivers, T. Senserrick, M. Stevenson, Attempts at the practical on – road [35] W.P. Vlakveld, A comparative study of two desktop hazard perception tasks suitable
driving test and the hazard perception test and the risk of traffic crashes in young for mass testing in which scores are not based on response latencies, Transport. Res.
drivers, Traffic Inj. Prev. 12 (5) (2011) 475–482. F-Traf. 22 (2014) 218–231.
[14] A.S.K. Cheng, T.C.K. Ng, H.C. Lee, A comparison of the hazard perception ability of ac- [36] Ch.T. Scialfa, D. Borkenhagen, J. Lyon, M. Deschenes, M. Horswill, M. Wetton, The ef-
cident – involved and accident – free motorcycle riders, Accident. Anal. Prev. 43 (4) fects of driving experience on responses to a static hazard perception test, Accident.
(2011) 1464–1471. Anal. Prev. 45 (2012) 547–553.
[15] M.S. Horswill, A. Hill, M. Wetton, Can a video-based hazard perception test used for [37] S. De Craen, D.A.M. Twisk, M.P. Hagenzieker, H. Elffers, K.A. Brookhuis, The develop-
driver licensing predict crash involvement? Accident. Anal. Prev. 82 (2015) ment of a method to measure speed adaptation to traffic complexity: Identifying
213–219. novice, unsafe, and overconfident drivers, Accident. Anal. Prev. 40 (2008)
[16] T. Oron-Gilad, Y. Parmet, Can a driving simulator assess the effectiveness of Hazard 1524–1530.
perception training in young novice drivers? Adv. Transport. Stud. Spec. Issue 1 [38] S.E. Lee, S.G. Klauer, E.C.B. Olsen, B.G. Simons-Morton, et al., Detection of road haz-
(2014) 65–76. ards by novice teen and experienced adult drivers, Transport. Res. Record 2
[17] T.S.A. Wallis, M.S. Horswill, Using fuzzy signal detection theory to determine why (2008) 26–32.
experienced and trained drivers respond faster than novices in a hazard perception [39] J.S. Yeung, Y.D. Wong, Effects of driver age and experience in abrupt-onset hazards,
test, Accident. Anal. Prev. 39 (6) (2007) 1177–1185. Accident. Anal. Prev. 78 (2015) 110–117.
[18] A. Meir, A. Borowsky, T. Oron –. Gilad, D. Shinar, Towards Developing a Hazard Per- [40] M. Paaver, D. Eensoo, K. Kaasik, M. Vaht, J. Maestu, J. Harro, Preventing risky driving:
ception Training Program for Enhancing Young in Experienced Drivers' Abilities, a novel and efficient brief intervention focusing on acknowledgement of personal
Gurion University of the Negev, Ben, 2010 1–97. risk factors, Accident. Anal. Prev. 50 (2013) 430–437.
[19] D. Crundall, P. Chapman, S. Trawley, L. Collins, E. van Loon, B. Andrews, G. [41] M.A. Wetton, M.S. Horswill, Ch. Hatherly, J.M. Wood, N. Pachana, K.J. Anstey, The de-
Underwood, Some hazards are more attractive than others: Drivers of varying expe- velopment and validation of two complementary measures of drivers‘ hazard per-
rience respond differently to different types of hazard, Accident. Anal. Prev. 45 ception ability, Accident. Anal. Prev. 42 (4) (2010) 1232–1239.
(2012) 600–609. [42] A. Borowsky, T. Oron – Gilad, Y. Parmet, Age and skill differences in classifying haz-
[20] S. Vardaki, G. Yannis, S.G. Papageorgiou, Assessing selected cognitive impairments ardous traffic scenes, Transport. Res. F-Traf. 12 (4) (2009) 277–287.
using a driving simulator: a focused review, Adv. Transport. Stud. 34 (2014) [43] D. Crundall, Hazard prediction discriminates between novice and experienced
105–128. drivers, Accident. Anal. Prev. 86 (2016) 47–58.
[21] P. Lacherez, S. Au, J.M. Wood, Visual motion perception predicts driving hazard per- [44] Ch.T. Scialfa, M.C. Deschenes, J. Ference, J. Boone, M.S. Horswill, M. Wetton, A Hazard
ception ability, Acta Ophthalmol. 92 (1) (2014) 88–93. perception test for novice drivers, Accident. Anal. Prev. 43 (2011) 204–208.
[22] Y.C. Liu, J.I. Cian, Effects of situation awareness under different road environments [45] A. Scrimgeour, A. Szymkowiak, S. Hardie, K. Scott-Brown, Gender and Hazard per-
on young and elder drivers, J. of Ind. Prod. Eng. 31 (5) (2014) 253–260. ception skills in Relation to Road Traffic Police officers, Police J. 41 (4) (2011)
[23] G. Underwood, D. Crundall, P. Chapman, Driving simulator validation with hazard 729–733.
perception, Transport. Res. F-Traf. 14 (6) (2011) 435–446. [46] G. Šimaitė, A. Česnulevičius, Vairuotojų reakcijos tyrimas [Examination of drivers‘
[24] M.A. Wetton, A. Hill, M.S. Horswill, The development and validation of a hazard per- reaction time], Jaunųjų mokslininkų darbai 2 (40) (2013) 63–66.
ception test for use in driver licensing, Accident. Anal. Prev. 43 (2011) 1759–1770. [47] OECD/ITF, Road Safety Annual Report 2016, OECD Publishing, Paris, 2016.
[25] D.A. Twisk, C. Stacey, Trends in young driver risk and countermeasures in European [48] D.L. Streiner, Starting at the beginning: an introduction to coefficient alpha and in-
countries, J. Saf. Res. 38 (2) (2007) 245–257. ternal consistency, J. Pers. Assess. 80 (1) (2003) 99–103.
[26] P. Ventsislavova, A. Gugliotta, E. Peña-Suarez, P. Garcia-Fernandez, E. Eisman, D. [49] L.A. Clark, D. Watson, Constructing validity: basic issues in objective scale develop-
Crundall, C. Castro, What happens when drivers face hazards on the road? Accident. ment, Psychol. Assess. 7 (3) (1995) 309.
Anal. Prev. 91 (2016) 43–54. [50] J. Cohen (Ed.), Statistical Power Analysis for the Behavioral Sciences, second ed.
[27] P.C. Lim, E. Sheppard, D. Crundall, Cross-cultural effects on drivers' hazard percep- Lawrence Earlbaum Associates, Hillsdale, NJ, 1988.
tion, Transport. Res. F-Traf. 21 (2013) 194–206. [51] G.B. Greyson, B.F. Sexton, The Development of Hazard Perception Testing, TRL
[28] J.C.F. de Winter, D. Dodou, National correlates of self-reported traffic violations Report TRL558 2002.
across 41 countries, Pers. Indiv. Differ. 98 (2016) 145–152. [52] M.S. Horswill, F.P. McKenna, Drivers' hazard perception ability: Situation awareness
[29] T. Nordfjærn, S. Jørgensen, T. Rundmo, A cross-cultural comparison of road traffic on the road, in: a cognitive approach to situation awareness, Theor. Appl. (2004)
risk perceptions, attitudes towards traffic safety and driver behaviour, J. of Risk 155–175.
Res. 14 (6) (2011) 657–684. [53] H.A. Deery, Hazard and risk perception among young novice drivers, J. of Safety Res.
[30] P. Stanojević, T. Lajunen, D. Jovanović, P. Sârbescu, S. Kostadinov, The driver behav- 30 (4) (1999) 225–236.
iour questionnaire in South-East Europe countries: Bulgaria, Romania and Serbia, [54] M.R. Endsley, Toward a Theory of Situation Awareness in Dynamic Systems, Hum.
Transport. Res. F-Traf. 53 (2018) 24–33. Factors 37 (1) (1995) 32–64.You can also read