Health benefits of raising ambition in Pakistan's nationally determined contribution: WHO technical report
←
→
Page content transcription
If your browser does not render page correctly, please read the page content below
Health benefits of
        raising ambition
  in Pakistan’s nationally
determined contribution:
   WHO technical report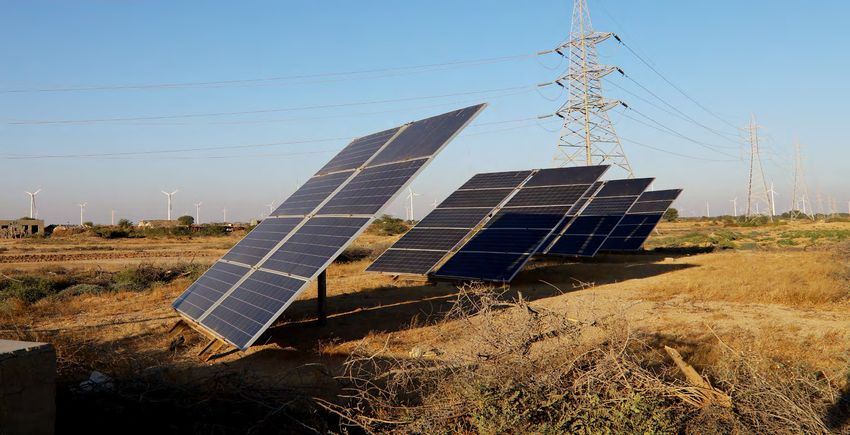
Health benefits of
raising ambition
in Pakistan’s nationally
determined contribution:
WHO technical report
Health benefits of raising ambition in Pakistan’s nationally determined contribution: WHO technical report

ISBN 978-92-4-003636-9 (electronic version)
ISBN 978-92-4-003637-6 (print version)

© World Health Organization 2021

Some rights reserved. This work is available under the Creative Commons Attribution-NonCommercial-ShareAlike 3.0
IGO licence (CC BY-NC-SA 3.0 IGO; https://creativecommons.org/licenses/by-nc-sa/3.0/igo).

Under the terms of this licence, you may copy, redistribute and adapt the work for non-commercial purposes,
provided the work is appropriately cited, as indicated below. In any use of this work, there should be no suggestion
that WHO endorses any specific organization, products or services. The use of the WHO logo is not permitted. If
you adapt the work, then you must license your work under the same or equivalent Creative Commons licence. If
you create a translation of this work, you should add the following disclaimer along with the suggested citation: “This
translation was not created by the World Health Organization (WHO). WHO is not responsible for the content or
accuracy of this translation. The original English edition shall be the binding and authentic edition”.

Any mediation relating to disputes arising under the licence shall be conducted in accordance with the mediation
rules of the World Intellectual Property Organization (http://www.wipo.int/amc/en/mediation/rules/).

Suggested citation. Health benefits of raising ambition in Pakistan’s nationally determined contribution: WHO
technical report. Geneva: World Health Organization; 2021. Licence: CC BY-NC-SA 3.0 IGO.

Cataloguing-in-Publication (CIP) data. CIP data are available at http://apps.who.int/iris.

Sales, rights and licensing. To purchase WHO publications, see http://apps.who.int/bookorders. To submit requests
for commercial use and queries on rights and licensing, see http://www.who.int/about/licensing.

Third-party materials. If you wish to reuse material from this work that is attributed to a third party, such as tables,
figures or images, it is your responsibility to determine whether permission is needed for that reuse and to obtain
permission from the copyright holder. The risk of claims resulting from infringement of any third-party-owned
component in the work rests solely with the user.

General disclaimers. The designations employed and the presentation of the material in this publication do not
imply the expression of any opinion whatsoever on the part of WHO concerning the legal status of any country,
territory, city or area or of its authorities, or concerning the delimitation of its frontiers or boundaries. Dotted and
dashed lines on maps represent approximate border lines for which there may not yet be full agreement.

The mention of specific companies or of certain manufacturers’ products does not imply that they are endorsed
or recommended by WHO in preference to others of a similar nature that are not mentioned. Errors and omissions
excepted, the names of proprietary products are distinguished by initial capital letters.

All reasonable precautions have been taken by WHO to verify the information contained in this publication. However,
the published material is being distributed without warranty of any kind, either expressed or implied. The responsibility
for the interpretation and use of the material lies with the reader. In no event shall WHO be liable for damages arising
from its use.

Design and layout: Phoenix Design Aid A/S
Contents
Acknowledgements v
Acronyms and abbreviations vi
Abstract vii
Background 1
Rationale and scope 2
Global context 3
Co-benefits of fossil fuel subsidy reform and carbon pricing –
international examples 3
Aligning energy policy and nationally determined contributions –
international examples 4
Research methods 6
Summary of modelling framework and approach 6
GSI-IF methods description 7
Energy demand and emissions modelling with GSI-IF 7
Power generation in the GSI-IF model 9
Air pollution in GSI-IF using GEM 10
CaRBonH methods description 10
Study findings 13
Policy recommendations 22
Lessons learned 25
References 26
Annex 1: Emission factors used for the estimation of air pollutants
from energy consumption and power generation 31
Annex 2: Overview of air pollutants from energy consumption and
power generation 32
Annex 3: Power generation technologies considered in GEM 34
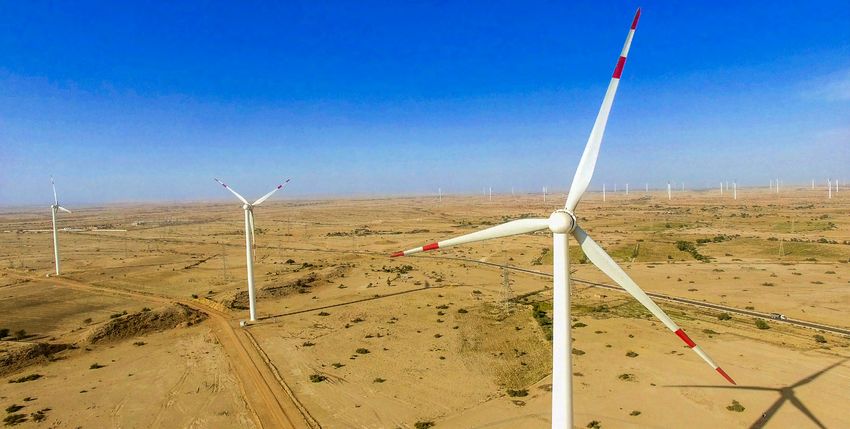
iiiCover: Wind turbine mills at Jhimpir Pakistan
©Shutterstock.com/Maddy.92
Solar plant, Multan, Punjab, Pakistan
©Shutterstock.com/Rabia Irfan
iv HEALTH BENEFITS OF RAISING AMBITION IN PAKISTAN’S NATIONALLY DETERMINED CONTRIBUTION: WHO TECHNICAL REPORTAcknowledgements
The World Health Organization in collaboration with the Ministry of National Health Services, Regulations and
Coordination, the Ministry of Climate Change and the International Institute for Sustainable Development are grateful
to the following members of the technical working group that contributed to this research study.
Project coordination led by Tara Neville, WHO
Modelling and analytical expertise:
• Andrea Bassi, Georg Pallaske (KnowlEdge Srl, International Institute of Sustainable Development)
• Joseph V. Spadaro (Spadaro Environmental Research Consultants)
Technical and policy expertise:
• National consultants: Zafar Fatmi (Aga Khan University), Irfan Yousuf
• International Institute for Sustainable Development (IISD): Lourdes Sanchez, Avet Khachatryan, Estan Beedell
• Ministry of Climate Change: Syeda Hadika Jamshaid, Saima Shafique, Muhammad Irfan Tarq
• Ministry of National Health Services, Regulations and Coordination: Razia Safdar
• World Health Organization: Palitha Gunarathna Mahipala, Noureen Aleem Nishtar, Mazen Malkawi, Saleh
Rababa, Heather Adair-Rohani, Diarmid Campbell-Lendrum, Pierpaulo Mudu
Financial support for this research study has generously been provided by the Wellcome Trust and the International
Health Grants Programme of Health Canada.
HEALTH BENEFITS OF RAISING AMBITION IN PAKISTAN’S NATIONALLY DETERMINED CONTRIBUTION: WHO TECHNICAL REPORT vAcronyms and abbreviations BAU Business as usual CaRBonH Carbon Reduction Benefits on Health COP Conference of the Parties GHG Greenhouse gas IISD International Institute for Sustainable Development IMF International Monetary Fund NDC Nationally Determined Contribution OECD Organisation for Economic Co-operation and Development UN United Nations UNFCCC United Nations Framework Convention on Climate Change WHO World Health Organization WB World Bank vi HEALTH BENEFITS OF RAISING AMBITION IN PAKISTAN’S NATIONALLY DETERMINED CONTRIBUTION: WHO TECHNICAL REPORT
Abstract
The following technical report outlines the rationale, process and results of a joint research study, coordinated by
the World Health Organization (WHO), co-chaired by the Ministry of National Health Services, Regulations and
Coordination and the Ministry of Climate Change, and in collaboration with the International Institute for Sustainable
Development (IISD) and leading international and national experts. A rationale section describes the links between
fossil fuel burning and adverse health outcomes, drawing on international literature with reference to the Pakistan
context. A summary of the research study describes how scenarios were modelled to examine the health and
economic implications of raising ambition in Pakistan’s nationally determined contribution (NDC) to the United
Nations Framework Convention on Climate Change (UNFCCC). The scenarios simulated were (i) NDC reference case,
assuming no change in climate mitigation relative to 2020, (ii) business as usual (BAU), considering the continuation of
historical trends resulting in slow but continued progress towards decarbonization, (iii) current ambition, taking into
account the current policy ambition outlined in sectoral plans, and (iv) high ambition, assuming an increase in climate
mitigation ambition, in alignment with the ongoing discussions related to the update of the NDC.
The results of the study indicate that the high ambition scenario compared to the NDC reference case
scenario would result in a reduction of greenhouse gas (GHG) emissions of approximately 27.5% in 2030.
These GHG emissions reductions would be accompanied by significant air quality improvements that could
prevent more than 65 000 deaths annually from ambient air pollution in 2030. The process outlined in this
technical report can serve as a template for future studies that seek to demonstrate how strong, ambitious
national climate commitments can result in significant health gains.
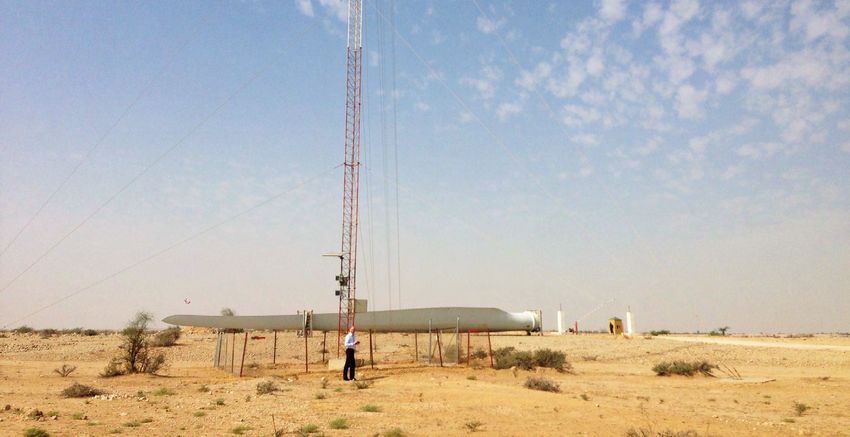
HEALTH BENEFITS OF RAISING AMBITION IN PAKISTAN’S NATIONALLY DETERMINED CONTRIBUTION: WHO TECHNICAL REPORT viiZorlu wind power plant at Jhimpir Sindh Pakistan, 2021
©Shutterstock.com/Aqib YasinBackground The burning of fossil fuels creates air pollution that leads to noncommunicable diseases, including cardiovascular disease, chronic respiratory conditions, acute lower respiratory infections and certain cancers (Campbell-Lendrum & Prüss-Ustün, 2018). Fossil fuels are also the main contributor to GHGs that cause climate change, which, in turn, is strongly linked to environmental risk factors for noncommunicable diseases and other health impacts (Watts et al., 2021). These negative externalities are not priced into the cost of fossil fuels; society bears the extra cost in the form of higher healthcare expenses and increased mortality and morbidity. Subsidies to fossil fuels further increase the spread between the cost of fossil fuels to the consumer and the cost to society. In doing so, subsidies encourage the overconsumption of fossil fuels beyond the social optimum (SEI et al., 2020). They also place a burden on government finances, with a high opportunity cost for other priorities like public health. Finally, supporting fossil fuels has a lock- in effect, limiting the deployment of clean forms of energy that can significantly reduce air pollution. In the current context driven by COVID-19, it is more important than ever that government energy policies are aligned with health, climate and social priorities. For this reason, the United Nations (UN) Secretary General (United Nations, 2021), the European Union (EU) (Council of the European Union, 2021), the G20 (G20 Research Group, 2009), the World Health Organization (WHO) (World Health Organization, 2020b) and many other organizations are calling for an end to fossil fuel subsidies. At the same time, renewable energies and the electrification of transportation are attracting significant attention in developed and developing countries. The cost of renewable energy technologies has rapidly decreased over the past 20 years and these technologies now dominate most capacity additions (International Energy Agency, 2020; IRENA, 2020). Several countries have made commitments to support and deploy electric vehicles, which can significantly reduce air pollution in cities. However, for a positive health and climate effect, the electrification of transportation or other energy uses mostly relying on fossil fuels (such as heating), requires a clean electricity mix and a strong electricity network. Governments must therefore prioritize this infrastructure. In addition, as COP26 approaches, more countries are pricing emissions. More countries introduced carbon pricing in 2019 than in any previous year, including for the first time in Africa (South Africa) and Asia (Singapore) (World Bank, 2020). HEALTH BENEFITS OF RAISING AMBITION IN PAKISTAN’S NATIONALLY DETERMINED CONTRIBUTION: WHO TECHNICAL REPORT 1
Rationale and scope
Pakistan has taken important steps to be aligned with these international trends, including ambitious renewable
energy and electric vehicle targets (Deccan Herald, 2020; Uddin, 2020). In recent years, Pakistan has made efforts to
reform its fossil fuel subsidies for natural gas and other petroleum products (Gould & Adam, 2020). However, there
is still an opportunity for further reform to support climate and health targets, as well as to release funds to support
other priority areas. The International Monetary Fund (IMF) estimates that in 2017 fossil fuel subsidies in Pakistan were
US$ 3.2 billion (IMF, 2018). In addition, it estimates US$ 13.1 billion in costs of climate, health and other externalities
caused by the use of fossil fuels, not including foregone government revenue.

When the costs of these externalities are accounted for, the benefits of energy policy reforms become more compelling.
WHO recommends that health co-benefits, in particular policies that reduce air pollution and short-lived climate
pollutants (SLCPs), should be prioritized in NDCs. SLCPs are responsible for a large share of air pollution mortality, as
well as having high global warming potential (World Health Organization, 2020a). Some countries have already included
health and fossil fuel subsidy reform in their NDCs but these are still limited in numbers and there is room for more focus
on the health co-benefits of climate action in country strategies. Although 70% of NDCs submitted as of December
2019 include public health considerations, only 10% (18 out of 184) highlight the health co-benefits of greenhouse gas
mitigation policies (World Health Organization, 2020a). More progress is especially needed for commitments to monitor
the health co-benefits of climate action and to inform decision making.

Of the countries whose NDCs reference the health impacts of climate change, the most cited impacts are vector-
borne diseases followed by food and nutrition (World Health Organization, 2020a). This indicates a greater inclusion
of the impacts of climate change and a concern for adaptation policies, compared to the mitigation of air pollution.
For example, Sri Lanka’s NDC cites an increase in seasonal outbreaks of dengue as a health impact linked to climate
change (Ministry of Mahaweli Development and Environment, 2016). It lists 14 health-related activities mainly linked
to climate change adaptation, including strengthening vector-borne disease surveillance systems, strengthening the
water quality surveillance system, and strengthening the surveillance system for non-communicable diseases (Ministry
of Mahaweli Development and Environment, 2016).

Some countries have considered these interlinkages and included related targets in their NDCs. For example, Mexico
has pledged in its first NDC to take actions to reduce SLCPs, noting the co-benefits to human health and ecosystems
(Ministry of Environment and Natural Resource, 2020). Specifically, Mexico has unconditionally committed to
reducing black carbon emissions by 51% by 2030 compared to BAU, and conditionally is targeting a 70% reduction
of black carbon emissions by 2030 compared to BAU (Ministry of Environment and Natural Resource, 2020). In 2020,
Mexico released its national SLCP strategy, outlining concrete actions it is taking to reduce black carbon and methane
emissions, including increasing the uptake of electric vehicles and the use of public transport; using cleaner fuels and
technologies for cooking; and controlling particulate pollution from sugar mills (CCAC, 2020).

NDCs also address direct air pollution while targeting greenhouse gas reduction, resulting in significant health co-
benefits. This is the example of China, that also defined in their 13th Five-Year Plan a comprehensive policy package to
mitigate climate change and reduce air pollution that is expected to produce substantial health co-benefits (Sanchez
& Wang, 2020). China’s package included programmes to expand renewable energy, policies to limit and reduce fossil
fuel use, and policies to address air pollution (Sanchez & Wang, 2020). One study estimates that realizing China’s NDC
targets will prevent roughly 20 000 premature deaths in 2030, and between 225 000 and 368 000 premature deaths in
2050 compared to BAU (Cai et al., 2018).

2                    HEALTH BENEFITS OF RAISING AMBITION IN PAKISTAN’S NATIONALLY DETERMINED CONTRIBUTION: WHO TECHNICAL REPORT
Global context
Co-benefits of fossil fuel subsidy reform and carbon pricing – international examples

                                                         As well as being the primary source of carbon dioxide emissions,
                                                         the combustion of fossil fuels is a major cause of air pollution
    THE GLOBAL SUBSIDIES                                 (Smith et al., 2014). The impacts of these two consequences of
    INITIATIVE-INTEGRATED                                fossil fuel use are interlinked; as temperatures increase due to
    FISCAL (GSI-IF) MODEL IN                             climate change, the health impacts of fine particulate matter
    PAKISTAN                                             become more severe (Silva et al., 2017). Climate change is
                                                         therefore likely to lead to an increase in mortality from diseases
    According to previous modelling,                     linked to air pollution (Smith et al., 2014). WHO estimates that
    eliminating fossil fuel subsidies would              ambient and household air pollution currently cause
    reduce Pakistan’s GHG emissions by                   7 million premature deaths annually from cardiovascular disease,
    an estimated 1.43% in 2030 compared                  respiratory diseases, stroke, chronic obstructive pulmonary
    to BAU (Gass et al., 2019). Combined                 disease, and cancer such as lung, trachea and bronchus cancer
    with a 10% energy tax, and investing                 (World Health Organization, 2014b).
    20% of savings from the fossil fuel
    subsidies reform towards energy                      Policies to lower GHG emissions typically also lower air pollution,
    efficiency and renewable energy,                     producing co-benefits by reducing both the direct and indirect
    Pakistan could achieve a 4.59%                       health impacts of climate change. For this reason, WHO
    reduction in emissions in 2030 (Gass et              recommends that health co-benefits be identified and included
    al., 2019). Although appearing modest,               in cost-benefit analyses of climate policies, emphasizing that the
    over time an annual reduction of this                value of health co-benefits, like other externalities, may outweigh
    scale would produce a large impact.                  the implementation costs of the adopted climate policies (World
    Cumulative absolute emissions for                    Health Organization, 2020a).
    the years 2025 to 2030 under an
    FFSR scenario compared to BAU are                    India increased taxes on petrol and diesel in March 2020 to
    estimated at 24 342 kt of CO2e, more                 help raise funds to support COVID-19 recovery. The hike of 3
    than the annual carbon emissions of                  rupees per litre was expected to result in up to US$ 5.42 billion in
    Sri Lanka (Gass et al., 2019; World Bank             additional annual revenue (Varadhan & Ahmed, 2020). Though
    Group, 2021b). Fossil fuel subsidies                 implemented for fiscal reasons, the policy will also have an effect
    also disadvantage clean solutions                    in lowering air pollution from fossil fuels. It will complement
    while under-pricing fossil fuels and                 other policies such as India’s car sales tax, introduced in 2016 to
    creating risks for stranded assets                   combat high levels of air pollution and congestion (Burke, 2016).
    (Merrill et al., 2015; SEI et al., 2020).
    With FFSR, as markets adjust to new                  Indonesia introduced major reforms to fossil fuel subsidies in
    price signals, progressive investments               2014, removing subsidies on gasoline and significantly reducing
    in clean energy could generate                       subsidies on diesel. The move, coupled with a drop in oil prices,
    further efficiency gains and have a                  resulted in US$ 15.6 billion in additional government revenue,
    compounding effect on lowering                       with which Indonesia was able to increase funding for ministries
    emissions intensity.                                 to spend on human and economic development programmes,
                                                         state-owned enterprises to invest in infrastructure, and transfers
                                                         to regions and villages (Beaton et al., 2016). The reallocation

HEALTH BENEFITS OF RAISING AMBITION IN PAKISTAN’S NATIONALLY DETERMINED CONTRIBUTION: WHO TECHNICAL REPORT                    3
of Indonesia’s fuel subsidies helped to reduce poverty and improve access to basic needs like water, sanitation
and lighting. It also contributed to economic growth, with likely benefits to services, manufacturing, construction,
agriculture, transport and communications (Beaton et al., 2016).
Aligning energy policy and NDCs – international examples
Energy policies and regulations have a strong impact on achieving climate targets. Increasing renewables, investing in
energy efficiency, and reflecting the externality cost of fossil fuels through carbon pricing or fossil fuel subsidy reform
(FFSR) can lead to significant emissions reductions, resulting in positive climate and health impacts. The Global
Subsidies Initiative (GSI) conducted modelling across 26 countries, considering reform of their fossil fuel subsidies,
adding a 10% energy tax and recycling a portion of the savings from FFSR into energy efficiency (20%) and renewable
energy (10%). This resulted in cumulative GHG reductions of 10.63 Gt of CO2e by 2030, reducing emissions by 13.2%
compared to BAU (Figure 1) (Gass et al., 2019). According to the modelling, fossil fuel subsidy phase out alone could
generate an average drop of 6% in emissions for the year 2030. This is aligned with global estimates that the removal
of all fossil fuel subsidies would lower carbon emissions by between 6.4 and 8.2% by 2050 (Burniaux & Chateau, 2014;
Schwanitz et al., 2014).
Figure 1
Average percentage of CO2e emissions reductions modelled across 26 countries
(SOURCE: GSI, 2019)
0%
Remove subsidies to fossil fuels
-2%
-4%
Invest 10% of savings in renewable energy
-6%
Invest 20% of savings in energy efficiency
-8%
-10%
Introduce 10% energy tax
-12%
Subsidy savings reallocation period Tax revenue reallocation period
-14%
2013 2014 2015 2016 2017 2018 2019 2020 2021 2022 2023 2024 2025 2026 2027 2028 2029 2030
FFSR
renewable energy energy efficiency TAX
Following the Paris Agreement, 14 countries referenced FFSR as a means of meeting their GHG emissions reduction
targets in their NDCs (Gass et al., 2019). Of these, 11 were low-income or middle-income countries (Terton et al., 2015).
Prominent economies included China and India, while Egypt and the United Arab Emirates made FFSR commitments
with the largest potential impact on emissions relative to their baselines (Terton et al., 2015).
As NDCs are updated in advance of COP26, countries are being urged to consider adding FFSR as an action to increase
their ambition for GHG mitigation (Gass et al., 2019; United Nations, 2021). Of the eight countries that have submitted
a second NDC, one, Suriname, has committed to reforming its energy subsidies to promote the consumption of
renewable energy (Cabinet of the President of the Republic of Suriname, 2019; UNFCCC, 2021).
4 HEALTH BENEFITS OF RAISING AMBITION IN PAKISTAN’S NATIONALLY DETERMINED CONTRIBUTION: WHO TECHNICAL REPORTFrom 2011 to 2016, Suriname spent an average of 3.3% of GDP on energy subsidies. Its NDC pledges to introduce more cost-reflective electricity tariffs that promote energy efficiency and reduce GHG emissions (Cabinet of the President of the Republic of Suriname, 2019). Savings from the reforms should allow financial room for other initiatives in its NDC, including replacing existing diesel generation with solar photovoltaic (PV), and providing consumer subsidies for the purchase of energy efficient appliances (Cabinet of the President of the Republic of Suriname, 2019). HEALTH BENEFITS OF RAISING AMBITION IN PAKISTAN’S NATIONALLY DETERMINED CONTRIBUTION: WHO TECHNICAL REPORT 5
Research methods
Summary of modelling framework and approach

When it comes to determining the impacts of climate change and health, policy decisions and economic, social and
natural systems interact together to form a national policy context. These systems are complex, and feedback within
them produces non-linear outcomes, making them difficult to predict. Models replicate these systems as best as
possible to better forecast the impacts of policy decisions on health, environmental and other outcomes.

To conduct estimates of the health impacts of different energy policy scenarios in Pakistan, three models were used
(see Figure 2). These followed a staggered approach, with outputs from one model fed into the next to capture the
full chain of causality between fossil fuel use and health outcomes. The GSI-IF model was used to estimate the impact
of energy policy changes on national GHG emissions. The Green Economy Model (GEM) was used along with the
GSI-IF model to estimate the emissions of air pollutants (e.g. PM2.5) from final domestic energy consumption and from
power generation. The Carbon Reduction Benefits on Health (CaRBonH) model was then used to estimate the impact
of air pollutants on various health outcomes including averted mortality. Finally, the economic benefit of averted
mortality was calculated using a Pakistani-specific value of a statistical life (VSL), determined using the Organisation
for Economic Co-operation and Development (OECD) benefit transfer methodology (Organisation for Economic Co-
operation and Development, 2012).

These models were used for their flexibility to adapt to the Pakistan context, the ability to use national-level data as
inputs, and because of their use and validation by world-leading organizations in the field. The GSI-IF model has been
used to model the effects of fossil fuel subsidy reform on 28 countries1 and its methodology has been validated by

Figure 2
Models used in this study

           Global Subsidies                              Green                                       CaRBonH
              Initiative –                              Economy                                       Model
           Integrated Fiscal                           Model (GEM)
            (GSI-IF) Model

     Estimates the impact on                   Estimates the emissions of 11 air           Quantifies the physical and
     national GHG emissions of fossil          pollutants from final domestic              economic consequences for
     fuel subsidy reform and carbon            energy consumption and from                 human health using data on
     tax, as well as the impacts               power generation. Air pollutants            emission reductions of key
     of increased investment on                considered in GEM are: CO2; CO;             air pollutants that could be
     renewable energy and energy               SO2; NO2; NMVOC; CH4; PM10;                 achieved by future climate
     efficiency resulting from the             PM2.5; Black carbon; Organic                policies. Air pollutants
     savings from subsidy reform and           Carbon; and Ammonia (NH3).                  considered are primary
     additional funds from fossil fuel                                                     particulate matter (PM10), SO2,
     taxation.                                                                             NOx and NH3.

6                     HEALTH BENEFITS OF RAISING AMBITION IN PAKISTAN’S NATIONALLY DETERMINED CONTRIBUTION: WHO TECHNICAL REPORT
the International Monetary Fund (IMF) (Gass et al., 2019). The GEM has been customized for Indonesia, Mauritius,
Cambodia and Mozambique, among other countries, and follows a framework developed by the United Nations
Environment Programme (UNEP) (Bassi, 2015). The CaRBonH model was developed by WHO and has been used to
model health effects from air pollutants in countries across the globe (Spadaro et al., 2018).
These models together can provide a representation of Pakistan’s dynamics that reflects as closely as possible,
using international best practices, the country’s complex reality. Various scenarios can then be tested with different
assumptions to forecast the consequences of policy decisions.
GSI-IF methods description
The GSI-IF model is a systems dynamics model that estimates the impact on national GHG emissions of FFSR and
carbon tax, as well as the impacts of increased investment on renewable energy and energy efficiency resulting from
the savings from subsidy reform and additional funds from fossil fuel taxation. It was designed to inform national-level
reform planning and strengthen international reporting around fossil fuel subsidies, especially regarding NDCs to the
Paris Agreement. The GSI-IF model takes national-level data on energy consumption by sector and source as a baseline.
Gross domestic product (GDP) growth is currently based on the IMF Economic Outlook and population is based on
the UN World Population Prospects database. Subsidy data are drawn from the International Energy Agency (IEA)
and IMF. For this study, national data from Pakistan were used, except for energy subsidy data, which were sourced
from the IEA. Energy consumption over a given time is then adjusted based on demand elasticities associated with
changes to GDP, population and technology (energy efficiency). The price effect is calculated for energy price changes
and energy subsidies or taxes. The GSI-IF model also takes into account the substitution effect whereby consumers
switch to different forms of energy depending on relative prices. Final energy demand is estimated by source based on
the interaction of demand drivers with these effects. Finally, total national GHG emissions are calculated based on the
known emission factors of each energy source.
Energy demand and emissions modelling with GSI-IF
The national energy consumption forecasts generated by the GSI-IF model are disaggregated by fuel source and
sector. Specifically, the model includes energy consumption from coal, petroleum products, natural gas, biofuels and
waste, and electricity. The consumption of each fuel source is further disaggregated into sectoral energy consumption,
specifically residential, commercial, industrial and transport sectors.
The main structural assumptions of the model are (see Figure 3):
• Final energy consumption is estimated considering (1) indicated demand (including the effect of GDP,
population and energy efficiency); (2) the price effect; and (3) the substitution effect. Items (1) and (2) are
used to estimate demand for energy services.
• The potential for fuel substitution is represented by the ratio of an energy price over the national weighted
average energy price. This implies that an energy source will become more attractive if its price increases
less than others when subsidies are removed or it is taxed less than others.
• It is assumed that price effects require a one-year delay to influence energy consumption.
1
Algeria, Argentina, Australia, Bangladesh, Brazil, China, Egypt, Ethiopia, Germany, Ghana, India, Indonesia, Iran, Iraq, Mexico, Morocco, Myanmar,
Nigeria, Pakistan, Russia, Saudi Arabia, South Africa, Sri Lanka, Tunisia, United Arab Emirates (UAE), United States of America (USA), Viet Nam
and Zambia.
HEALTH BENEFITS OF RAISING AMBITION IN PAKISTAN’S NATIONALLY DETERMINED CONTRIBUTION: WHO TECHNICAL REPORT 7Figure 3
GSI-IF model sketch, highlighting the main steps considered for estimating CO2e emissions reductions resulting from fossil fuel
subsidy reform and taxation
Indicated Price Substitution Final demand CO2e
demand effect effect (consumption) emissions
Price ratio: energy
Initial energy source price over Indicated energy
Energy price demand Emission factors
demand average energy price (by energy source)
(with price effect)
Price Price
elasticity elasticity
Share of energy
Subsidies demand by source
GDP and taxation Price effect (with subsitution
effect)
Income
elasticity
Resource Renewable energy
reallocation
Population
Population
elasticity
Subsidy savings
Technology and tax
(energy efficiency) Energy revenues
efficiency
The model accounts for several “energy demand” variables considering the effects of price and substitution as
indicated in Figure 3. Indicated sectoral energy demand is calculated using an initial value (indexed to a baseline year),
multiplying it by relative GDP and relative population (both indexed to the same baseline year and raised to the power
of a specific elasticity factor) and dividing it by relative energy efficiency (also indexed to the baseline year). The use of
subscripts allows for calculating energy demand for the residential, commercial, industrial, and transport sectors within
the same variable.
The price effect is then added, simply taking indicated demand and multiplying it by relative energy price (indexed to
the baseline year), and raised to the power of a price elasticity. The removal of fossil fuel subsidies and addition of fossil
fuel taxes is reflected in energy price changes. When subsidies are removed or taxes added, it is assumed that energy
prices will increase for all sectors (unless it is known that subsidies/taxes are allocated to specific users). In the case of
Pakistan, subsidy reform was applied evenly across all sectors, but differentiated by fuel type based on the subsidized
percentage of the cost of each fuel. The extent to which subsidies are removed and the timeline can be also modelled. In
the case of Pakistan, the model assumed full removal of subsidies in the Current ambition and High ambition scenarios
by 2025, and a 10% fossil fuel tax implemented between 2025 and 2030 in the High ambition scenario. Subsequently, the
substitution effect is considered. The formulation is the same as the one used for incorporating the price effect, but a
delay of one year is used to represent the lag existing between price changes and demand (or consumption) changes.
The potential for substitution from one energy source to the other, due to price changes (e.g. as a result of fossil fuel
subsidy removal), is incorporated by using the ratio of energy source price over the average energy price of the country
(estimated as a weighted average of all energy prices). This ratio is also indexed, to ensure consistency with the use of
elasticities.
8 HEALTH BENEFITS OF RAISING AMBITION IN PAKISTAN’S NATIONALLY DETERMINED CONTRIBUTION: WHO TECHNICAL REPORTIndicated energy demand (including the price effect) is used to estimate the total energy that has to be guaranteed at
the country level. The potential for substitution is used to estimate the actual share of energy consumption by source.
As a result, a normalization is performed, multiplying total indicated energy demand by the shares obtained from
the inclusion of the substitution effect. GHG emissions from energy consumption are calculated by sector and fuel
using 2006 Intergovernmental Panel on Climate Change (IPCC) emission factors (IPCC, 2007). The normalized sectoral
energy demand, by fuel, is multiplied by the respective emission factor.
Emissions per TJ of electricity used are calculated with a multiplier based on the shares of oil, coal and gas in the total
electricity generation mix, and each source’s emission factors. Nuclear and renewable energy are assumed to have zero
carbon intensity per TJ generated.
The recycling and repurposing of subsidy savings and tax revenues is done endogenously, by estimating the additional
energy efficiency potential and additional renewable energy capacity based on annual fossil fuel subsidy savings or
fossil fuel tax revenue. The GSI-IF model allows for reallocating a specific percentage of subsidy savings or tax revenues
to energy efficiency and/or renewable energy, and impacts are reflected in altered behaviour for the stock of energy
efficiency and the GHG intensity per TJ of electricity. Data required for estimating the impact of revenue recycling are
the cost of energy efficiency (per TJ of energy saved) and the cost of renewable generation capacity in Pakistan, estimated
based on the average wind and solar power capacity cost from the Energy Information Administration (EIA) and IEA.
While additional savings from investments in energy efficiency accumulate into the stock of energy efficiency, the
additional renewable energy accumulates in a separate stock, depending on the share of savings reallocated to new
renewable capacity. An average load factor is used to determine the electricity generated by this additional renewable
capacity. The feedback of additional renewable capacity is introduced through the share of electricity from renewable
energy investment. The share of electricity from renewable energy investment feeds back, with a one-year fixed delay,
into the equation for the share of oil and coal. In other words, if the reallocation policy is active, the increased share of
renewables is assumed to replace coal-based and oil-based power generation.
Power generation in the GSI-IF model
The power generation module captures the demand for electricity, transmission losses, and required and current
power generation capacity. The module uses the total normalized electricity demand as input to assess electricity
generation by technology and forecast future capacity requirements. It further provides information about total
electricity generation, both by technology and system-wide, and the shares of generation by technology.2
Power generation capacity is represented using two stocks: power generation capacity under construction and
power generation capacity. The installation and usage of power generation capacity is driven by the desired electricity
generation rate, which considers both imports and transmission losses. The desired electricity generation by
technology is then calculated by multiplying the total desired generation by the shares of generation satisfied by the
respective technology. Considering the load factor and the number of hours per year, the desired electricity generation
by technology is used to calculate the required electricity generation capacity for each technology.
The calculation of the power generation capacity gap compares the required power generation capacity with the
currently installed capacity. The required electricity generation capacity is compared to the current power generation
capacity and power generation capacity under construction to determine whether there is a capacity gap. A MAX
function is used to ensure that the capacity gap does not take negative values in case of overcapacity, as a decrease in
capacity is assumed to happen through decommissioning only.
2
The power generation module estimates capacity, generation and cost for the 13 technologies presented in Annex 3.
HEALTH BENEFITS OF RAISING AMBITION IN PAKISTAN’S NATIONALLY DETERMINED CONTRIBUTION: WHO TECHNICAL REPORT 9The stock of power generation capacity under construction is changed by the construction rate and the completion rate. The construction rate is increasing the stock level and calculated by dividing the power generation capacity gap by the time to process capacity orders. The completion rate is an outflow of power generation capacity under construction and an inflow to power generation capacity. The completion rate is defined as a fixed order delay based on the construction rate and the construction time for all technologies, based on the assumption that capacity becomes functional once the construction is completed. Power generation capacity is increased by the completion rate, and decreased by decommissioning, whereby decommissioning is calculated as a fixed delay of the completion rate and the capacity lifetime, based on the assumption that capacity depreciates after a fixed lifetime. Electricity generation is calculated based on the power generation capacity, the load factor, and the hours per year. It represents the total amount of electricity produced. A MIN function is used to ensure that only the required amount of electricity is produced, to avoid overproduction. It compares the current generation potential, by technology, with the desired electricity generation, by technology. If the potential generation is higher, the MIN function ensures the technology in question does not produce more electricity than demanded. The total electricity generation rate represents the sum of electricity generation from all types of capacity and is calculated by using a SUM function to add up the electricity production of all technology subscripts. The sum of the electricity that is produced by hydropower and other renewable capacity types divided by the total electricity generation represents the share that renewable capacity has in total electricity production. The power generation module used an average of wind and solar power capacity cost from the EIA and IEA, considering the full cost of installation. Air pollution in GSI-IF using GEM GEM estimates the emission of air pollutants from final domestic energy consumption and from power generation. In total, GEM estimates 11 pollutants across energy sources and sectors. The emissions factors were obtained from the emissions factor database of the Low Emissions Analysis Platform (LEAP) Integrated Benefits Calculator (IBC), which is publicly available.3 Air pollutants considered in GEM are: CO2; CO; SO2; NOx; NMVOC; CH4; PM10; PM2.5; black carbon; organic carbon; and ammonia (NH3). Air pollutants from energy consumption and power generation are calculated separately. Air pollutants from final energy consumption are calculated by multiplying total final energy demand (by fuel source) by a respective emission factor by type of fuel and sector. Air pollutants from power generation are calculated by multiplying the fuel used for the generation of electricity by a respective emissions per TJ of fuel used multiplier. The emission factors used for the estimation of air pollutants from energy consumption and power generation are summarized in Annex 1. CaRBonH methods description The CaRBonH4 model is a decision-support tool for government planners that uses data on emission reductions of key air pollutants to quantify the health and economic co-benefits that could be achieved by future climate policies. The model quantifies the physical health benefits in terms of reduced incidences of morbidity and mortality, and the aggregated economic gains considering benefits to individuals, and more broadly to national health care budgets and productivity output, as well as intangible societal benefits from gains in quality of life. Pregnancy loss as a result of maternal exposure to high levels of particulate matter was identified as a national consideration for investigation in this study. The CaRBonH model was adapted to include preliminary analysis of pregnancy loss associated with exposure to ambient particulate matter (PM2.5) based on recent epidemiological evidence (Xue et al., 2021). While further investigation is required, preliminary results of this analysis have been included in these study findings. 3 https://leap.sei.org/default.asp?action=IBC 4 CaRBonH (WHO EURO) model, available at http://www.euro.who.int/en/health-topics/environment-and-health/Climate-change/ publications/2018/achieving-health-benefits-from-carbon-reductions-manual-for-CaRBonH-calculation-tool-2018. 10 HEALTH BENEFITS OF RAISING AMBITION IN PAKISTAN’S NATIONALLY DETERMINED CONTRIBUTION: WHO TECHNICAL REPORT
The health impact assessment in CaRBonH follows an impact pathway analysis. The approach explicitly traces the
fate of pollutants from the moment they are released into the environment, followed by atmospheric dispersion, and
removal by pollutant deposition and chemical transformation. Vulnerable population subgroups, such as sick people,
children, and older people, who are exposed to atmospheric contaminants through inhalation and/or ingestion
pathways are at a higher health risk of suffering from adverse morbidity symptoms. These range from mild discomfort
to more serious life-threatening conditions requiring medical attention to premature mortality. Health burdens are
calculated using exposure-disease outcome risk functions. Lastly, physical burdens are monetized considering health
care expenditures, costs to the individual, economy productivity losses, and the impact of illness on quality of life due
to pain and suffering (intangible costs). Future costs are discounted, with typical discount rates varying between 3%
and 7%, and are uplifted to account for real income growth changes (values are country dependent) to yield present
values. Except for cancer risks, usually, it’s assumed there is no time delay (cessation lag) between exposure and
outcome.
The CaRBonH modelling framework is illustrated in Figure 4. The minimalistic core user inputs to the software consist
of the reduced emissions of PM, SO2, NOx and NH3, or any combination of these pollutants, due to changes related
to reductions in national GHG budgets consistent with the 2030 proposed NDC pledge (dark blue box in Figure 4).
Country-level data to apply the CaRBonH model to Pakistan came from the World Bank (2021), the Institute for
Health Metrics and Evaluation (IHME) (2021), the Health Effects Institute (2020), and the United Nations – World
Population Prospects (UN-WPP) (2019).
Figure 4
CaRBonH modelling framework
Calculation
steps
Major air pollutant emission
Define scenario reductions expected from GHG
targets interventions in NDCs
Projected emission (total, or sector-specific values to be
of major pollutants supplied by countries according to
national action plans)
Source-receptor matrices
Calculate (calculate changes in downstream
concentration and ambient air concentrations associated
exposure changes Country-level & regional-level
changes in air pollution with reductions in national emissions of
PM, NO2, SO2 and NH3)
Population at risk
Evaluate health Population- Concentration response Health statistics
risk change weighted exposure functions background mortality and
mortality & morbidity morbidity rates
Health effects
Calculate
economic
co-benefit of Economic Health co-benefits of
scenario assessment GHG reductions
Decision analysis
Inform policy maker & stakeholders
CEA & BCA (market vs. benefit trade-off)
Feedback (increase target ambitiousness)
HEALTH BENEFITS OF RAISING AMBITION IN PAKISTAN’S NATIONALLY DETERMINED CONTRIBUTION: WHO TECHNICAL REPORT 11Reduced GHG emissions could be achieved through improvements in energy efficiency; fuel quality standards; shifts to less polluting technologies in power generation or mobility sectors; innovations in industrial manufacturing processes; interventions that target emissions reductions from buildings; actions related to land use and land-use changes and forestry (LULUCF); and encouraging (so-called nudging) environmentally friendly consumer behaviour and government action (e.g. eating less meat, imposing monetary disincentives or taxes). Regarding fossil fuel combustion processes, pollutant reductions from GHG control measures are generally linearly correlated to decreases in carbon emissions. For regions with a large carbon reduction potential from non-fossil fuel sources (e.g. LULUCF), the co-pollutant relationship is non-trivial. Source-receptor (SR) or transfer matrices are used to link changes in emissions into improvements in ambient air quality within the “emitter” country and a downstream location or “receiver country” from reduced transboundary pollutant transport (orange box in Figure 4). In this study, only the health effects across Pakistan (the emitter country) have been calculated. Next, the concentration changes are multiplied by the population at risk for the relevant health outcome, for example children at risk of an asthma attack (dark yellow boxes in Figure 4), to calculate the population-weighted exposure at the country level (leftmost grey box in Figure 4). The health impact assessment combines population exposure with data on illness (morbidity) prevalence and baseline mortality rates (rightmost grey box in Figure 4) and concentration- response functions for morbidity and mortality (central grey box in Figure 4) to calculate the fine particulate matter (PM2.5) associated health effects (brown box in Figure 4). The contribution to PM2.5 from NO2, SO2 and NH3 emissions comes from the production of secondary aerosols; these are the products of chemical reactions in which these precursor pollutants combine with other species present in the atmosphere to produce nitrate and sulphate aerosols. Regarding mortality, premature deaths are calculated using long-term (longer than one year) concentration-response functions. Various morbidity outcomes are considered, including hospital admissions due to cardiopulmonary illnesses, lost workdays (absenteeism), respiratory symptoms in children and adults, and restricted activity (disability) days when a person’s ability to engage in daily routines is disrupted (e.g. having to stay at home from work or school due to minor illness symptoms, or having to go to the doctor’s office or hospital emergency department to seek medical treatment in more severe cases). Finally, the health co-benefits (averted premature deaths and cases of illness) are multiplied by the cost per incidence (e.g. cost per case of asthma in children, or welfare cost per postponed premature death) to calculate the economic co-benefit achieved through national carbon reductions (light blue box in Figure 4). Benefit costs account for avoided expenditures to individuals and the health care system, economic gains in labour productivity, and intangible benefits from social welfare gains associated with positive changes in quality of life from reduced pain and suffering across the affected population. 12 HEALTH BENEFITS OF RAISING AMBITION IN PAKISTAN’S NATIONALLY DETERMINED CONTRIBUTION: WHO TECHNICAL REPORT
Study findings
For the analysis of energy policy reforms on energy demand and GHG emissions in Pakistan, the GSI-IF model was used
to simulate four scenarios: (i) NDC reference case, (ii) BAU (iii) current ambition, and (iv) high ambition.
These correspond to the following assumptions (see Table 1 for details on each scenario):
• The NDC reference case represents a scenario with a fixed baseline in 2020. This is a hypothetical scenario where
no action towards decarbonization is assumed, neither from policy nor from investments. It does not consider
any investment or policy action already happening in the country so that it can be used as the base of inaction.
• BAU represents a scenario in which investments in low-carbon development will continue as in the past
(following the historical trend) but there is no additional policy to increase ambition (i.e. investments are
considered, but no new policies to stimulate further investments are taken into account). For instance, this
scenario assumes that if a vehicle reaches its end of life, it will be replaced with a newer, more efficient one.
This newer vehicle will use the same technology (e.g. internal combustion) but will use fuel more efficiently
and will generate fewer emissions than the vehicle it replaces, according to the technology state of the art. It is
different from the NDC reference case in the sense that it assumes vehicles are maintained and their lifetime is
continuously extended, implying efficiency does not improve over time and the same amount of emissions will
be generated from this and other vehicles.
• The current ambition scenario includes recent policy announcements, including a pledge to dramatically scale
up renewable energy generation capacity and a target of 30% new sales of electric vehicles by 2030 (Iqbal, 2020).
The scenario considers that investment continues its historical trend.
• The high ambition scenario is a hypothetical scenario that assumes higher ambitions concerning renewable
energy, energy efficiency, transport electrification, fuel grade, fossil fuel subsidy reform, and the introduction of
fuel taxes. This scenario implies investment continues its historical trend but policy ambition is higher than the
policies/targets currently approved.
Scenario assumptions for the four scenarios simulated are presented in Table 1.
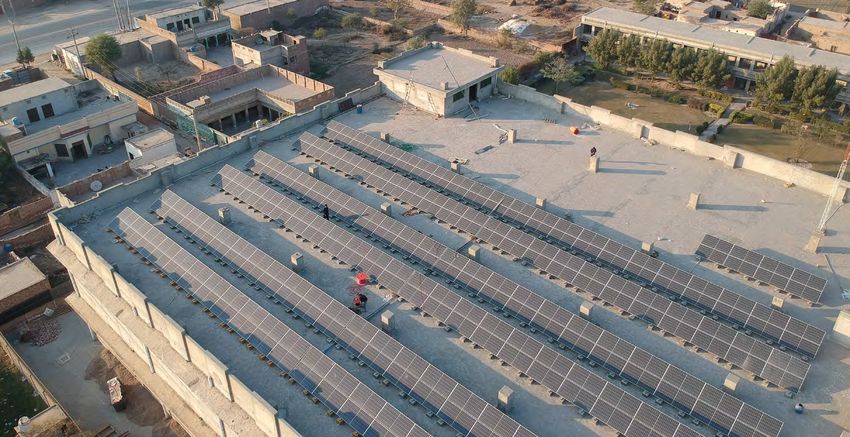
The energy demand projections generated by the model are presented in Figure 5. In the NDC reference case, total
country energy demand is forecasted to increase from 3.51 million TJ per year in 2020 to 4.69 million TJ per year in
2030, and 6.31 million TJ per year in 2050. In the alternative scenarios, the impacts of energy efficiency, renewable
energy, fuel substitution and fossil fuel subsidy reform cause energy demand to change, compared to the NDC
reference case. In the current ambition scenario, energy demand in the years 2030 and 2050 is projected at 4.16 million
TJ per year and 5.35 million TJ per year respectively, which is 11.4% and 31.1% lower compared to the NDC Reference
Case during the same years. In the high ambition scenario, total energy demand peaks around 2030 at an annual
demand of 3.77 million TJ. Between 2030 and 2050, total energy demand is projected to decline from 3.77 million
TJ in 2030 to 3.41 million TJ in 2050, due to increases in energy efficiency. The projected energy demand in the high
ambition scenario is 19.6% and 46.1% lower compared to the NDC reference case in 2030 and 2050 respectively.
For each scenario, the model estimates shares of energy demand by sector. The largest changes are driven by the
electrification of transport and residences. By 2030, in the high ambition scenario, electrification contributes to a slight
reduction (-0.74%) in the transport share in total energy demand compared to the NDC reference case. The residential
sector shows a slight increase of 0.67% in the high ambition scenario compared to the NDC reference case, with GDP
HEALTH BENEFITS OF RAISING AMBITION IN PAKISTAN’S NATIONALLY DETERMINED CONTRIBUTION: WHO TECHNICAL REPORT 13Table 1
Summary of scenario assumptions
Intervention NDC reference case BAU Current ambition High ambition
Renewable energy Same as today 55% by 2030 65% by 2030 75% by 2030
Energy efficiency No change +0.5%/year +1.5%/year +3%/year
Share of new electric vehicle No change 2030: 10% 2030: 30% 2030: 40%
sales 2040: 10% 2040: 90% 2040: 100%
Fuel switching from biomass No change 2.5% by 2030, 5% by 2030, 10% by 2030,
to electricity (households) 7.5% by 2050 15% by 2050 30% by 2050
Fuel grade EURO2 EURO5 EURO5, upgrade vehicle fleet to EURO6 by 2030
Fossil fuel subsidy N/A 100% by 2025
phase out
Fossil fuel tax N/A 10%, implemented between
2025 and 2030
Figure 5
Total energy demand
7,0
6,5
6,0
5,5
5,0
t m/ year
4,5
4,0
3,5
2,5
2,0
2008
2010
2012
2014
2016
2018
2020
2022
2024
2026
2028
2030
2032
2034
2036
2038
2040
2042
2044
2046
2048
2050
Time (Year)
NDC reference BAU
Current ambition (FFSR) High ambition (FFSR + tax)
growth contributing to greater household energy consumption. These trends also influence the shares of energy
demand by fuel type. The electrification of the transport sector and fossil fuel subsidy reform increase the demand
for electricity (+2.5%) and lead to a decline in the shares of petroleum (-0.9%) and natural gas (-1.7%) in total energy
demand compared to the 2030 NDC reference case projections. Increased domestic electrification leads to a further
reduction in total biomass demand in the high ambition scenario (-1.1% vs 2030 BAU).
Baseline energy intensity per million Pakistani Rupees (Rs) in real GDP is projected to decline from 18.5 TJ per million
14 HEALTH BENEFITS OF RAISING AMBITION IN PAKISTAN’S NATIONALLY DETERMINED CONTRIBUTION: WHO TECHNICAL REPORTRs in 2020 to 15.0 TJ per million Rs generated between 2020 and 2050, a decline of 18.9% (see Table 2). In the current
ambition and high ambition scenarios, energy intensity is projected to decline by 11.4% and 19.6% by 2030 respectively
compared to the NDC reference case. Continued implementation contributes to further reductions in energy intensity
by 2050. In 2050, energy intensity per million Rs generated is projected at 10.4 TJ per million Rs in the current ambition
scenario (-31.1% vs NDC reference case) and 8.1 TJ per million Rs in the high ambition scenario (-46.1% vs NDC
reference case).
The model assesses the impacts of energy efficiency and FFSR separately. The results for the impacts of energy
efficiency and the reforming of fossil fuel subsidies in the current ambition and high ambition scenarios are presented
in Figure 6. In the current ambition scenario, total energy demand in 2030 is 11.4% lower compared to the NDC
reference case. energy efficiency (and electrification) and the phase out of fossil fuel subsidies contribute to reductions
of 8.7% and 2.7% respectively. In the high ambition scenario, by 2030 total energy demand is 19.6% lower compared to
the NDC reference case. This is composed of a 15.9% reduction from energy efficiency and electrification, 2.5% from
the phase out of subsidies, and 1.2% from fossil fuel tax.
Table 2
Energy intensity per million Pakistani rupees (TJ/Rs m)
Scenario Unit 2020 2025 2030 2040 2050
NDC reference case TJ/Rs m 18.5 18.0 17.4 16.3 15.0
BAU TJ/Rs m 18.5 17.7 16.9 15.2 13.6
% vs NDC reference case % 0.0% -1.4% -2.9% -6.4% -9.6%
Current ambition TJ/Rs m 18.5 16.8 15.4 12.7 10.4
% vs NDC reference case % 0.0% -6.6% -11.4% -22.0% -31.1%
High ambition TJ/Rs m 18.5 16.1 14.0 10.6 8.1
% vs NDC reference case % 0.0% -10.6% -19.6% -34.6% -46.1%
Figure 6
FFSR impacts on total energy demand – Current ambition and High ambition scenarios
Current ambition High ambition
0% 0%
-4,5% -8,7% -8,5%
-10% -2,1% -2,7% -10% -15,9% -29,8% -40,5%
-18,4% -2,1%
-26,6% -0,0% -2,5%
-20% -3,7% -20%
-1,2%
-4,9%
-30% -30% -3,2%
-3,8%
-40% -40%
-1,6% -1,8%
-50% -50%
2020 2025 2030 2040 2050 2020 2025 2030 2040 2050
Reduction from EE Reduction from FFSR Reduction from tax
HEALTH BENEFITS OF RAISING AMBITION IN PAKISTAN’S NATIONALLY DETERMINED CONTRIBUTION: WHO TECHNICAL REPORT 15You can also read