Report for Tasmanian Residential Electricity Prices - How Do They Compare? - Goanna Energy
←
→
Page content transcription
If your browser does not render page correctly, please read the page content below
Report for

Tasmanian Residential Electricity
Prices – How Do They Compare?

                            February 2021
                   Goanna Energy Consulting
                         ABN: 31 674 232 899
                       PO Box 30 Sandy Bay
                             Tasmania 7006
                               03 6223 7253
                  marc@goannaenergy.com.au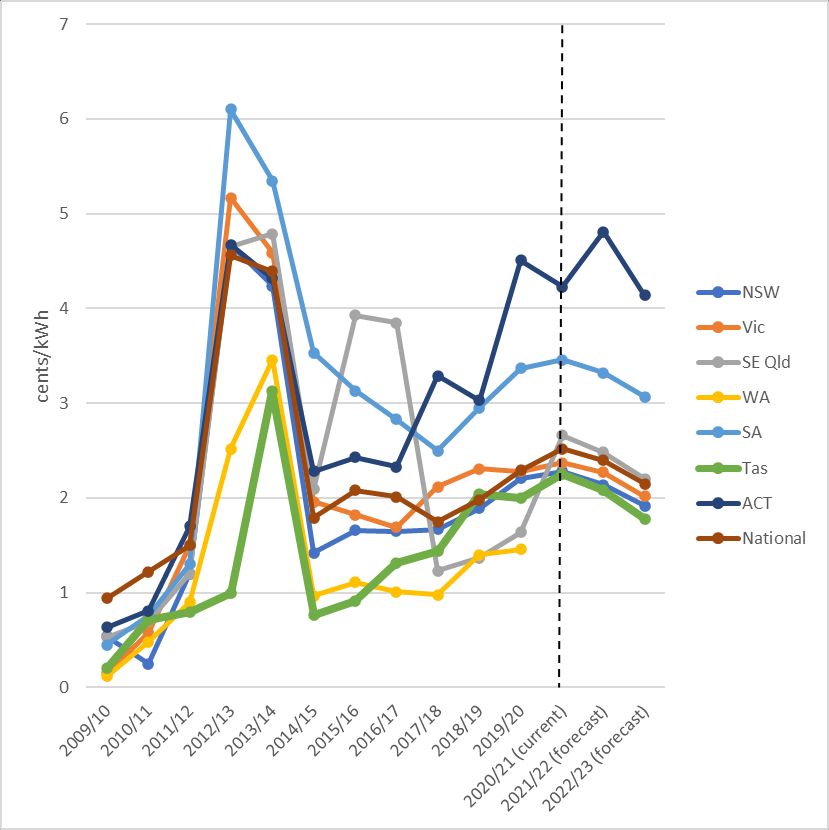
Tasmanian Residential Electricity Price Comparisons
                                                                                                            Page 1

Acknowledgement and Disclaimer
We wish to acknowledge the support of the Tasmanian Council of Social Services
(TasCOSS) in commissioning us to undertake this project. However, the views expressed in
this document do not necessarily reflect the views of TasCOSS.
This evaluation does not constitute personal financial product advice. It has been prepared
without taking into account the personal financial circumstances, financial needs or
objectives. Accordingly, readers should undertake their own independent enquiries and
seek their own legal or financial advice prior to entering into any contract.
All reasonable care has been exercised in the data gathering, calculations and investigation
of the consumptions and costs for the Client’s project. However, Goanna and its agents
cannot be held responsible for errors in information and data supplied by others.
This project was funded by Energy Consumers Australia
(www.energyconsumersaustralia.com.au) as part of its grants program for consumer
advocacy projects and research projects for the benefit of consumers of electricity and
natural gas. However, the views expressed in this document do not necessarily reflect the
views of Energy Consumers Australia.

Ownership of Intellectual property

Goanna owns all intellectual property developed and delivered in relation to this scope of
work. Copyright of this proposal, analysis systems, documents, evaluation software and
report format remain the property of Goanna Energy Consulting Pty Ltd.

Limitations of Analysis

The analysis provided has a number of inherent limitations, including but not limited to the
following.
The analysis is based on historic information. Market, policy and regulatory changes are
likely to impact on future energy prices, therefore this analysis has inherent limitations.
All prices are expressed exclusive of GST.

Further Contact

Goanna Principal Consultant, Marc White may be contacted on mobile 0418 596 162 or
email marc@goannaenergy.com.au.
Alternate contact is Goanna Affiliate Consultant, Roman Domanski. He may be contacted on
0419 10 11 14 or e-mail roman@goannaenergy.com.au.

Citation: Goanna Energy Consulting, Tasmanian Residential Electricity Prices – how do they
compare?, Report for TasCOSS, February 2021

                                                                        Copyright Goanna Energy Consulting Pty Ltd
PO Box 30, Sandy Bay, Tasmania 7006 AUSTRALIA
Telephone (03) 6223 7253, Fax (03) 6223 7270 Mobile Marc 0418 596 162              ACN: 127 924 190 ABN: 31 674 232 899
E-Mail: marc@goannaenergy.com.au                                                  Web: www.goannaenergy.com.au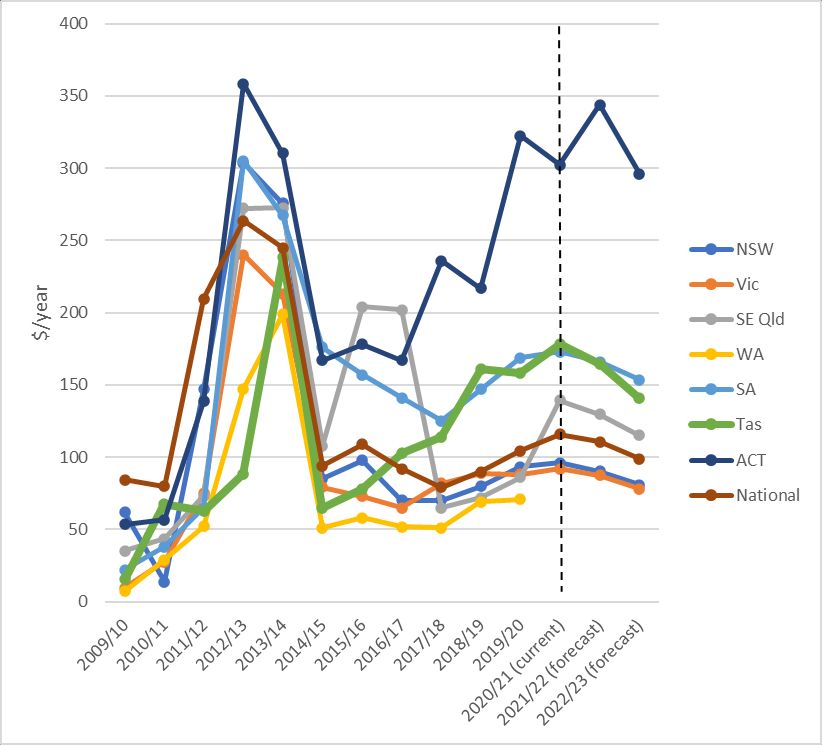
Tasmanian Residential Electricity Price Comparisons
                                                                                                            Page 1

KEY POINTS
        •   We undertook an analysis for TasCOSS of Tasmanian residential electricity prices
            compared to six mainland jurisdictions.
        •   We assessed seven options to do this and used the AEMC annual price trends
            reports as it was the best option to meet the project scope in a realistic way. This
            was an ‘on balance’ decision as no single series was perfect.
        •   We found that relying on residential electricity prices alone did not provide a good
            enough basis for comparison. Electricity bills are equally, if not more, important for
            advocacy purposes and resonate more with residential electricity consumers.
        •   Our report shows that Tasmanians have historically had access to among the lowest
            electricity prices in the country. They currently have the second lowest electricity
            prices and the second lowest regulated prices.
        •   So, the Government’s promise of Tasmania having the lowest regulated electricity
            prices in the country by 2022 has not yet been delivered, but it is within reach.
        •   However, the Government’s promise is not particularly meaningful to Tasmanian
            households. Regulated prices are not a good benchmark for jurisdictional
            comparisons. Market prices overwhelmingly apply outside Tasmania and, in any
            case, electricity bills rather than prices are what households are focused on.
        •   Tasmanians currently pay the highest electricity bills in the country and historically
            have had high bills. This reflects the high level of electricity consumption in
            Tasmania, which is driven by factors such as a relatively cool climate and a low
            penetration of natural gas.
        •   It would be better if the Government’s promise were adjusted to reflect this. In our
            view the policy should be based around the aim of Tasmania having the most
            affordable and competitively-priced electricity in the country.
        •   To reduce Tasmania’s high electricity bills requires continued attention to lower
            prices, as well as lowering consumption through greater energy efficiency.
        •   Our results show that ongoing advocacy by TasCOSS on all elements of electricity
            bills – wholesale, network, green scheme and retail charges – will be necessary to
            focus policy on the delivery of lower electricity prices and bills to Tasmanians.
        •   The best and most immediate opportunities appear to be attention to focus effort on
            wholesale and retail charges as regulated wholesale and retail costs are high
            compared to elsewhere in the NEM.
        •   The Government’s residential price cap and approach to regulating wholesale prices
            has been well intentioned and initially benefitted Tasmanians. However, with
            Victorian wholesale market prices having now reduced to record lows, Tasmanians
            are currently paying far more than if Victorian wholesale market prices applied.
            Taken over the current policy’s four-year life, Tasmanians paid lower electricity
            prices in the beginning, but are now paying higher prices, although they have had
            more stable prices.
        •   Our assessment of Government electricity concessions paid to disadvantaged
            consumers (we only assessed the main concession), showed that Tasmania has the
            second highest concession by value and that after the concession is applied, their
            bills reduce significantly. This bridges some of the gap between high Tasmanian
            bills and those on the mainland. However, concession holder bills are still the third
            highest in the country.
        •   We have highlighted numerous advocacy issues and made 12 associated
            recommendations for TASCOSS to consider in terms of its electricity advocacy.

                                                                        Copyright Goanna Energy Consulting Pty Ltd
PO Box 30, Sandy Bay, Tasmania 7006 AUSTRALIA
Telephone (03) 6223 7253, Fax (03) 6223 7270 Mobile Marc 0418 596 162              ACN: 127 924 190 ABN: 31 674 232 899
E-Mail: marc@goannaenergy.com.au                                                  Web: www.goannaenergy.com.au
Tasmanian Residential Electricity Price Comparisons
                                                                                                            Page 2

EXECUTIVE SUMMARY
Electricity prices in Tasmania have been a matter of concern to consumers and their
advocates for at least the past decade. Cost of living pressures and periods of significant
increases in electricity prices, seen by households in their electricity bills, has heightened
these concerns, with vulnerable consumers among the worst impacted. To better
understand these concerns, TasCOSS commissioned us to undertake an analysis of
Tasmanian electricity prices and compare them to those in other parts of Australia.

Which electricity price series and consumption measures to use
We undertook a detailed assessment of five available measures that allow Tasmanian (Tas)
residential electricity prices and annual electricity bills to be compared with those from
mainland jurisdictions, namely New South Wales (NSW), Victoria (Vic), South East
Queensland (SE Qld), Western Australia (WA), South Australia (SA) and the Australian
Capital Territory (ACT). However, none provide a perfect measure, so we had to make an
‘on balance’ decision about which series to use.
We assessed each series against a common set of criteria that reflected the needs of the
study. This informed our decision to rely primarily on information provided by the Australian
Energy Market Commission’s (AEMC) annual Energy Price Trends Reports, supplemented
where relevant by the St Vincent De Paul Society (SVDP) Tariff Tracker and Office of the
Tasmanian Economic Regulator (OTTER) electricity price comparisons.
We also discussed the important role that differences in electricity consumption play in
influencing electricity bills and favoured the use of jurisdictional specific average annual
consumption levels over a uniform level of average household electricity consumption in
comparing electricity bills. The AEMC series uses estimated average consumption levels for
each jurisdiction. Tasmania has the highest household electricity consumption levels in
Australia and this has a significant impact on household electricity bills.
How Residential Electricity Prices are Set
Residential electricity prices in Tasmania are primarily set by regulation through the
independent regulator, OTTER, using information on each component of an electricity bill –
wholesale costs, network charges, environmental (green) scheme costs and retail costs.
This provides Aurora Energy with an annual maximum revenue allowance, from which it
develops retail tariffs for small customers that enable it to collect this revenue.
Wholesale costs are normally set with reference to the Victorian (load following swap)
market determined price recognising the strong links between Tasmanian and Victorian
wholesale prices. But these prices are volatile. In 2017 Victorian wholesale prices spiked,
particularly due to the imminent closure of the large Hazelwood brown coal power station in
Victoria. The Tasmanian Government responded by placing a cap on retail price increases
of no more than the Hobart CPI and by allowing the Treasurer to step in and determine a
Tasmanian wholesale price to be used by OTTER in setting Aurora’s revenue for the next
year. These arrangements are due to expire on 30 June 2021. In 2018, the Government
gave a commitment that Tasmania would have the lowest regulated electricity prices in the
country by 2022.

                                                                        Copyright Goanna Energy Consulting Pty Ltd
PO Box 30, Sandy Bay, Tasmania 7006 AUSTRALIA
Telephone (03) 6223 7253, Fax (03) 6223 7270 Mobile Marc 0418 596 162              ACN: 127 924 190 ABN: 31 674 232 899
E-Mail: marc@goannaenergy.com.au                                                  Web: www.goannaenergy.com.au
Tasmanian Residential Electricity Price Comparisons
Page 3
In their first two years (2017/18 and 2018/19), with high Victorian wholesale prices, these
arrangements worked to lower Tasmanian household electricity prices. However, Victorian
wholesale prices have now softened considerably. With a muted regulatory response to
lower Victorian wholesale market prices, the setting of wholesale prices in Tasmania has not
worked as well since, with Tasmanian households paying almost the same in 2019/20 and
around 10 per cent more in 2020/21 for their power than they would have if the Victorian
wholesale market price had applied. However, the policy has delivered less price volatility,
which is also important to residential consumers.
This highlights one of the risks for consumers of the Tasmanian regulated wholesale price
arrangements. The Ministerial determination of wholesale prices and setting them a year
ahead of actual outcomes will not always work to benefit consumers. The wholesale price of
electricity in Tasmania also lacks transparency. We have highlighted several other issues
associated with the arrangements that would be worth examining further.
In other parts of the NEM, residential electricity prices are primarily set through the market,
relying on competition between retailers. However, in NSW, Vic, SE Queensland and SA
regulators determine default market offers that each retailer must offer customers. These
have replaced retailer determined standing offers. In the ACT the regulator determines the
standing offer, whilst in WA the Government sets a uniform retail price. The recent entry of
several new retailers into the Tasmanian market has seen market offers of around 5-7 per
cent below Aurora’s offer being made available.
Tasmanian Residential Electricity Prices and Bills
Tasmanian electricity prices and electricity bills for a typical household increased
significantly from 2010/11 and 2012/13 driven by across-the-board increases in wholesale,
network and retail costs. The next three years saw significant declines in both prices and
bills, after which they began to increase again and have continued to do so until 2019/20.
The large spike in prices early in the period continues to be felt by households with annual
bills rising from $1,337 to $1,945 over the period 2009/10 to 2019/20, a 45 per cent increase,
more than double the Hobart rate of inflation over the same period of 22 per cent.
Our examination of the components of Tasmanian residential electricity bills (the bill stack)
showed that all four components – wholesale, network, green schemes and retail – have at
times contributed to the higher electricity prices/bills. We believe that TasCOSS should
therefore focus its attention and advocacy on all four components.
How Do Tasmanian and Mainland Residential Electricity Prices and Bills Compare?
We undertook a comparison of Tasmanian prices and bills with the mainland jurisdictions of
NSW, Victoria, SE Queensland, WA, SA and the ACT. In 2020/21, Tasmania has the
second lowest average prices but the highest annual bills, reflecting the relatively high
consumption of electricity by Tasmanian households. Bills are what matters most to
households and ensuring energy remains affordable. This price-bill dichotomy means that
the State Government must have policies that keep power prices and energy use as low as
possible to help offset its high consumption disadvantage. Our analysis suggests that they
have been partly successful in moderating prices but taken limited action on energy use and
energy affordability. Tasmanians would benefit if the Government maintained a commitment
to low electricity prices and also focused more on energy use and affordability in future.
Copyright Goanna Energy Consulting Pty Ltd
PO Box 30, Sandy Bay, Tasmania 7006 AUSTRALIA
Telephone (03) 6223 7253, Fax (03) 6223 7270 Mobile Marc 0418 596 162 ACN: 127 924 190 ABN: 31 674 232 899
E-Mail: marc@goannaenergy.com.au Web: www.goannaenergy.com.auTasmanian Residential Electricity Price Comparisons
Page 4
Tasmania had the second lowest electricity prices in 2009/10, after which its prices
increased markedly until 2011/12, before declining and then increasing again until 2019/20
but at a slower rate. Residential electricity prices in SE Queensland, which declined rapidly
from 2016/17, are now lower than in Tasmania. Forecasts suggest that expected price
declines in SE Queensland will outpace those in Tasmania over 2021/22 and 2022/23, with
the former continuing to have the lowest residential electricity prices.
In terms of trends in annual average residential electricity bills, Tasmania has had the
highest bills for most of the period examined, including in 2020/21. Forecasts suggest that
the ACT will have higher bills by 2021/22.
OTTER and the SVDP Tariff Tracker rank Tasmanian residential electricity bills in the mid-
range as they both use uniform consumption levels across all jurisdictions.
The Story Behind the Jurisdictional Comparisons
The story behind these jurisdictional relativities can be gleaned from the price and bill stack
for residential electricity consumers, that is, the wholesale, network, green and retail costs.
Wholesale prices usually make up around 35 per cent of electricity bills nationally and in
Tasmania. From 2009/10 until 2012/13 Tasmanian wholesale prices increased rapidly, but
since 2016/17 they have consistently been among the lowest of all the jurisdictions
assessed, closely followed by SE Queensland. Declines in SE Queensland were particularly
sharp and by 2020/21 SE Queensland has overtaken Tasmania to record the lowest
wholesale prices.
Wholesale prices across the NEM, including in Tasmania, increased significantly in 2016/17
and 2017/18, reflecting the impact of the closure of the major Hazelwood brown coal power
station in Victoria and (in Tasmania) low dam levels and a prolonged outage of BassLink.
They have since softened and the outlook for wholesale prices is for a further decline in
2020/21 but an increase in 2022/23 in most jurisdictions, including Tasmania.
Turning to the impact of wholesale prices on electricity bills, Tasmania’s ranking has
fluctuated from mid- to high-ranking over the period assessed. It currently has the second
lowest wholesale costs, but the highest wholesale bill component. The increases in
wholesale prices referred to above also impacted electricity bills significantly. Forecast
declines in wholesale prices are expected to result in further reductions in the wholesale
component of residential bills in most of the NEM in 2021/22, including in Tasmania.
Tasmanian wholesale costs are currently around $280 higher than in Victoria,
notwithstanding the regulated nature of wholesale prices in Tasmania and their mandated
close links to Victorian prices.
In 2020/21, network charges make up 46 per cent of an average household electricity bill
nationally and 40 per cent in Tasmania. Tasmanian network charges were the second
highest in the country in 2009/10 (9.80 c/kWh) and by 2020/21 had fallen to the second
lowest (9.71 c/kWh). In the intervening period they increased dramatically until 2011/12 but
declined thereafter. A range of national regulatory imperfections made a significant
contribution to increases in network charges across all jurisdictions immediately after
2009/10. While some have been improved since, shortcomings remain and TasCOSS
should maintain strong interest in TasNetworks’ next determinations. Looking forward to
Copyright Goanna Energy Consulting Pty Ltd
PO Box 30, Sandy Bay, Tasmania 7006 AUSTRALIA
Telephone (03) 6223 7253, Fax (03) 6223 7270 Mobile Marc 0418 596 162 ACN: 127 924 190 ABN: 31 674 232 899
E-Mail: marc@goannaenergy.com.au Web: www.goannaenergy.com.auTasmanian Residential Electricity Price Comparisons
Page 5
2022/23, Tasmanian network prices are expected to increase, with TasNetworks’ previous
cost reductions abating.
In terms of the contribution of networks charges to bills, Tasmania ranks second highest and
is forecast to remain there. This reflects high levels of electricity consumption, a dispersed
network and inefficiency within TasNetworks, especially in distribution (as shown by AER
benchmarking). Tasmanian residential consumers are currently paying $304 (40 per cent)
more per year than Victorian households for network charges.
Federal and jurisdictional Green Schemes have become a feature of the Australian
electricity market over the past two decades. At the Federal level, the Renewable Energy
Target (RET) supports large-scale (wind) and small-scale (solar) renewables, whilst all
jurisdictions have solar feed-in-tariffs and NSW, Victoria and SA have energy efficiency
schemes in place. The cost of these schemes flows through to customers via retailers.
In 2020/21 Tasmania ranks as the lowest jurisdiction in terms of the impact of Green
Scheme costs on prices, with scheme costs kept lower by the absence of any State
schemes in the AEMC’s measurement of Tasmanian electricity prices. However, its high
electricity consumption meant that Tasmania ranks second highest in terms of the impact of
green schemes on bills. Currently Tasmanian residential consumers pay $178 annually in
Green Scheme costs. Forecasts suggest a fall in green scheme costs over 2021/22 and
2022/23 across all jurisdictions, including in Tasmania.
Retail costs, the final component, which account for 16 per cent of residential electricity bills
in Tasmania but only 11 per cent nationally. In Tasmania, the retail component amounts to
3.96 c/kWh in 2020/21, making it the second highest in the country, whilst it contributed $302
annually to a Tasmanian residential electricity bill, also the second highest. Annual retail
costs were as low as $102 in 2009/10.
While the small Tasmanian market adversely impacts on economies of scale, which are
important in retailing, Tasmanian retail costs may also be relatively high due to Aurora’s
dominant position, and it being allowed a retail margin and CARC more akin to a competitive
market. These are issues that TasCOSS could consider examining further.
COVID19 has impacted household electricity consumption and increased bills. Jurisdictions
and regulators have responded by providing financial assistance to impacted consumers,
boosting concessions, capping electricity prices and through regulatory measures.
Tasmanian consumers and concessions holders appear to have received less support than
elsewhere.
Impact of Electricity Concessions on Electricity Bills
Various electricity concessions provided by all jurisdictions are an important way in which the
cost of electricity is reduced to vulnerable and disadvantaged consumers. Given this, we
undertook an analysis of the impact of the main electricity concessions in each jurisdiction
on electricity bills and how Tasmania’s concessions compare.
Concessions have the desirable effect of reducing electricity bills for the most vulnerable
sections of the community. However, there is quite significant variation in the value of
concessions across jurisdictions. Tasmania’s main electricity concession is the second
highest at $514 pa, which equates to a 26.8 per cent discount off a typical concession
holder’s annual electricity bill (this percentage discount ranked as the third highest).
Copyright Goanna Energy Consulting Pty Ltd
PO Box 30, Sandy Bay, Tasmania 7006 AUSTRALIA
Telephone (03) 6223 7253, Fax (03) 6223 7270 Mobile Marc 0418 596 162 ACN: 127 924 190 ABN: 31 674 232 899
E-Mail: marc@goannaenergy.com.au Web: www.goannaenergy.com.auTasmanian Residential Electricity Price Comparisons
Page 6
Our analysis also showed that concessions have a desirable impact in evening up electricity
bills across jurisdictions, as those with the highest bill generally also have the largest
concessions. Tasmania ranks as the jurisdiction with the highest bills before the application
of the concession and the second highest post-concession. Its relatively high concession
results in a significant reduction in the gap between bills for Tasmanian concession holders
compared to all jurisdictions (apart from the ACT).
Our analysis of concessions, whilst useful, would be strengthened if it were extended to
several other areas identified in Section 7.3.
Policy and Advocacy Issues
The Tasmanian Government has made a commitment to have “the lowest regulated
electricity prices in Australia by 2022”. OTTER analysis shows that it had the second lowest
regulated prices in June 2020. This is, however, a commitment with limited value to
consumers given that regulated prices in other parts of the NEM are little used by
consumers. Market prices are far more common and electricity bills have more meaning to
households. While a future Government commitment linked to electricity could be useful to
Tasmanian households, one that is linked to the lowest market prices and the annual
household electricity bill would be preferable. TasCOSS could usefully focus its advocacy of
both bills and prices, as well as improvements in energy use. In our view the policy should
be based around the aim of Tasmania having the most affordable and competitively-priced
electricity in the country.
The current price cap and wholesale price regulatory arrangements are due to expire on 30
June 2021. It is not yet known what will replace them, or if Tasmania will delink permanently
from the NEM wholesale market. Given their importance to household consumers,
TasCOSS should advocate on these policy issues to the Government and Treasury,
ensuring that its efforts are well informed.
Section 8.3 has identified several shortcomings in the existing available household electricity
price comparison series. It would be useful if TasCOSS advocated to close these gaps to
improve both the price comparisons and the ability of household and disadvantaged
consumers (as well as advocates) to access better and more timely comparative information
about electricity prices.
Further work on energy concessions and COVID19 measures focused on their impacts on
consumers, along the lines outlined in this report could provide valuable information for
TasCOSS advocacy on these areas and help improve its effectiveness.
Recommendations
We have provided TasCOSS with 12 focused recommendations that emerge from this report
(see Section 9.2).
Copyright Goanna Energy Consulting Pty Ltd
PO Box 30, Sandy Bay, Tasmania 7006 AUSTRALIA
Telephone (03) 6223 7253, Fax (03) 6223 7270 Mobile Marc 0418 596 162 ACN: 127 924 190 ABN: 31 674 232 899
E-Mail: marc@goannaenergy.com.au Web: www.goannaenergy.com.auTasmanian Residential Electricity Price Comparisons
Page 7
CONTENTS
Key Points............................................................................................................................. 1
Executive Summary .............................................................................................................. 2
Abbreviations ...................................................................................................................... 10
1 Introduction .................................................................................................................. 11
2 Project Scope, Outcomes and Objectives .................................................................... 12
3 Assessment of Residential Electricity Price Information ............................................... 14
3.1 Which Comparison Series is Most Fit-for-Purpose? .............................................. 15
3.2 A Word About Electricity Consumption.................................................................. 15
4 How Residential Electricity Prices Are Determined ...................................................... 18
4.1 Setting Tasmanian Residential Electricity Prices ................................................... 18
4.2 Tasmanian Government’s Regulated Electricity Price Cap, Wholesale Price Orders
and Lowest Regulated Electricity Price Commitment ....................................................... 19
4.3 What Happens in Mainland Jurisdictions?............................................................. 22
5 Tasmanian Residential Electricity Prices ...................................................................... 23
5.1 Tasmanian Residential Electricity Price Trends .................................................... 23
5.2 The Story Behind Tasmanian Electricity Price Trends ........................................... 25
6 Tasmanian Residential Electricity Prices Compared to the Mainland ........................... 29
6.1 Residential Electricity Prices and Annual Bills ....................................................... 29
6.1.1 Current Residential Electricity Prices and Annual Bills ................................... 29
6.1.2 Trends in Residential Electricity Prices and Bills ............................................ 30
6.2 The Story Behind the Jurisdictional Comparisons ................................................. 33
6.2.1 Wholesale Prices ........................................................................................... 34
6.2.2 Network Charges ........................................................................................... 36
6.2.3 Green Scheme Costs..................................................................................... 38
6.2.4 Retail Costs ................................................................................................... 41
6.3 COVID19 Electricity Impacts and Support Measures ............................................ 44
7 Comparison of Residential Electricity Concessions ...................................................... 45
7.1 Value of Main Jurisdictional Electricity Concessions ............................................. 45
7.2 Impact of Main Jurisdictional Concessions on Electricity Bills ............................... 46
7.3 Assessment of the Impact of Concessions ............................................................ 47
8 Policy and Advocacy Issues ......................................................................................... 49
8.1 Do Tasmanian Households Enjoy the Lowest Electricity Prices in Australia? ........ 49
8.2 The Residential Electricity Price Cap, Wholesale Price Regulation and Delinking
from the NEM .................................................................................................................. 51
Copyright Goanna Energy Consulting Pty Ltd
PO Box 30, Sandy Bay, Tasmania 7006 AUSTRALIA
Telephone (03) 6223 7253, Fax (03) 6223 7270 Mobile Marc 0418 596 162 ACN: 127 924 190 ABN: 31 674 232 899
E-Mail: marc@goannaenergy.com.au Web: www.goannaenergy.com.auTasmanian Residential Electricity Price Comparisons
Page 8
8.3 Need for Further Work on Tasmanian Residential Electricity Price Comparisons .. 51
8.4 COVID19 Electricity Measures .............................................................................. 52
8.5 Residential Electricity Concession Issues ............................................................. 52
9 Conclusions, Findings and Recommendations ............................................................. 54
9.1 Assessment of Our Results Against the Study Scope, Objectives and Outcomes . 54
9.2 Recommendations ................................................................................................ 57
Appendix A. Available Measures of Australian Electricity Prices..................................... 59
AEMC Electricity Price Trends Report ............................................................................. 59
SVDP Tariff Tracker ........................................................................................................ 61
OTTER Price Comparisons ............................................................................................. 62
AER Retail Electricity Price Comparisons ........................................................................ 65
ABS Electricity Price Index .............................................................................................. 65
Government Website Comparators ................................................................................. 65
Private Website Comparators .......................................................................................... 66
Appendix B. Electricity Consumption Estimates Used in This Report ............................. 67
References ......................................................................................................................... 69
FIGURES
Figure 1: Trends in Tasmanian Household Electricity Prices ............................................... 24
Figure 2: Trends in Tasmanian Household Electricity Annual Bills ...................................... 24
Figure 3: Components of Electricity Bill Stack for a Typical Tasmanian Household ............. 25
Figure 4: Trends in the Tasmanian Electricity Bill Stack and Total Annual Electricity Bill for a
Typical Household .............................................................................................................. 26
Figure 5: Contributions to the Change in Tasmanian Residential Electricity Bills, 2009/10 to
2020/21 ............................................................................................................................... 27
Figure 6: Contributions to the Change in Tasmanian Residential Electricity Bills, 2009/10 to
2016/17 and 2017/17 to 2020/21 ........................................................................................ 28
Figure 7: Residential Electricity Prices, Tasmania and the Mainland, 2020/21 .................... 30
Figure 8: Annual Residential Electricity Bills, Tasmania and the Mainland, 2020/21 ........... 30
Figure 9: Trend in Residential Electricity Prices, Tasmania and Mainland Jurisdictions ...... 31
Figure 10: Trend in Residential Electricity Annual Bills, Tasmania and Mainland Jurisdictions
........................................................................................................................................... 33
Figure 11: Wholesale Price Trends, Tasmania and the Mainland ........................................ 35
Figure 12: Impact of Wholesale Costs on Residential Electricity Bills, Tasmania and the
Mainland ............................................................................................................................. 36
Figure 13: Trends in Network Charges, Tasmania and the Mainland .................................. 37
Figure 14: Impact of Network Charges on Annual Residential Bills, Tasmania and the
Mainland ............................................................................................................................. 39
Copyright Goanna Energy Consulting Pty Ltd
PO Box 30, Sandy Bay, Tasmania 7006 AUSTRALIA
Telephone (03) 6223 7253, Fax (03) 6223 7270 Mobile Marc 0418 596 162 ACN: 127 924 190 ABN: 31 674 232 899
E-Mail: marc@goannaenergy.com.au Web: www.goannaenergy.com.auTasmanian Residential Electricity Price Comparisons
Page 9
Figure 15: Impact of Green Schemes on Residential Electricity Prices, Tasmania and the
Mainland ............................................................................................................................. 40
Figure 16: Impact of Green Schemes on Residential Electricity Bills, Tasmania and the
Mainland ............................................................................................................................. 41
Figure 17: Impact of Retail Costs on Residential Electricity Prices, Tasmania and the
Mainland ............................................................................................................................. 43
Figure 18: Impact of Retail Costs on Residential Electricity Bills, Tasmania and the Mainland
........................................................................................................................................... 43
Figure 19: Value of Main Electricity Concessions by Jurisdiction, 2020/21 .......................... 46
Figure 20: Impact of Main Electricity Concessions on Annual Electricity Bills by Jurisdiction,
2020/21 ............................................................................................................................... 47
TABLES
Table 1: Price Comparison Series Assessed Against Key Criteria ...................................... 16
Table 2: Wholesale Prices Under the Tasmanian Residential Price Cap ............................. 21
Table 3: Main Electricity Concession by Jurisdiction ........................................................... 45
Table B 1: Electricity Consumption Estimates ..................................................................... 67
Copyright Goanna Energy Consulting Pty Ltd
PO Box 30, Sandy Bay, Tasmania 7006 AUSTRALIA
Telephone (03) 6223 7253, Fax (03) 6223 7270 Mobile Marc 0418 596 162 ACN: 127 924 190 ABN: 31 674 232 899
E-Mail: marc@goannaenergy.com.au Web: www.goannaenergy.com.auTasmanian Residential Electricity Price Comparisons
Page 10
ABBREVIATIONS
ABS Australian Bureau of Statistics
ACT Australian Capital Territory
AEMC Australian Energy Market Commission
AER Australian Energy Regulator
c/kWh Cents per kilo Watt hour
CARC Customer Acquisition and Retention Costs
CER Clean Energy Regulator
CPI Consumer Price Index
DMO Default Market Offer
FiT Feed-in-Tariffs
Goanna Goanna Energy Consulting Pty Ltd
kW kilo Watt
kWhpa Kilo Watt hours per annum
LRET Large Renewable Energy Target
MLF Marginal Loss Factors
MW Mega Watt
MWh Mega Watt hour
NEM National Electricity Market
NMR Notional Maximum Revenue
NSW New South Wales
NT Northern Territory
OTTER Office of the Tasmanian Economic Regulator
RET Renewable Energy Target
SA South Australia
SE Qld South East Queensland
SRES Small-scale Renewable Energy Scheme
SVDP St Vincent De Paul Society
Tas Tasmania
TasCOSS Tasmanian Council of Social Services
ToU Time-of-Use Tariff
VDO Victorian Default Offer
Vic Victoria
WA Western Australia
WEC Wholesale electricity cost
WEP Wholesale electricity price
Copyright Goanna Energy Consulting Pty Ltd
PO Box 30, Sandy Bay, Tasmania 7006 AUSTRALIA
Telephone (03) 6223 7253, Fax (03) 6223 7270 Mobile Marc 0418 596 162 ACN: 127 924 190 ABN: 31 674 232 899
E-Mail: marc@goannaenergy.com.au Web: www.goannaenergy.com.auTasmanian Residential Electricity Price Comparisons
Page 11
1 INTRODUCTION
Electricity prices in Tasmania have been a matter of concern to consumers and their
advocates for most of the past decade. Cost of living pressures and periods of significant
increases in electricity prices, seen by households in their electricity bills, has heightened
these concerns. Electricity prices have placed additional pressure on household budgets.
Vulnerable and disadvantaged consumers have been even more severely impacted. These
pressures have remained real and foremost in the minds of Tasmanian electricity
consumers, notwithstanding important steps taken by the Tasmanian Government to help
relieve electricity price pressures.
One question that emerges from these pressures is how do the prices Tasmanian
households pay for their electricity compare to the rest of Australia? Are Tasmanian
electricity prices fair and affordable, or are they too high? Are socially disadvantaged
consumers disproportionately impacted?
Bearing the above in mind, TasCOSS has commissioned Goanna Energy Consulting Pty Ltd
(Goanna) to undertake an analysis of Tasmanian electricity prices and compare them to
those in other parts of Australia. This report presents the results of our analysis, raises
issues based on that assessment and makes a series of associated recommendations for
TasCOSS to consider.
The Report is structured as follows:
• Section 2 sets out the scope of the assignment, its objectives and desired outcomes,
and notes some limitations on the original scope.
• Section 3 discusses the various publicly available measures of electricity prices in
Australia and assesses their usefulness in terms of this study.
• In Section 4, we describe how electricity prices in Tasmania and in other jurisdictions
included in this study are set.
• Section 5 assesses and discusses Tasmanian electricity prices and annual bills, their
trends over the past decade and their composition in terms of the electricity supply
chain.
• We then go on (in Section 6) to place Tasmanian electricity prices in a national
context (historically and forward looking), where we compare trends in Tasmanian
prices and annual bills with those in other Australian jurisdictions, as well as
assessing the contribution of the various supply chain components of electricity
prices/bills to changes in jurisdictional electricity prices and rankings.
• The impact of electricity concessions on electricity bills in Tasmania and in other
jurisdictions is assessed in Section 7.
• A range of relevant electricity policy and advocacy issues are raised in Section 8,
including those related to Tasmania’s relative electricity prices/bills, the current
Tasmanian electricity price cap and the setting of wholesale prices, electricity
concession issues and the need for further work to develop better price information.
• Finally, our conclusions and recommendations are presented in Section 9, including
an assessment of these in terms of the study’s scope, objectives and outcomes.
Copyright Goanna Energy Consulting Pty Ltd
PO Box 30, Sandy Bay, Tasmania 7006 AUSTRALIA
Telephone (03) 6223 7253, Fax (03) 6223 7270 Mobile Marc 0418 596 162 ACN: 127 924 190 ABN: 31 674 232 899
E-Mail: marc@goannaenergy.com.au Web: www.goannaenergy.com.auTasmanian Residential Electricity Price Comparisons
Page 12
2 PROJECT SCOPE, OUTCOMES AND OBJECTIVES
Goanna has been asked by TasCOSS to address the following matters in this report (the
scope):
1. How should Tasmanian electricity prices be measured and compared with those
in other parts of the country to obtain a meaningful and robust price comparison?
2. Is such a comparison possible using only existing data?
3. What are the differences/benefits of current measures such as Tariff Tracker,
Energy Made Easy, Energy Compare Victoria, other private comparator
sites/tools, Australian Energy Regulator (AER) State of the Energy Market
reports, Australian Energy Market Commission annual pricing reports, Office of
the Tasmanian Economic Regulator (OTTER) standing offer reports and the like?
4. Would Tasmanian consumers receiving the lowest regulated price in the country
be better-off than customers on unregulated prices elsewhere in the NEM?
Would the outcome of this analysis differ for low income and vulnerable
consumers, household consumers in the broad and smaller consumers in
general? Are any non-price factors relevant to such an assessment?
5. What do the results of the research say about the Tasmanian Government’s
current policy of capping residential electricity prices compared to alternative
approaches?
6. Is the current approach of using the wholesale cost of power in Tasmania to set
the wholesale price in the best interests of household consumers, or would
consumers be better off with an alternative approach, e.g., using the Victorian
wholesale market price?
7. What avenues and processes might TasCOSS have to feed the research findings
into the price setting, policy and regulatory processes both in Tasmania and
nationally? What gaps might need to be overcome to make TasCOSS advocacy
in this regard as credible as possible?
We previously indicated that the original scope as outlined above will be difficult to complete
given the resources currently available for the project, but we have partially delivered on the
scope and have used our best endeavours to do so. However, gaps remain. Where this is
the case, we have identified a way forward for the scope to be fully completed and raised
other relevant issues. In any case, we believe that the contents of this report will be useful
to TasCOSS in undertaking initial advocacy on Tasmanian residential electricity prices.
TasCOSS can seek to broaden and deepen the analysis to overcome remaining gaps.
Based on this scope, TasCOSS identified the following outcomes from the project:
a. That Tasmanian consumers, the Tasmanian Government and other stakeholders are
well-informed of Tasmania’s electricity prices relative to the NEM.
b. That Tasmanian and interstate prices are easily compared using a pricing
tool/measure.
c. That energy affordability is improved by influencing the price-setting process.
The project scope limitations alluded to above also limited our ability to deliver all the
outcomes sought by TasCOSS, but we believe that this report at least allows some progress
to the made by TasCOSS in pursuit of these outcomes.
Copyright Goanna Energy Consulting Pty Ltd
PO Box 30, Sandy Bay, Tasmania 7006 AUSTRALIA
Telephone (03) 6223 7253, Fax (03) 6223 7270 Mobile Marc 0418 596 162 ACN: 127 924 190 ABN: 31 674 232 899
E-Mail: marc@goannaenergy.com.au Web: www.goannaenergy.com.auTasmanian Residential Electricity Price Comparisons
Page 13
TasCOSS set the following objectives for the project:
• To use the findings and results of this project to inform its advocacy on energy
affordability.
• To ensure Tasmanian consumers are paying the lowest possible electricity prices.
• To provide the evidence-base for TasCOSS to influence government, decision-
makers and key stakeholders.
• TasCOSS advocacy activities will include:
o participating in the review process for the setting of electricity prices post the
removal of the price cap in 2021;
o consultations with the community services sector;
o submissions to government; and
o engagement with the Tasmanian Government, Department of Treasury and
Finance, and the Tasmanian energy businesses.
We have taken these objectives into account in delivering on the project scope. We believe
that our report will assist TasCOSS in pursuing these objectives.
Copyright Goanna Energy Consulting Pty Ltd
PO Box 30, Sandy Bay, Tasmania 7006 AUSTRALIA
Telephone (03) 6223 7253, Fax (03) 6223 7270 Mobile Marc 0418 596 162 ACN: 127 924 190 ABN: 31 674 232 899
E-Mail: marc@goannaenergy.com.au Web: www.goannaenergy.com.auTasmanian Residential Electricity Price Comparisons
Page 14
3 ASSESSMENT OF RESIDENTIAL ELECTRICITY PRICE INFORMATION
To robustly determine how Tasmanian residential electricity prices compare with those in
other jurisdictions, it is necessary to have a data set that allows such a comparison to take
place. We have therefore examined all the relevant publicly available data in terms of their
ability to do this.
In summary, the following either make such an assessment or would allow one to be
undertaken:
• The Australian Energy Market Commission (AEMC) produce an annual comparison
of residential electricity prices and annual bills for all Australian jurisdictions except
the Northern Territory (NT) and show trends in prices and bills.1
• St Vincent de Paul Society (SVDP) and Alviss Consulting produce an annual
comparison of residential electricity bills for all National Electricity Market (NEM)
jurisdictions (Tariff Tracker project).2
• The Office of the Tasmanian Economic Regulator (OTTER) provide a biannual
comparison of Tasmanian residential electricity prices and bills compared to those in
all mainland jurisdictions.3
• The Australian Energy Regulator (AER) provide information on retail electricity price
changes for each NEM jurisdiction in their annual State of the Energy Market
Report.4
• The Australian Bureau of Statistics (ABS) produces an index of national and capital
city residential electricity prices as part of its Consumer Price Index.5
• The AER has a retail electricity price comparator web site Energy Made Easy that
covers New South Wales (NSW), Queensland (Qld), South Australia (SA) and
Tasmania (Tas), whilst the Victorian Government has a separate site entitled Energy
Compare.6
• There are various privately operated comparator websites.7
We undertook a detailed assessment of each of these measures in terms of their ability to
provide the type of information that would allow a meaningful and robust comparison of
electricity prices to take place. This is discussed in more detail in Appendix A. It is worth
noting, however, that none of the available measures is perfect in terms of the objectives of
this project and a choice needed to be made that balanced the strengths and weaknesses of
each in terms of the project scope.
1 Australian Energy Market Commission, Residential electricity price trends 2020, Final report, 21
December 2020, and various other years.
2 St Vincent de Paul Society and Alviss Consulting, The NEM – Moving towards a new normal?,
Melbourne, November 2020, and various other years.
3 Office of the Tasmanian Economic Regulator, Comparison of Electricity and Gas Prices Available to
Small Customers in Australia, Report, September 2020 and various other years.
4 Australian Energy Regulator, State of the Energy Market 2020, and various other years.
5 Australian Bureau of Statistics, Consumer price index, cat. no. 6401.0, various issues.
6 Energy Made Easy website (www.energymadeeasy.gov.au) and Victorian Energy Compare website
(www.compare.energy.vic.gov.au ).
7 For example, Beatyourbill, Compare the Market, Energy Watch, Finder, iSelect are some of the
third-party sites and NEM retailers allow consumers to compare their bill to that retailer’s market
offers.
Copyright Goanna Energy Consulting Pty Ltd
PO Box 30, Sandy Bay, Tasmania 7006 AUSTRALIA
Telephone (03) 6223 7253, Fax (03) 6223 7270 Mobile Marc 0418 596 162 ACN: 127 924 190 ABN: 31 674 232 899
E-Mail: marc@goannaenergy.com.au Web: www.goannaenergy.com.auTasmanian Residential Electricity Price Comparisons
Page 15
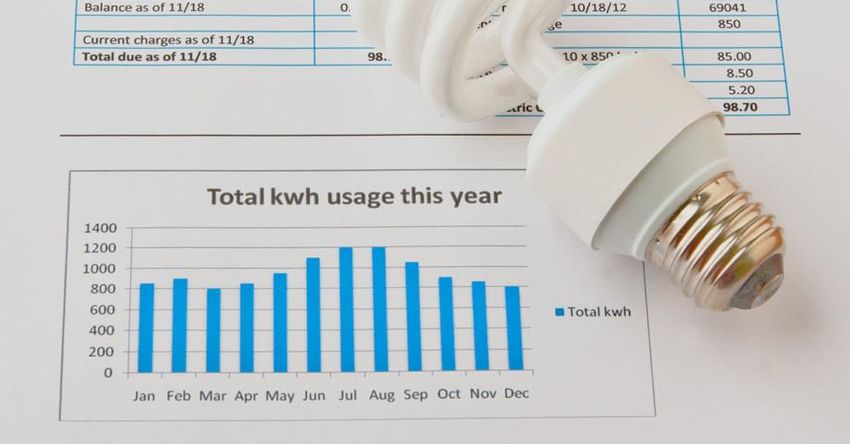
3.1 WHICH COMPARISON SERIES IS MOST FIT-FOR-PURPOSE?
None of the price comparison options assessed provide a perfect solution to the objectives
and scope of this project. We show an assessment of each option against key selection
criteria in Table 1 below. Ultimately, our choice needed to be made ‘on balance’.
Based on the information in the table and the detailed assessment of each comparison
option outlined in Appendix A, we have opted to base our comparisons on the AEMC series
as the primary source, supplemented where necessary by the SVDP Tariff Tracker and
OTTER’s comparisons.
We placed most weight on the ability of each series to provide robust, meaningful and
reasonably consistent comparisons across as many jurisdictions as possible (using both
prices and annual bills), to allow supply chain impacts to be assessed and to allow changes
in prices over time to be assessed reasonably consistently. An ability to forecast prices
reasonably accurately was also considered useful given TasCOSS and other consumer
advocates would be interested in assessing how prices might change in future. It should be
noted that further work to include tools allowing real time comparisons, direct user-based
price comparisons and other online tools could change this choice.
3.2 A WORD ABOUT ELECTRICITY CONSUMPTION
The level of electricity consumption will impact the size of a household’s annual electricity
bill. Annual bills will generally increase as the (use) consumption of electricity increases.
We use electricity consumption numbers taken from the AEMC’s reports unless indicated
otherwise. Appendix B shows the consumption numbers used for each year of the period
assessed and discusses the use of these.
It should be noted that electricity consumption varies significantly from one jurisdiction to
another, reflecting factors such as differences in climate, the availability of alternative fuels,
such as natural gas and the penetration of small-scale solar installations. This can have a
significant impact on electricity bills. Of particular importance for this report is that Tasmania
has the highest average electricity consumption in Australia, reflecting its cool climate, and
lower penetrations of natural gas and solar. Its average household electricity consumption
level is 10 per cent higher than the next highest jurisdiction (ACT) and double that in Victoria
(the jurisdiction with the lowest average electricity consumption).
An alternative approach would be to assume a common level of electricity consumption
across all jurisdictions. For example, the OTTER report applies the Tasmanian average
annual household electricity consumption level across all jurisdictions to standardize bill
comparisons. This is a perfectly legitimate approach. SVDP also do this but use a NEM
average household consumption level. On the other hand, the AEMC apply a separate
average level of household electricity consumption to each jurisdiction. This is also
legitimate and provides a truer picture of annual electricity bills across jurisdictions according
to how local factors impact bills. Each approach will have its strengths and weaknesses.
We have adopted the AEMC’s approach of applying jurisdictional average household
consumption levels that are updated periodically to reflect any changes in consumption.
Other things being equal, this results in higher Tasmanian household electricity bills.
Copyright Goanna Energy Consulting Pty Ltd
PO Box 30, Sandy Bay, Tasmania 7006 AUSTRALIA
Telephone (03) 6223 7253, Fax (03) 6223 7270 Mobile Marc 0418 596 162 ACN: 127 924 190 ABN: 31 674 232 899
E-Mail: marc@goannaenergy.com.au Web: www.goannaenergy.com.auTasmanian Residential Electricity Price Comparisons Page 16
Table 1: Price Comparison Series Assessed Against Key Criteria
Key Criteria AEMC SVDP OTTER AER ABS Govt Private
Comparators Comparators
Compares
residential Average of Median market Change in Price All retailer Certain offers
Can be
prices lowest offer; fixed & prices only index public market only; raw data
derived
market offers variable charges offers; raw
data
Compares
annual bills Average of Average bill Based on median Based on All retailer Based on
lowest offers for each market offers for market offers public market certain offers
by jurisdiction market each network for each offers; raw only; raw data
network area network data
Consumption
basis Jurisdictionally Uniform Tas average 8,422 Jurisdictionally User inputted Mainly user
based 6,000 kWhpa kWhpa (non- based inputted
for all concession) and
comparisons 6,688 kWhpa
(with flexible (concession) used
data sheet)
Offers All published All offers 277 based on Tas All single rate All published Only certain
included offers (except tariffs (incl ToU tariff offers offers
solar and and sloar)
ToU)
Market &
standing Mainly certain
Survey of
offers offers only
households
Number of All except NT NEM plus All NEM only All capital NEM only All with market
jurisdictions (from 2019) & some WA cities offers (excl WA
WA (for 2020) and NT data & NT)
Copyright Goanna Energy Consulting Pty Ltd
PO Box 30, Sandy Bay, Tasmania 7006 AUSTRALIA
Telephone (03) 6223 7253, Fax (03) 6223 7270 Mobile Marc 0418 596 162 ACN: 127 924 190 ABN: 31 674 232 899
E-Mail: marc@goannaenergy.com.au Web: www.goannaenergy.com.auTasmanian Residential Electricity Price Comparisons Page 17
Key Criteria AEMC SVDP OTTER AER ABS Govt Private
Comparators Comparators
Concessions
included
Time series
included Standing offers
only
Supply stack
Based on
included
AEMC
Forecasting
2 years ahead
Real time
dynamic
prices
Controlled-
load tariffs
included
ToU tariffs
included
Solar tariffs
included
National
price series
Workbooks Not applicable Not applicable
published Only
recent years
Online tools
Copyright Goanna Energy Consulting Pty Ltd
PO Box 30, Sandy Bay, Tasmania 7006 AUSTRALIA
Telephone (03) 6223 7253, Fax (03) 6223 7270 Mobile Marc 0418 596 162 ACN: 127 924 190 ABN: 31 674 232 899
E-Mail: marc@goannaenergy.com.au Web: www.goannaenergy.com.auTasmanian Residential Electricity Price Comparisons
Page 18
4 HOW RESIDENTIAL ELECTRICITY PRICES ARE DETERMINED
In this section, we outlined how residential electricity prices are determined. We begin by
looking at how Tasmanian residential electricity prices are set and then briefly outline how
this compares to the other jurisdictions included in this study.
4.1 SETTING TASMANIAN RESIDENTIAL ELECTRICITY PRICES
Electricity prices for most residential consumers in Tasmania are regulated. They are
normally determined through a public determination process undertaken by OTTER, usually
every 5 years, with annual price adjustments in between. At present Tasmanian residential
consumers are also subject to a Government price cap, which is due to expire at the end of
2020/21. We discuss this price cap in more detail in Section 4.2.
Regulated prices are set by a building block process, whereby OTTER determines Aurora
Energy’s regulated revenue by building up a stack of costs that together make up its annual
revenue allowance and from which Aurora (the State’s only regulated offer retailer) sets its
regulated retail prices (known as standing offers). The building blocks used are:
• The wholesale electricity cost (WEC) is determined by OTTER each year using the
weekly load following swap8 prices for Victoria (adjusted for the costs of exporting
over the BassLink interconnector and transmission losses);
• Prevailing network charges, made up mainly of transmission and distribution costs,
determined by the AER.
• Green scheme costs, which in Tasmania equates to the costs of the Federal Large
Renewable Energy Target (LRET) and the Small-scale Renewable Energy Scheme
(SRES) obtained through the Clean Energy Regulator (CER); and
• Retail costs comprising a cost to serve customers, including Customer Acquisition
and Retention Costs (CARC) and a retail margin.9
OTTER uses these building blocks to determine Notional Maximum Revenues (NMR) for
each year of the regulatory period10 from which Aurora set retail tariffs for OTTER approval.
The main tariffs applying to residential electricity consumers are:
• Tariff 31 – a general use tariff with a fixed daily and a single variable energy use
component.
• Tariff 41 – a low-rate tariff comprising a fixed daily and a variable energy use
component and used for controlled load situations involving space and water heating.
8 A contract to trade a fixed amount of electricity for a certain price at all times in a day. Economically,
this arrangement results in a perfect hedge of the volumes sold for changes in the spot price as there
will never be a mismatch in volumes between the actual volumes of electricity sold into the grid and
the notion of the load following swap.
9
The only costs calculated by OTTER during the retail tariff determination process are the retail
costs, with the remainder being determined exogenously, as explained above.
10 Any over- or under-recovery of the NMR is adjusted in subsequent periods.
Copyright Goanna Energy Consulting Pty Ltd
PO Box 30, Sandy Bay, Tasmania 7006 AUSTRALIA
Telephone (03) 6223 7253, Fax (03) 6223 7270 Mobile Marc 0418 596 162 ACN: 127 924 190 ABN: 31 674 232 899
E-Mail: marc@goannaenergy.com.au Web: www.goannaenergy.com.auYou can also read