HEALTH OF HOUSING MARKETS (HOHM) REPORT - FROM NATIONWIDE ECONOMICS - NATIONWIDE BLOG
←
→
Page content transcription
If your browser does not render page correctly, please read the page content below
Health of Housing Markets (HoHM) Report
From Nationwide Economics

                                                                                     2020 Q1
                                                                                  Data as of 2019 Q4

Housing market health remains solid for 2020

•     While the risk that the coronavirus outbreak will
      disrupt economic activity has increased significantly,
      the national LIHHM* projects that the housing sector
      will remain a source of growth for the economy in
      2020. The key to this positive outlook is strong
      underlying housing demand factors — including above-
      trend household growth, solid job gains, and low
      mortgage rates.

•     Regionally, housing trends have improved in many
      local markets with more than half of metro areas
      showing a positive ranking this quarter. This suggests
      that the odds of a downturn in most housing markets
      during 2020 are low.

•     While mortgage delinquencies and foreclosures are
      not a concern at present, some homeowners could be
      at greater risk during the next economic downturn.
      Looser lending standards for FHA, VA, and jumbo
      loans since 2012 suggest that these loan types would
      be more vulnerable than plain vanilla conventional,
      conforming loans to worsening economic conditions.

    * Leading Index of Healthy Housing Markets (LIHHM): A data-driven view of
      the near-term performance of housing markets for the nation as a whole as
      well as for 400 metropolitan statistical areas (MSAs) and divisions.

                         See more at blog.nationwide.com/housing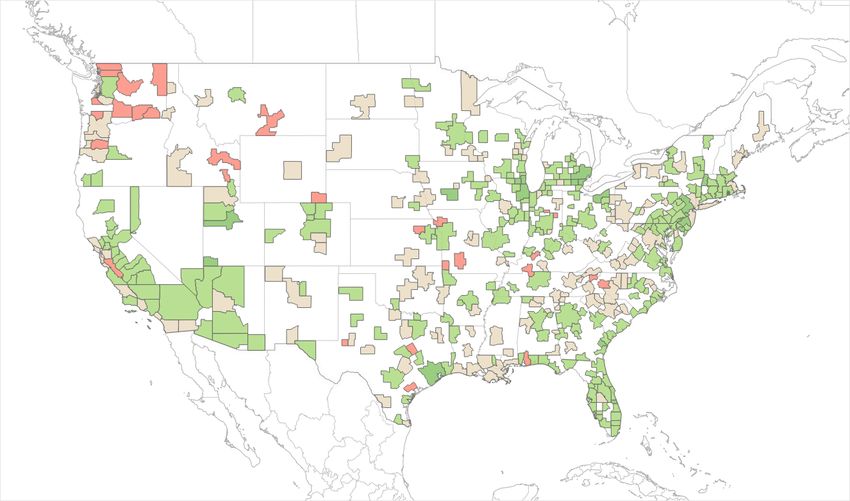
HoHM Report 2020 Q1
Housing outlook remains positive, aided by strong demand drivers
The national LIHHM at the end of 2019 was 106.1 which, after data revisions to previous quarters, marked the sixth-straight
quarterly gain for this metric. Demand factors continue to drive the positive outlook led by low mortgage rates, above-
trend household formations, the lowest unemployment rates in 50 years, and rising incomes. The serious delinquency rate
has declined in each of the last six quarters and has fallen to a healthy level below 2.0 percent. House price gains have
accelerated again in response to excess homebuyer demand with existing home sale supply levels very tight. Still, price
growth remains near the long-term average and, with low mortgage rates, is keeping housing affordability positive.
Regionally, well over half of the LIHHM performance rankings are positive and indicate a high degree of sustainability for
housing in those local markets. Household formations have increased regionally while unemployment rates remain low,
supporting housing demand in most metro areas across the country. Additionally, rising incomes have kept pace with
house price gains, helping to keep homes relatively affordable in many areas.
National LIHHM LIHHM Scores
125 125
120 120
125 POSITIVE
115 115
110 110
105 105
100 100
95 95 100 NEUTRAL
90 90
85 85
80 80
75 75
75 NEGATIVE
10
13
15
11
12
16
19
17
18
14
6
9
7
8
4
3
5
0
0
0
0
0
0
0
20
20
20
20
20
20
20
20
20
20
20
20
20
20
20
20
20
Performance
MSA LIHHM Performance Rankings Rankings
400
+4 POSITIVE
350
300
Number of MSAs
250
200 0 NEUTRAL
150
100
50
-4 NEGATIVE
0
11
12
16
17
20 8
14
10
13
15
8
5
4
6
9
7
0
0
0
1
0
0
Q
20
20
20
20
20
20
20
20
20
20
20
20
20
20
19
Nationwide Economics Page 2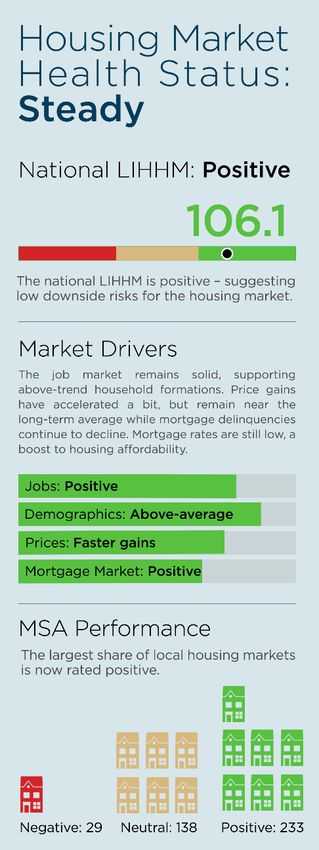
HoHM Report 2020 Q1
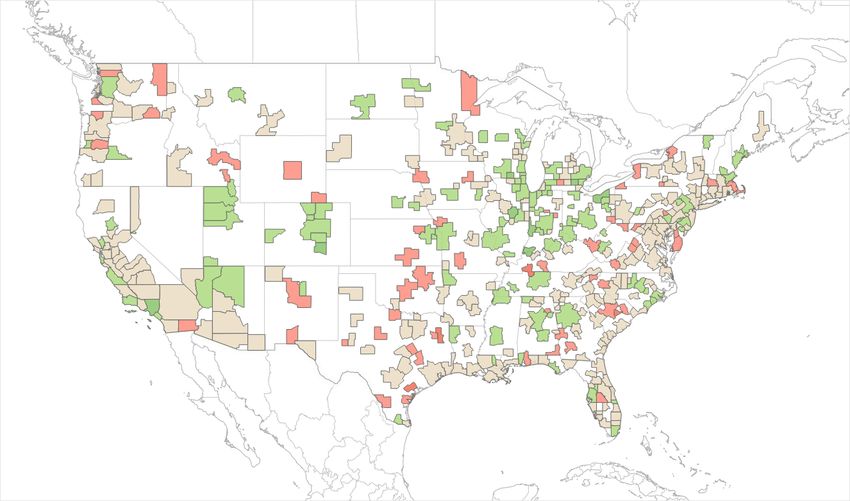
Local markets swing in a positive direction across the country
• Nearly 60 percent of all MSAs show a positive housing market ranking, with a significant shift to even better levels
compared with the previous quarter. Of the 233 markets with a positive ranking, 214 of them are positive by one
ranking, while a further 19 have a positive 2 ranking — signaling healthy housing trends.
• There are 138 MSAs with a neutral ranking, a net decrease from last quarter as many MSAs improved from a neutral
to a positive ranking while only a few dropped to a negative ranking. The neutral rankings suggest a mixed outlook
for housing sustainability over the next year or so, but are not indicative of a downturn.
• 29 local housing markets have a negative ranking this quarter, a lower number than the previous two quarters. All of
these are negative by only one ranking (out of a possible four), however, indicating only slightly elevated concern about
housing health in those markets.
Performance
Rankings†
+4 POSITIVE
0 NEUTRAL
-4 NEGATIVE
Top 10 MSAs Bottom 10 MSAs
Rank Metropolitan Statistical Area Rank Metropolitan Statistical Area
1 Hinesville GA 400 Yakima WA
2 Detroit-Dearborn-Livonia MI 399 Kennewick-Richland WA
3 Cleveland-Elyria OH 398 Cheyenne WY
4 Trenton NJ 397 Odessa TX
5 Sebastian-Vero Beach FL 396 St. Joseph MO
6 Lake County-Kenosha County IL 395 Hickory-Lenoir-Morganton NC
7 Warren-Troy-Farmington Hills MI 394 Walla Walla WA
8 Philadelphia PA 393 Albany OR
9 Newark NJ 392 Manhattan KS
10 Camden NJ 391 Pocatello ID
† Data as of 2019 Q4
Nationwide Economics Page 3
HoHM Report 2020 Q1

                                                                                                      Performance Rankings
                                                               Metropolitan Statistical Area         Current†   Prior Qtr   Prior Year
                                                  1      New York-Jersey City-White Plains NY-NJ        0          0            0
MSAs by size
                                              2            Los Angeles-Long Beach-Glendale CA           1          0            -1
(Top 40), with
                                              3           Chicago-Naperville-Arlington Heights IL       2           1           1
corresponding
performance                                   4           Houston-The Woodlands-Sugar Land TX           2          2            2

rankings                                      5             Atlanta-Sandy Springs-Roswell GA            1          0            0
                                              6       Washington-Arlington-Alexandria DC-VA-MD-WV       0          0            0
                                              7                Phoenix-Mesa-Scottsdale AZ               1           1           1
                                              8                   Dallas-Plano-Irving TX                1           1           1

     Performance Rankings:                    9          Minneapolis-St. Paul-Bloomington MN-WI         1          0            1
                                             10            Riverside-San Bernardino-Ontario CA          1           1           1

       +4         POSITIVE                    11           Tampa-St. Petersburg-Clearwater FL           1           1           0
                                              12                  San Diego-Carlsbad CA                 0          0            0
                                              13               Seattle-Bellevue-Everett WA              1          0            0
                                             14                       St. Louis MO-IL                   1          0            0
                                              15              Denver-Aurora-Lakewood CO                 1          0            0
         0        NEUTRAL
                                              16             Baltimore-Columbia-Towson MD               1           1           1
                                              17              Anaheim-Santa Ana-Irvine CA               0          0            -1
                                              18             Warren-Troy-Farmington Hills MI            2           1           1
                                              19                      Pittsburgh PA                     0           1           0
                                             20               Oakland-Hayward-Berkeley CA               0          0            0
       -4         NEGATIVE
                                              21           Portland-Vancouver-Hillsboro OR-WA           0          0            0
                                             22             Nassau County-Suffolk County NY             0          0            0
                                             23             Charlotte-Concord-Gastonia NC-SC            0          0            0
                                             24               Miami-Miami Beach-Kendall FL              1           1           0
None of the 40* largest MSAs
                                             25               Orlando-Kissimmee-Sanford FL              1           1           1
have a negative LIHHM
performance ranking, with only 12            26            Cambridge-Newton-Framingham MA               1          0            0
ranked as neutral. The remaining             27                       Newark NJ-PA                      2          2            1
major U.S. housing markets show
                                             28                  Fort Worth-Arlington TX                0          0            0
healthy trends with little chance
of a meaningful downturn in the              29                    Cleveland-Elyria OH                  2           1           0
near term.                                   30                    Cincinnati OH-KY-IN                  1           1           0
                                              31              San Antonio-New Braunfels TX              1           1           1
                                             32           Sacramento-Roseville-Arden-Arcade CA          1           1           1
                                             33                      Philadelphia PA                    2           1           1
                                             34                     Kansas City MO-KS                   1          0            0
                                             35                       Columbus OH                       1          0            0
                                             36             Las Vegas-Henderson-Paradise NV             1           1           1
                                             37              Indianapolis-Carmel-Anderson IN            1          0            0
                                             38                         Boston MA                       0          0            1
                                             39 Ft Lauderdale-Pompano Beach-Deerfield Beach FL          1           1           1
                                             40                   Austin-Round Rock TX                  0          0            0

 †   Data as of 2019 Q4
* Largest 40 determined by number of households

                                                           Nationwide Economics                                                      Page 4
HoHM Report 2020 Q1

   Mortgage credit availability by loan type
         Index

                                                                                                       Government-insured
                                                                                                       loans

                                                                                                       Jumbo loans

                                                                                                       Conventional,
                                                                                                       conforming loans

            Source: Mortgage Bankers Association/Haver Analytics

Government-insured and jumbo loans could be at more risk to an economic downturn
 Mortgage delinquencies spiked to unprecedented levels in the housing bust as the severity of the Great Recession
 combined with historically easy underwriting standards during the boom. Double-digit unemployment rates, sharp
 declines in house values, a significant share of riskier mortgage loans, and overextended households led to a glut of
 foreclosed homes when the housing market plummeted. Delinquencies for most mortgage loan types are now back
 to pre-boom long-term averages in response to the record-long economic expansion (with 50-year lows in the
 unemployment rate), house price recoveries, and more appropriate mortgage lending standards. The current serious
 delinquency rate, at less than 2.0 percent and falling, is at levels not seen since before the housing boom — nearly 20
 years ago.

 In response to the too easy lending standards of the housing boom, mortgage lending standards tightened
 significantly in the years after the housing market crash. This tightening reduced the opportunity to get a mortgage
 for those borrowers without prime credit. At the end of 2019, for example, only those with credit scores above 760
 had seen a significant increase in total mortgage originations since 2010, according to data from the Federal Reserve
 Bank of New York. There are signs that mortgage lending standards have eased in recent years, however, helping to
 spur housing demand at a time when mortgage rates have again declined to near record-lows.

 The mortgage credit availability index (MCAI) from the Mortgage Bankers Association shows that overall mortgage
 lending standards have eased modestly since 2012, although it remains far tighter than the loose standards seen
 during the housing boom. While standards for conventional, conforming loans (mortgages that meet Fannie
 Mae/Freddie Mac guidelines and are under the conforming loan limit) are little changed today from what they were
 in 2012, they have eased significantly for other mortgage types.

 Credit terms for government-insured loans (FHA and VA) and jumbo loans (mostly non-government loans above the
 conforming loan limit) have eased significantly over the past eight years. This easing has spurred a rise in the number
 and share of government-insured and jumbo mortgages. FHA and VA loans now comprise more than 23 percent of
 the nearly 40 million mortgages in the U.S. — the highest share since 2001.

 While delinquency rates for government-insured and jumbo loans are low today, the easing of underwriting
 standards indicates some vulnerability if economic conditions deteriorate. Delinquencies typically occur when a
 households’ ability to pay is constrained, such as when job losses rise during a recession. The significantly tighter
 lending practices over the past decade suggest that a rise in overall mortgage delinquencies would be much less
 than during the Great Recession. But there would likely be a relative rise in late payments and foreclosures for FHA,
 VA, or jumbo loans given the easier lending standards for them in recent years.

                                                     Nationwide Economics                                                 Page 5
HoHM Report 2020 Q1

 More MSAs increased their ranking over the past year
 •     The near-term sustainability of housing markets is best measured by the current LIHHM (page 3), but looking at shifts
       in the LIHHM over the course of a year can provide additional insights.

 •     The rankings of more than half of MSAs were unchanged compared with a year ago, reflective of a relatively stable
       outlook for housing sector activity. 65 MSAs saw their rankings drop over the past year (much less than last quarter),
       and only four of those fell by more than one ranking.

 •     More than a quarter of local markets improved their rankings, including nine which jumped two rankings. The gains
       were usually in response to rising household formations and improved affordability as house price growth had
       moderated last year in many areas.

Current LIHHM
4Q change †

≥ +3         INCREASED

             UNCHANGED

≤ -3         DECREASED

                                        Largest Increase                             Largest Decrease
                           Rank            Metropolitan Statistical Area      Rank       Metropolitan Statistical Area

                             1                  Bloomington IL                400                Sumter SC

                             2                   Ann Arbor MI                 399              Longview TX

                             3               Cleveland-Elyria OH              398              Clarksville TN

                             4                   Fairbanks AK                 397               Victoria TX
                             5                     Pueblo CO                  396                 Tulsa OK
                             6                    Evansville IN               395                 Erie PA
                             7                   Terre Haute IN               394               Abilene TX
                             8     Los Angeles-Long Beach-Glendale CA         393           Oklahoma City OK

                             9                Janesville-Beloit WI            392              Columbus GA

                            10                  St. Louis MO-IL                391              Florence SC

 †   Change in performance ranking; Data as of 2019 Q4

                                                            Nationwide Economics                                          Page 6
Appendix
Leading Index of Healthy Housing Markets (LIHHM)
Nationwide’s LIHHM is a data-driven view of the near-term performance of housing markets
based upon current health indicators for the national housing market and 400 metropolitan
statistical areas (MSAs*) and divisions across the country. For each MSA, the LIHHM uses
local-level data to incorporate the idiosyncratic characteristics of regional housing markets.
The focus of the LIHHM is on the entire housing market’s health, rather than a projection of
house prices or home sales.
Nationwide Economics LIHHM methodology
The LIHHM is calculated using a number of variables that describe many of the drivers of the
housing market for each MSA. In order to provide the best indicator of housing health, the
included variables and corresponding weights for each provide the optimal leading
perspective on future housing markets for each MSA. The drivers can be grouped into the
following categories:
1. Employment
2. Demographics
3. Mortgage Market
4. House Prices
As an illustration, if job growth increases in an MSA, then the resulting rise in incomes creates
additional housing demand. Consumers have a greater ability to earn and save for home
purchases, increasing sales and pushing up house prices. The LIHHM measures the movements
in the included employment, demographic, mortgage market, and house price variables versus
the long-term trends within each MSA.
These drivers are used to derive an overall LIHHM score on a scale from 75 to 125 centered
around a neutral value of 100. These values are placed into performance rankings to allow for
better comparisons across MSAs. These performance rankings are the key metric in comparing
the MSAs both to each other and across time. Raw LIHHM values are used for calculation
purposes only and will only be shown on the national level as the national score is standalone
and is not compared to other areas.
* MSA: Geographical region with high population density and close economic ties throughout the nearby area,
capturing 85-90% of the U.S. population
See more at blog.nationwide.com/housing
Nationwide EconomicsAuthored by Nationwide Economics
DAVID BERSON, PhD, CBE
Senior Vice President, Chief Economist
David holds a doctorate in Economics and a master’s degree in Public Policy from the
University of Michigan. Prior to Nationwide, David served as Chief Economist, Strategist and
Head of Risk Analytics for The PMI Group, Inc., and Vice President and Chief Economist for
Fannie Mae. David has also served as Chief Financial Economist at Wharton Econometrics
and visiting scholar at the Federal Reserve Bank of Kansas City. His government experience
has included roles with the President’s Council of Economic Advisors, U.S. Treasury
Department and the Office of the Special Trade Representative. He is a past President of the
National Association for Business Economics and is a Certified Business Economist (CBE).
BRYAN JORDAN, CFA
Deputy Chief Economist
Bryan is a frequent author and knowledgeable source on economic topics, and has been
featured in The Wall Street Journal and New York Times. Bryan holds degrees in Economics
and Political Science from Miami University and has earned the Chartered Financial Analyst
designation. He currently serves as Chairman of the Ohio Council on Economic Education
and is a member of the Ohio Governor’s Council of Economic Advisors, the National
Association for Business Economics, and the Bloomberg monthly economic forecasting panel.
BEN AYERS, MS
Senior Economist
Ben authors periodic economic analyses from the Nationwide Economics team, as well as
commentary on key economic topics. Ben is also responsible for understanding and analyzing
the enterprise business drivers to assist the strategic planning process. He holds a Master of
Science in Economics from the Ohio State University, specializing in applied economic
analysis, and a BSBA from the Fisher College of Business at the Ohio State University, with a
focus on economics and international business.
Additional contributors: Brian Kirk and Daniel Vielhaber
The information in this report is provided by Nationwide Economics and is general in nature and not intended as investment or
economic advice, or a recommendation to buy or sell any security or adopt any investment strategy. Additionally, it does not take
into account any specific investment objectives, tax and financial condition or particular needs of any specific person.
The economic and market forecasts reflect our opinion as of the date of this report and are subject to change without notice. These
forecasts show a broad range of possible outcomes. Because they are subject to high levels of uncertainty, they will not reflect
actual performance. We obtained certain information from sources deemed reliable, but we do not guarantee its accuracy,
completeness or fairness.
Nationwide, the Nationwide N and Eagle and Nationwide is on your side are service marks of Nationwide Mutual Insurance Company.
NFM-13575AO.3
See more at blog.nationwide.com/housing
Nationwide EconomicsYou can also read