Hemorrhage During Induction Chemotherapy in Neuroblastoma: Additional Risk Factors in High-Risk Patients

Page created by Bertha Mcbride
 
CONTINUE READING
Hemorrhage During Induction Chemotherapy in Neuroblastoma: Additional Risk Factors in High-Risk Patients
ORIGINAL RESEARCH
                                                                                                                                          published: 16 November 2021
                                                                                                                                         doi: 10.3389/fped.2021.761896

                                                Hemorrhage During Induction
                                                Chemotherapy in Neuroblastoma:
                                                Additional Risk Factors in High-Risk
                                                Patients
                                                Valerio Voglino 1 , Giorgio Persano 1*, Alessandro Crocoli 1 , Aurora Castellano 2 ,
                                                Annalisa Serra 2 , Ugo Giordano 3 , Gian Luigi Natali 4 , Pier Luigi Di Paolo 4 ,
                                                Cristina Martucci 1 , Alessandra Stracuzzi 5 and Alessandro Inserra 1
                                                1
                                                 Surgical Oncology—General and Thoracic Surgery Unit, Department of Surgery, Bambino Gesù Children’s Hospital IRCCS,
                                                Rome, Italy, 2 Onco-Hematology Unit, Department of Onco-Hematology and Gene Therapy, Bambino Gesù Children’s
                                                Hospital IRCCS, Rome, Italy, 3 Sport and Hypertension Medicine Unit, Department of Cardiac Surgery, Cardiology, Heart and
                                                Lung Transplant, Bambino Gesù Children’s Hospital IRCCS, Rome, Italy, 4 Radiology Unit, Department of Diagnostic Imaging,
                                                Bambino Gesù Children’s Hospital IRCCS, Rome, Italy, 5 Pathology Unit, Department of Laboratories, Bambino Gesù
                              Edited by:        Children’s Hospital IRCCS, Rome, Italy
                               Luca Pio,
Giannina Gaslini Institute (IRCCS), Italy
                       Reviewed by:
                                                Background: Neuroblastoma is the most common solid extracranial tumor in children.
                         Orkan Ergün,           Patients affected by neuroblastoma are stratified into low, intermediate, and high risk in
                Ege University, Turkey
                                                terms of event-free and overall survival. Some high-risk patients have an additional risk
                    Aurelien Scalabre,
Centre Hospitalier Universitaire (CHU)          of acute hemorrhagic complications during induction chemotherapy.
           de Saint-Étienne, France
                                                Aim: To find easily and rapidly assessed parameters that help clinicians identify
                   *Correspondence:
                       Giorgio Persano
                                                those patients affected by high-risk neuroblastoma who have an additional risk of
            giorgio.persano@opbg.net            hemorrhagic complications.
                                                Methods: The clinical notes of patients diagnosed with high-risk neuroblastoma from
                    Specialty section:
          This article was submitted to         January 2013 until February 2021 were retrospectively reviewed. Clinical, demographic
                       Pediatric Surgery,       and laboratory data, biological characteristics of the tumor, and information about
                a section of the journal
                  Frontiers in Pediatrics
                                                treatment and hospital stay were identified.
         Received: 20 August 2021               Results: In the examined period, 44 patients were diagnosed with high-risk
        Accepted: 11 October 2021               neuroblastoma. Four of these patients had hemorrhagic complications within 2–7 days
      Published: 16 November 2021
                                                after the initiation of induction chemotherapy; two patients had hemothorax, one patient
                               Citation:
      Voglino V, Persano G, Crocoli A,          had hemoperitoneum and one patient had hemothorax and hemoperitoneum. The
   Castellano A, Serra A, Giordano U,           patient with isolated hemoperitoneum was treated with blood components transfusions,
   Natali GL, Di Paolo PL, Martucci C,
      Stracuzzi A and Inserra A (2021)
                                                clotting factors and colloids infusions; the three patients with hemothorax underwent
         Hemorrhage During Induction            thoracostomy tube placement and respiratory support. At initial presentation, patients
    Chemotherapy in Neuroblastoma:              who suffered from hemorrhagic complications had a higher degree of hypertension
   Additional Risk Factors in High-Risk
    Patients. Front. Pediatr. 9:761896.         (stage 2, p = 0.0003), higher levels of LDH (median 3,745 U/L, p = 0.009) and lower
      doi: 10.3389/fped.2021.761896             levels of hemoglobin (mean 7.6 gr/dl, p = 0.0007) compared to other high-risk patients.

Frontiers in Pediatrics | www.frontiersin.org                                         1                                       November 2021 | Volume 9 | Article 761896
Voglino et al.                                                                                           Hemorrhage in Neuroblastoma: Additional Risk Factors

                                                Conclusions: A subgroup of “additional” high-risk patients can be identified within
                                                the high-risk neuroblastoma patients based on mean arterial pressure, LDH levels and
                                                hemoglobin levels at presentation. Further studies to define cut-off values and optimal
                                                management strategies for these patients are needed.

                                                Keywords: high-risk neuroblastoma, hemorrhagic complications, hemothorax, hemoperitoneum, chemotherapy
                                                complications

INTRODUCTION                                                                           All the patients underwent total-body contrast-enhanced
                                                                                    computed tomography (CT) and meta-iodobenzylguanidine
Neuroblastoma is the most common solid extracranial tumor                           (MIBG) scintigraphy.
in childhood worldwide, accounting for 8–10% of all cancer                             Diagnosis was confirmed by histology performed on
cases in children (1); it arises from the neural crest cells of                     core needle biopsy and amplification of N-MYC on
the developing sympathetic system, typically resulting in adrenal                   tumor specimens was determined for every patient. All
or paravertebral tumors (2). Staging and pretreatment risk                          the patients underwent bone marrow biopsy as part of
stratification of neuroblastoma are based on the International                      initial work-up.
Neuroblastoma Risk Group (INRG) staging and classification                             Patients were divided in two groups; patients who
system; patients are divided into low, intermediate and high risk                   developed hemorrhagic complications during induction
in terms of Event-Free Survival (EFS) and Overall Survival (OS)                     chemotherapy were categorized in group A, while patients
(3, 4).                                                                             who did not develop such complications were categorized in
    Clinical presentation of neuroblastoma varies widely, ranging                   group B.
from asymptomatic patients to symptoms related to local                                In order to differentiate anemia secondary to chemotherapy-
compression of adjacent structures and to catecholamines                            induced bone marrow aplasia form anemia secondary to blood
or vasoactive intestinal peptide (VIP) secretion, such as                           loss, hemorrhagic complications were defined by the concurrent
hypertension and intractable diarrhea, systemic non-specific                        presence of the following three criteria: (1) anemia (i.e.,
symptoms, such as fever and weight loss, or cytopenia related to                    hemoglobin levels below 8.0 gr/dL) that persisted after the
bone marrow metastases (5, 6).                                                      transfusion of 10 mL/kg of packed red cells, (2) the presence
    On rare instances, children with neuroblastoma may                              of respiratory distress or abdominal pain or distension, (3)
present with acute hemorrhage such as hemothorax and                                radiological evidence of pleural effusion or free abdominal fluid.
hemoperitoneum (7–9). Such cases pose a great challenge for the                        The following variables were analyzed: clinical features,
caring clinicians.                                                                  laboratory findings, radiologic assessment, histology/biology (see
    The purpose of this study is to identify and describe a                         detailed description below).
specific subset of high-risk patients who have additional risk of                      Statistical analyses were performed using Prism 9.0.0.121
developing hemorrhagic complications, in order to find rapidly                      (GraphPad Software, Inc., San Diego, CA).
and easily assessed parameters that can help clinicians predict                        Categorical variables were analyzed using Fisher’s test.
these complications and optimize their treatment.                                   Continuous variables were tested for normal distribution using
                                                                                    D’Agostino-Pearson test: variables with normal distribution were
                                                                                    analyzed using Student’s t-test, while variables without normal
PATIENTS AND METHODS                                                                distribution were analyzed with Mann-Whitney test.
                                                                                       Variables that resulted statistically significant on univariate
All the patients diagnosed with high-risk neuroblastoma at
                                                                                    analysis were subsequently tested on multivariate logistic
Bambino Gesù Children’s Hospital from January 2013 until
                                                                                    regression; the outcome (dependent) variable was the occurrence
February 2021 were included in the study. Risk stratification
                                                                                    of hemorrhage.
was performed according to the criteria of the International
                                                                                       A value of p < 0.05 was considered statistically significant for
Neuroblastoma Risk Group (INRG) Classification System (3);
                                                                                    each analysis.
all the patients were evaluated and treated according to the
High Risk Neuroblastoma Study 1.8 of SIOP-Europe (SIOPEN)
(10). Patients who were referred from other institutions after the                  Clinical Features
diagnosis had already been established were excluded from the                       Age at diagnosis: median age at diagnosis in months was
present study.                                                                      calculated separately in the two groups and data have been
    At presentation, all the patients underwent full clinical                       compared using Mann-Whitney test.
assessment, serial measurement of arterial pressure, complete                          Time from onset of symptoms to diagnosis: time in weeks
blood count, lactate dehydrogenase (LDH) and uric acid serum                        from onset of symptoms to diagnosis was recorded for each
levels, urinary catecholamine metabolites, i.e., vanilmandelic acid                 patient from the history reported in the clinical notes. Median
(VMA) and homovanillic acid (HVA), coagulation tests, hepatic                       time and range were calculated in each group and data were
and renal function tests.                                                           compared using Mann-Whitney test.

Frontiers in Pediatrics | www.frontiersin.org                                   2                                  November 2021 | Volume 9 | Article 761896
Voglino et al.                                                                                                                                                   Hemorrhage in Neuroblastoma: Additional Risk Factors

   Systemic symptoms: the presence of fever >37.5◦ C, weight

                                                                                                                                                                                                                                                                                                                 HR, Heart Rate; SBP, Systolic Blood Pressure (mmHg); HTN, Hypertension (stage); LDH, lactate dehydrogenase (U/L); Hb, hemoglobin (gr/dL); VMA, Vanilmandelic acid (mcg/mg creat); HVA, Homovanillic acid (mcg/mg creat); IDRF,
                                                                                                                                                                                                               Hemo Hemoperi
                                                                                                                                                                                                        marrow thorax toneum
                                                                                                                                                         Complications
loss or asthenia was recorded for each patient in the two groups.
Data were compared using Fisher’s test.

                                                                                                                                                                                                                                                         Yes

                                                                                                                                                                                                                                                                                               Yes
   Arterial pressure: as per institutional protocol, arterial
pressure measurements were performed upon admission and

                                                                                                                                                                                                                                       Yes
                                                                                                                                                                                                                                                         Yes
                                                                                                                                                                                                                                                                           Yes
every 8 h for each patient. Mean values for the first 4 days from
admission were calculated for each patient. Patients were defined

                                                                                                                                                                                    Max diam Stage n-MYC Bone
as having normal blood pressure, stage 1 hypertension or stage

                                                                                                                                                                                                                                       Neg
                                                                                                                                                                                                                                                         Neg

                                                                                                                                                                                                                                                                                               Neg
                                                                                                                                                         Biology

                                                                                                                                                                                                                                                                           Pos
2 hypertension according to the “Clinical Practice Guideline
for Screening and Management of High Blood Pressure in

                                                                                                                                                                                                                                       ampl
                                                                                                                                                                                                                                                         ampl
                                                                                                                                                                                                                                                                           ampl
                                                                                                                                                                                                                                                                                               ampl
Children and Adolescents” published in 2017 (11). Patients
were grouped according to the presence of stage 2 hypertension

                                                                                                                                                                                                                                                         L2

                                                                                                                                                                                                                                                                                               L2
vs. stage 1 or no hypertension. Data were compared using

                                                                                                                                                                                                                                       M

                                                                                                                                                                                                                                                                           M
Fisher’s test.

                                                                                                                                                                                      (cm)

                                                                                                                                                                                                                                       13.5
                                                                                                                                                                                                                                                         14
                                                                                                                                                                                                                                                                           17
                                                                                                                                                                                                                                                                                               14
Laboratory Findings
Hemoglobin levels: full blood count was performed in

                                                                                                                                                         Radiology

                                                                                                                                                                                                                    Vascular Total

                                                                                                                                                                                                                                       4
                                                                                                                                                                                                                                                         4
                                                                                                                                                                                                                                                                           5
                                                                                                                                                                                                                                                                                               4
every patient upon admission. Mean hemoglobin level and
standard deviation (SD) have been calculated separately

                                                                                                                                                                                    HTN LDH Hb VMA HVA Primary Side IDRF
in the two groups and data have been compared using

                                                                                                                                                                                                                                       4
                                                                                                                                                                                                                                                         4
                                                                                                                                                                                                                                                                           4
                                                                                                                                                                                                                                                                                               4
Student’s t-test.
   LDH levels: LDH serum levels were measured in every patient

                                                                                                                                                                                                                                       Left
                                                                                                                                                                                                                                                         Left
                                                                                                                                                                                                                                                                           197 Thor-Abd Left
                                                                                                                                                                                                                                                                                               Left
upon admission. Median levels and range have been calculated
separately in the two groups and data have been compared using

                                                                                                                                                                                                                                       20 Abd
                                                                                                                                                                                                                                                         33 Abd

                                                                                                                                                                                                                                                                                               22 Abd
Mann-Whitney test.
   Urinary VMA and HVA levels: VMA and HVA urinary levels
were measured in every patient upon admission. Median levels
                                                                                                                                                         Laboratory

                                                                                                                                                                                                                                       4,561 7.6 16.8

                                                                                                                                                                                                                                                                                               6,677 7.6 6.25
                                                                                                                                                                                                                                                                           24
and range for the two metabolites have been calculated separately

                                                                                                                                                                                                                                                         9
in the two groups and data have been compared using Mann-

                                                                                                                                                                                                                                                         2,834 6.6
                                                                                                                                                                                                                                                                           2,928 8.7
Whitney test.

                                                                                                                                                                                                                                       2
                                                                                                                                                                                                                                                         2
                                                                                                                                                                                                                                                                           2
                                                                                                                                                                                                                                                                                               2
                                                                                                                                                                                                                                       >95th + 12 mmHg
                                                                                                                                                                                                                                                         >95th + 12 mmHg
                                                                                                                                                                                                                                                                           >95th + 12 mmHg
                                                                                                                                                                                                                                                                                               >95th + 12 mmHg
                                                                                                                                                                                     Centile
                                                                                                                                                         Presentation

                                                                                                                                                                                                         Mean
                                                                                                                                                                                              HR Centile SBP

                                                                                                                                                                                                                                       121
                                                                                                                                                                                                                                                         125
                                                                                                                                                                                                                                                                           123
                                                                                                                                                                                                                                                                                               126
                                                                                TABLE 1 | Patients’ characteristics at initial presentation (group A).

                                                                                                                                                                                                                                       75th
                                                                                                                                                                                                                                                         95th
                                                                                                                                                                                                                                                                           75th
                                                                                                                                                                                                                                                                                               75th
                                                                                                                                                                                    symptoms Mean

                                                                                                                                                                                                                                       123
                                                                                                                                                                                                                                                         145
                                                                                                                                                                                                                                                                           106
                                                                                                                                                                                                                                                                                               123
                                                                                                                                                                                    Systemic

                                                                                                                                                                                                                                       Yes
                                                                                                                                                                                                                                                         Yes
                                                                                                                                                                                                                                                                           Yes
                                                                                                                                                                                                                                                                                               Yes
                                                                                                                                                         Patient Sex Age (months)

                                                                                                                                                                                                                                                                                                                 Image-Defined Risk Factors.
                                                                                                                                                                                                                                       17
                                                                                                                                                                                                                                                         19
                                                                                                                                                                                                                                                                           47
                                                                                                                                                                                                                                                                                               15
                                                                                                                                                                                                                                       M
                                                                                                                                                                                                                                                         M

                                                                                                                                                                                                                                                                                               M
                                                                                                                                                                                                                                                                           F

 FIGURE 1 | Left retroperitoneal neuroblastoma with posterior mediastinum
 extension.
                                                                                                                                                                                                                                       1
                                                                                                                                                                                                                                                         2
                                                                                                                                                                                                                                                                           3
                                                                                                                                                                                                                                                                                               4

Frontiers in Pediatrics | www.frontiersin.org                               3                                                                                                                                                        November 2021 | Volume 9 | Article 761896
Voglino et al.                                                                                                                                                                                                                                                                                                                                          Hemorrhage in Neuroblastoma: Additional Risk Factors

                                                                                                                                                                                                                                                                                                                                  Radiologic Assessment
                                                                                                                                                                                                                                                                                                                                  Maximum diameter of the primary tumor: maximum diameter

                                                                                                             Variation (x-fold)
                                                                                                                                                                                                                                                                                                                                  of the primary tumor was measured for each patient on initial
                                                                                                                                                                                                                                                                                                                                  CT images by the radiologist who performed the investigation

                                                                                                                                                x 4.7
                                                                                                                                                                x 3.9
                                                                                                                                                                                x 4.4
                                                                                                                                                                                         x 3.1
                                                                                         Lysis marker*
                                                                                                                                                                                                                                                                                                                                  and subsequently revised by GLN and PDP. Mean diameter and
                                                                                                                                                                                                                                                                                                                                  standard deviation (SD) have been calculated separately in the
                                                                                                                                                                                                                                                                                                                                  two groups and data have been compared using Student’s t-test.
                                                                                                                                                                                                                                                                                                                                     Vascular and total Image-Defined Risk Factors (IDRF): the

                                                                                                                                                21,495
                                                                                                                                                                11,163
                                                                                                                                                                                12,959
                                                                                                                                                                                         20,771
                                                                                                                                                                                                                                                                                                                                  presence and number of both vascular and total IDRF was
                                                                                                             LDH

                                                                                                                                                                                                                                                                                                                                  assessed for each patient on initial CT images by the radiologist
                                                                                                                                                                                                                                                                                                                                  who performed the investigation and subsequently revised by
                                                                                                                                                                                                                                                                                                                                  GLN and PDP. IDRF were defined according to the International
                                                                                                                                  % Variation

                                                                                                                                                                                                                                                                                                                                  Neuroblastoma Risk Group (INRG) Staging System (4). Mean
                                                                                                                                                                                 −15
                                                                                                                                                                                          −15
                                                                                                                                                  −7
                                                                                                                                                                  −9

                                                                                                                                                                                                                                                                                                                                  number and standard deviation (SD) have been calculated
                                                                                                                                                                                                                                                                                                                                  separately in the two groups and data have been compared using
                                                                                                                                                                                                                                                                                                                                  Student’s t-test.
                                                                                                                                                95th + 4 mmHg
                                                                                                                                                                95th + 6 mmHg

                                                                                                                                                                                                                                                                                                                                     Stage: patients were staged by CT scan and MIBG scintigraphy
                                                                                                                                                                                                                                                                                                                                  according to the International Neuroblastoma Risk Group
                                                                                                                                  Centile

                                                                                                                                                                                90th
                                                                                                                                                                                         95th

                                                                                                                                                                                                                                                                                                                                  (INRG) Staging System (4). Stage distributions in the two groups
                                                                                                                                                                                                                                                                                                                                  were compared using Fisher’s test.
                                                                                         Hemodynamics

                                                                                                                                                                                                                                                                                                                                  Histology/Biology
                                                                                                                                  Mean
                                                                                                             SBP

                                                                                                                                                112
                                                                                                                                                                114
                                                                                                                                                                                104
                                                                                                                                                                                         107

                                                                                                                                                                                                                                                                                                                                  Bone marrow infiltration: bone marrow biopsy was performed
                                                                                                                                                                                                                                                                                                                                  at initial presentation in every patient. Patients were grouped
                                                                                                                                                                                                                                                                                                                                  according to the presence vs. absence of neuroblastoma infiltrates
                                                                                                                                  % Variation

                                                                                                                                                                                                                                                                                                                                  in the bone marrow. Data were compared using Fisher’s test.
                                                                                                                                                24

                                                                                                                                                                                25
                                                                                                                                                                                         14
                                                                                                                                                                0

                                                                                                                                                                                                                                                                                                                                      N-MYC amplification: amplification of N-MYC on biopsy
                                                                                                                                                                                                                                                                                                                                  specimens was determined for every patient. Patients were
                                                                                                                                                                                                  *Lysis marker value is measured as the highest level of LDH in the seven days following the first course of chemotherapy.

                                                                                                                                                                                                                                                                                                                                  grouped according to the presence vs. absence of N-MYC
                                                                                                                                                                                                                                                                                                                                  amplification. Data were compared using Fisher’s test.
                                                                                                                                  Centile

                                                                                                                                                99th
                                                                                                                                                                95th
                                                                                                                                                                                95th
                                                                                                                                                                                         90th

                                                                                                                                                                                                                                                                                                                                  RESULTS
                                                                                                                                  Mean

                                                                                                                                                153
                                                                                                                                                                146
                                                                                                                                                                                132
                                                                                                                                                                                         140
                                                                                                             HR

                                                                                                                                                                                                                                                                                                                                  In the examined period, 44 patients were diagnosed with High-
                                                                                                                                                                                                  HR, Heart Rate; SBP, Systolic Blood Pressure (mmHg); LDH, lactate dehydrogenase (U/L).

                                                                                                                                                                                                                                                                                                                                  risk neuroblastoma at our institution and were included in the
                                                                                                             Hemoperitoneum

                                                                                                                                                                                                                                                                                                                                  present study. None of the patient had pre-existing comorbidities
                                                                                                                                                                                                                                                                                                                                  and coagulation tests, hepatic and renal function tests did not
                                                                                                                                                                                                                                                                                                                                  reveal any abnormality in any patient.
                 TABLE 2 | Patients’ characteristics at onset of hemorrhage (group A).

                                                                                                                                                                                                                                                                                                                                      All the patients had avid uptake on MIBG scan.
                                                                                         Complication

                                                                                                                                                                                                                                                                                                                                      All the patients received induction chemotherapy according
                                                                                                                                                                Yes

                                                                                                                                                                                         Yes

                                                                                                                                                                                                                                                                                                                                  to the Rapid COJEC schedule of the High Risk Neuroblastoma
                                                                                                                                                                                                                                                                                                                                  Study 1.8 of SIOP-Europe (SIOPEN) (10).
                                                                                                             Hemothorax

                                                                                                                                                                                                                                                                                                                                      Four patients (9%) developed hemorrhagic complications
                                                                                                                                                                                                                                                                                                                                  within 2–7 days (mean 3.25 days) after the administration of the
                                                                                                                                                                                                                                                                                                                                  first course of chemotherapy and were categorized in group A;
                                                                                                                                                Yes
                                                                                                                                                                Yes
                                                                                                                                                                                Yes

                                                                                                                                                                                                                                                                                                                                  two patients had hemothorax, one patient had hemoperitoneum
                                                                                                                                                                                                                                                                                                                                  and one patient had hemothorax and hemoperitoneum. All these
                                                                                         from chemotherapy
                                                                                          hemorrhage days

                                                                                                                                                                                                                                                                                                                                  patients had primary left retroperitoneal tumors, one patient also
                                                                                                                                                                                                                                                                                                                                  had extension of neoplastic tissue in the posterior mediastinum
                                                                                              Onset of

                                                                                                                                                                                                                                                                                                                                  (Figure 1) and all of them presented with encasement of the
                                                                                                                                                2
                                                                                                                                                                2
                                                                                                                                                                                7
                                                                                                                                                                                         2

                                                                                                                                                                                                                                                                                                                                  aorta, the celiac tripod, the superior mesenteric artery and the left
                                                                                                                                                                                                                                                                                                                                  renal pedicle. Two patients had stage L2 disease, and two patients
                                                                                                                                                                                                                                                                                                                                  had stage M disease and no one of them had evidence of active
                                                                                                                                                                                                                                                                                                                                  bleeding on the initial staging CT scan. The clinical features of
                                                                                         Patient

                                                                                                                                                                                                                                                                                                                                  these patients at diagnosis and at the onset of hemorrhage are
                                                                                                                                                                                                                                                                                                                                  summarized in Tables 1, 2, respectively.
                                                                                                                                                1
                                                                                                                                                                2
                                                                                                                                                                                3
                                                                                                                                                                                         4

Frontiers in Pediatrics | www.frontiersin.org                                                                                                                                                                                                                                                                                 4                                   November 2021 | Volume 9 | Article 761896
Voglino et al.                                                                                             Hemorrhage in Neuroblastoma: Additional Risk Factors

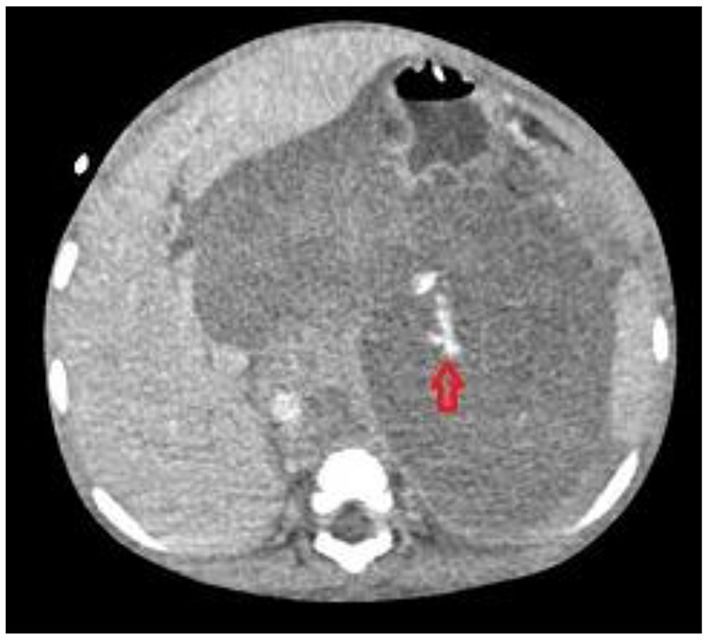
 FIGURE 2 | Bleeding from left diaphragmatic artery (CT scan: circle).

                                                                                  FIGURE 4 | Embolization of left diaphragmatic artery (angiography: circle).

                                                                                 bleeding from the left diaphragmatic artery (Figures 2, 3); this
                                                                                 patient underwent thoracostomy tube placement and angio-
                                                                                 embolization of the bleeding vessel (Figure 4). The patient with
                                                                                 isolated hemoperitoneum received medical treatment only.
                                                                                    All the patients successfully recovered after the hemorrhagic
                                                                                 complications. Table 3 summarizes the treatment for each
                                                                                 patient. One patient died of progressive disease 4 months after
                                                                                 diagnosis, two patients are currently on first line treatment
                                                                                 and one patient is in complete remission with a follow up of
                                                                                 52 months.
                                                                                    Forty patients (91%) did not develop hemorrhagic
                                                                                 complications and were therefore categorized in group B.
                                                                                 Thirty-seven patients (92.5%) had primary retroperitoneal
                                                                                 tumor, with mediastinal extension in two cases. Two patients
                                                                                 (5%) had primary mediastinal tumors and one patient (2.5%)
                                                                                 had primary cervical localization. Four patients (10%) had
                                                                                 stage L2 disease and 36 (90%) had stage M disease. None of
                                                                                 these patients developed hemorrhagic complications during
                                                                                 subsequent courses of chemotherapy.

 FIGURE 3 | Bleeding from left diaphragmatic artery (angiography: circle).       Clinical Features
                                                                                 Age at diagnosis: median age for patients in group A was
                                                                                 18 months (range 15–47 months) while mean age in group
                                                                                 B was 42 months (range 11–199 months). Patients in group
   All these four patients received medical treatment consisting                 A were significantly younger than patients in group B (p =
in packed red cells and platelets transfusions, plasma or purified               0.0343; Mann-Whitney).
vitamin K-dependent clotting factors infusions and albumin                          Time from onset of symptoms to diagnosis: median time was
infusions. The two patients with isolated hemothorax underwent                   3 weeks in group A (range 1–4 weeks) and 4 weeks in group B
thoracostomy tube placement. The patient with associated                         (range 1–22 weeks). The difference between the two groups was
hemothorax and hemoperitoneum had radiological evidence of                       not statistically significant (p = 0.2741; Mann-Whitney).

Frontiers in Pediatrics | www.frontiersin.org                                5                                        November 2021 | Volume 9 | Article 761896
Voglino et al.                                                                                                              Hemorrhage in Neuroblastoma: Additional Risk Factors

   Systemic symptoms: all the patients (100%) in group A

                                                                                                                     ICU stay

                                                                                                                                                                                                                                                                Mechanical ventilation x 5 days 6 days
                                                                                                                                                                                                                                                                                                                         Mechanical ventilation x 3 days 9 days
presented with systemic symptoms while 26 patients (72.5%)

                                                                                                                                                                                                                 HFNC (FiO2 30%; 20 l/min) x 3 days
in group B had systemic symptoms at diagnosis. There was no
statistically significant difference between the two groups (p =
0.2897; Fisher’s).
   Arterial pressure: all the patients in group A (100%) presented

                                                                                                                     Respiratory support
with stage 2 hypertension while 3 patients (7.5%) in group B
had stage 2 hypertension. Patients in group A had a statistically
significant higher severity of hypertension (p = 0.0003; Fisher’s).

Laboratory Findings
Hemoglobin levels: mean hemoglobin level was 7.6 gr/dL (SD

                                                                                                                                                                Clotting fact Purified Chest tube Embolization
0.9 gr/dL; range 6.6–8.7 gr/dL) in group A and 9.9 gr/dL (SD

                                                                                                                     Operative treatment
1.9 gr/dL; range 5.8–14.7 gr/dL) for group B. The difference
between the two groups was statistically significant (p = 0.0007;

                                                                                                                                                                                                                                                                Yes
Student’s t-test).
   LDH levels: median LDH serum level was 3,745 IU/L (range
2834–6677 IU/L) for group A and 1,089 IU/L (range 366–

                                                                                                                                                                                                                 20 UI/Kg Yes
                                                                                                                                                                                                                                                                45 UI/Kg Yes
                                                                                                                                                                                                                                                                                                                         Yes
8,640 IU/L) for group B. Patients in group A had statistically
significant higher levels of LDH compared to group B (p =

                                                                                                                                                                                                                                                                                                                                                                                  50 UI/Kg
                                                                                                                                                                              factors
                                                                                                                                                                                vit-k
0.009; Mann-Whitney).
   Urinary VMA and HVA levels: median VMA level was
12.9 mcg/mg creat (range 6.25–24.0 mcg/mg creat) for group

                                                                                                                                                                  Plasma

                                                                                                                                                                                                                 2 units
                                                                                                                                                                                                                                                                1 unit
A and 98.4 mcg/mg creat (range 5.0–2657.0 mcg/mg creat)
for group B. The difference was statistically significant (p =
0.0048; Mann-Whitney).

                                                                                                                                            red cells Platelets
   Median HVA level was 27.5 mcg/mg creat (range 20.0–197.0

                                                                                                                                                                                                                                                                10 units
                                                                                                                                                                                                                                                                                                                         4 units
                                                                                                                                                                                                                                                                                                                                                                                  8 units
mcg/mg creat) for group A and 128.1 mcg/mg creat (range
9.5–2,191.0 mcg/mg creat) for group B. The difference was not
                                                                                                                                           Blood prod

                                                                                                                                                                                                                                                                0.3 mg/Kg/day 0.5 mg/Kg/day 1.5 gr/kg x 4 dd 120 mL/kg
statistically significant (p = 0.0612, Mann-Whitney).

                                                                                                                                                                                                                 20 mL/kg

                                                                                                                                                                                                                                                                                                                         0.3 mg/Kg/day 0.4 mg/Kg/day 0.5 gr/Kg x 10 dd 40 mL/kg
                                                                                                                                                                                                                                                                                                                                                                                  0.4 mg/Kg/day 0.6 mg/Kg/day 0.5 gr/Kg x 10 dd 40 mL/kg
                                                                                                                     Medical treatment

Radiologic Assessment
Maximum diameter of the primary tumor: mean value for
                                                                                                                                                                                                                 0.3 mg/Kg/day 0.5 mg/Kg/day 1.0 gr/kg x 6 dd
maximum diameter of the primary tumor was 14.6 cm (SD
                                                                                                                                           Albumine

1.6 cm; range 13.5–17.0 cm) for group A and 10.9 cm (SD 3.8 cm;
range 4.1 – 18.0 cm). The difference between the two groups was
not statistically significant (p = 0.0625, Student’s t-test).
   Vascular and total Image Defined Risk Factors (IDRF): all
                                                                                                                                           Carvedilol

the patients in group A had 4 vascular IDRF, while mean
number of vascular IDRF in group B was 2.2 (st. dev 1.1; range
0–4). The difference was statistically significant (p = 0.0024,
Student’s t-test).
                                                                                                                                           Hemothorax Hemoperitoneum Amlodipine

   The mean number of total IDRF was 4.2 (SD 0.5; range 4–5)
in group A and 3.2 (SD 1.4; range 0–5) in group B. The difference
between the two groups was not statistically significant (p =
0.0752, Student’s t-test).
                                                                          TABLE 3 | Patients’ treatment (group A).

   Stage: in group A 2 patients had stage L2 disease and 2 patients
had stage M disease 50–50%). In group B 4 patients had stage L2
                                                                                                                     Complication

disease and 36 had stage M disease (10–90%). The difference was
                                                                                                                                                                                                                                                                                                                                                                                                                                           HFNC, High Flow Nasal Cannula.

not statistically significant (p = 0.0834, Fisher’s).
                                                                                                                                                                                                                                                                Yes

                                                                                                                                                                                                                                                                                                                                                                                  Yes

Histology/Biology
Bone marrow infiltration: one patient (25%) in group A had bone
marrow infiltrates while 34 patients (85%) in group B had positive
                                                                                                                                                                                                                 Yes
                                                                                                                                                                                                                                                                Yes
                                                                                                                                                                                                                                                                                                                         Yes

bone marrow biopsy. Patients with hemorrhagic complications
                                                                                                                     Patient

had a significantly lower incidence of bone marrow metastases (p
= 0.0226, Fisher’s).
                                                                                                                                                                                                                 1
                                                                                                                                                                                                                                                                2
                                                                                                                                                                                                                                                                                                                         3
                                                                                                                                                                                                                                                                                                                                                                                  4

Frontiers in Pediatrics | www.frontiersin.org                         6                                                                                                                        November 2021 | Volume 9 | Article 761896
Voglino et al.                                                                                                       Hemorrhage in Neuroblastoma: Additional Risk Factors

TABLE 4 | Comparison and statistics.

                                                                 Group A                                 Group B                                 p-value

Number of patients                                                   4                                       40
Clinical presentation
Age (months: median + range)                                        18                 15–47                 42                  11–199           0.0343         Significant
Time from onset to diagnosis (weeks: median + range)                 3                    1–4                 4                   1–22            0.2741
Systemic symptoms (n. of pts + percentage)                           4                 100%                  26                  72.50%           0.2897
Arterial pressure (n. of pts + percentage)
  Hypertension stage 2                                               4                 100%                   3                  7.50%            0.0003         Significant
  Hypertension stage 1                                               0                    0%                  7                  17.50%
  Normal arterial pressure                                           0                    0%                 30                   75%
Laboratory findings
Hb (gr/dL: mean + standard deviation)                               7.6                   0.9                9.9                  1.9             0.0007         Significant
LDH (IU/L: median + range)                                         3,745           2,834–6,677             1,864             366–8,640            0.009          Significant
VMA (mcg/mg creat: median + range)                                 12.9              6.25–24.0              98.4            5.0–2,657.0           0.0048         Significant
HVA (mcg/mg creat: median + range)                                 27.5             20.0–197.0             128.1            9.5–2,191.0           0.0612
Radiology
Maximum diameter (cm: mean + standard deviation)                   14.6                   1.6               10.9                  3.8             0.0625
IDRF (number + standard deviation)
  Vascular                                                           4                     0                 2.2                  1.1             0.0024         Significant
  Total                                                             4.2                   0.5                3.2                  1.4             0.0752
Stage (L2 vs. M)                                                     2                     2                  4                    36             0.0834
Istology/biology
Bone marrow infiltration (n. of pts + percentage)                    1                    25%                34                   85%             0.0226         Significant
N-MYC amplification (n. of pts + percentage)                         4                 100%                  23                  57.50%           0.1468

LDH, lactate dehydrogenase; Hb, hemoglobin; VMA, Vanilmandelic acid; HVA, Homovanillic acid; IDRF, Image-Defined Risk Factors.

   N-MYC amplification: all the patients (100%) in group A had                               Most authors report massive hemorrhage in patients younger
amplification of N-MYC while 23 patients (57.5%) in group B                               than 18 months affected by high risk neuroblastoma with N-
had N-MYC amplification. Such difference was not statistically                            MYC amplification (7, 8, 13, 15–17). In their large case series,
significant (p = 0.1468, Fisher’s).                                                       Qin et al. found two independent risk factors on multivariate
   The variables that were associated with bleeding on univariate                         analysis, i.e., the presence of N-MYC amplification and high
analysis (i.e., age, stage 2 hypertension, hemoglobin levels,                             tumor bulk, measured as maximum diameter of the primary
LDH levels, urinary VMA levels, vascular IDRF, bone marrow                                mass. These authors also reported younger mean age (29 months
infiltration) were subsequently tested for multivariate logistic                          vs. 43 months) and higher LDH values (3148.5 U/L vs. 723
regression; the model resulted in a perfect separation.                                   U/L) in patients with hemorrhage secondary to tumor rupture
   Results are summarized in Table 4.                                                     compared to other neuroblastoma patients (9).
                                                                                             In the present case series, 4 out of 44 (9%) patients experienced
                                                                                          hemorrhage, a proportion that is higher than previous reports
DISCUSSION                                                                                (9). All the patients in group A and the majority of patients
                                                                                          in group B had N-MYC amplification, without statistically
Hemorrhage is an uncommon, life-threatening event in patients                             significant difference between the two groups. Both observations
affected by neuroblastoma (7, 12, 13). In a recent paper, Qin et                          are expected due to the selection of high risk patients only in
al. reported 47 neuroblastoma patients with hemorrhage, either                            the study.
secondary to spontaneous tumor rupture or after chemotherapy                                 The presence of systemic symptoms (i.e., fever, weight loss,
or biopsy, on a total population of ∼1,800 patients, with an                              asthenia) was similar in the two groups. Systemic symptoms are
incidence of approximately 2.6% and poor outcome; treatment                               frequently associated with metastatic neuroblastoma (6, 18); a
was withdrawn in 17 of these patients, while other 5 patients died                        high prevalence of systemic symptoms is therefore anticipated in
as an immediate consequence of this complication (9).                                     a population of high risk neuroblastoma patients.
    The mechanism underlying spontaneous hemorrhage in                                       Patients who experienced hemorrhage were significantly
neuroblastoma has been debated; in neonates, an adrenal mass                              younger than other high risk patients; this observation is
could be crushed between the liver and the spine during delivery,                         consistent with previously published data (9).
causing tumor rupture and subsequent hemorrhage (14), while in                               Patients in group A presented with a higher severity of
older children the presence of neuroblastoma could predispose to                          hypertension compared to group B, i.e., stage 2 according to
adrenal hemorrhage following minor trauma (15).                                           the clinical practice guidelines of the American Academy of

Frontiers in Pediatrics | www.frontiersin.org                                         7                                           November 2021 | Volume 9 | Article 761896
Voglino et al.                                                                                    Hemorrhage in Neuroblastoma: Additional Risk Factors

Pediatrics (11). Hypertension is classified as a life-threatening               In the present case series, all the patients who developed
symptom that warrants chemotherapy in the European Low                      hemorrhagic complications presented with severe hypertension
and Intermediate Risk Neuroblastoma Protocol (19), but the                  (i.e., stage 2), low hemoglobin levels and high serum LDH levels
severity of hypertension is not part of the risk stratification             at diagnosis; such features are easy and immediate to detect and
algorithm and is not reported in previous literature as a risk factor       can be frequently reassessed with commonly available resources
for hemorrhage.                                                             and minimal discomfort for the patient. These three criteria can
   Hypertension in neuroblastoma patients has been associated               therefore be used to differentiate patients who have an additional
with catecholamine release, although a linear correlation between           risk of hemorrhage from other high-risk neuroblastoma patients.
the severity of hypertension and urinary catecholamine levels                   All the patients developed hemorrhage after the initiation of
has not been demonstrated (20, 21). In the present case series,             chemotherapy. We may speculate that chemotherapy-induced
patients with hemorrhagic complications had lower levels of                 tumor lysis, evidenced by a sharp rise in LDH levels (see
urinary VMA compared to patients without hemorrhage. Such                   Table 2) might cause necrosis of the tissue encasing blood
observation is consistent with the study by Qin et al. who report           vessels; in such situation, vessel walls that have previously been
lower urinary VMA and HVA levels in patients who experience                 eroded by neoplastic tissue might be more prone to bleeding. A
neuroblastoma rupture. Streger et al. found low levels of urinary           similar clinical scenario has been demonstrated in patients with
VMA in patients with N-MYC amplification and high levels of                 metastatic choriocarcinoma and is defined as “choriocarcinoma
urinary dopamine in higher stage neuroblastoma (22).                        syndrome” (26). The postulation of a such mechanism in high-
   Patients in group A presented with a high mean number                    risk neuroblastoma patients, however, is speculative; further
of vascular IDRF compared to group B; vascular encasement,                  studies are needed to specifically investigate this issue.
especially of the renal artery (20), may contribute to the                      All these patients had systolic pressure above 90th centile
development of hypertension and also predispose patients to                 for age and height even during active bleeding and under
vascular erosion and bleeding.                                              anti-hypertensive treatment; the only abnormality in their
   Patients who had hemorrhagic complications presented with                hemodynamics was the development of tachycardia (see Table 2).
lower hemoglobin levels at presentation compared to patients                Such observation is in contrast with several studies that report
without hemorrhage despite a lower incidence of bone marrow                 the development of frank hemorrhagic shock secondary to
metastases. Neuroblastoma can alter the microenvironment                    neuroblastoma rupture (7, 9, 13) and highlights the importance
of bone marrow irrespective of neoplastic cell invasion,                    of a high index of suspicion and close monitoring of patients who
causing downregulation of genes involved in cell adhesion,                  present with the aforementioned risk factors.
and in erythrocyte, myeloid, and platelet differentiation                       Three patients had hemothorax ipsilateral to the primary
pathways (23). Neuroblastoma can impair erythropoiesis by                   retroperitoneal tumor. Pleural effusion sometimes can be
selectively disrupting the late stage of erythrocytes’ maturation           associated with retroperitoneal neuroblastoma and is generally
independently of the physical presence of neuroblastoma cells in            interpreted as reactive (27); in our cases, we believe that
the bone marrow, thus reducing hemoglobin levels in peripheral              hemothorax can be secondary to the spreading of retroperitoneal
blood (24). All the patients in our study were affected by high             hemorrhage through the diaphragmatic crura, as suggested by the
risk neuroblastoma and therefore neuroblastoma-induced                      angiography performed in patient 2 (Figure 3).
impaired erythropoiesis should have theoretically affected all                  Neuroblastoma patients with hemorrhagic complications
the patients to a similar extent; patients who are prone to                 need multimodal treatment that should be focused at controlling
develop hemorrhagic complications may be more susceptible to                and limiting the bleeding while supporting vital functions,
the mechanism that inhibits erythropoiesis in neuroblastoma                 consisting in blood products administration, crystalloid and
patients. Another explanation for lower hemoglobin levels could             colloid infusion, surgical drain of hemothorax and angiographic
be related to slow, chronic intratumoral bleeding secondary                 control of the bleeding source.
to vascular erosion in patients who then develops frank                         Some authors have reported cases of successful emergency
hemorrhage; the extent of vascular encasement in these patients             surgery on the primary mass in patients with ruptured
might support the second explanation. Large, multicentric series            neuroblastoma (7, 13); in our case series, all the patients with
are necessary to clarify this issue.                                        hemorrhagic complications presented with encasement of the
   Patients in group A had significantly higher LDH levels at               aorta and its major branches, that is a well-documented risk
diagnosis compared to group B; such data are consistent with the            factor for major surgical complications and incomplete resection
work by Qin et al. and other published case reports (8, 9, 17).             (28–30). In this scenario, emergency surgery on the primary mass
High serum LDH levels at diagnosis are associated with poorer               should be reserved to patients who do not respond to other
outcome in terms of event-free and overall survival in high-                therapeutic measures.
risk neuroblastoma (25) and can be interpreted as the serum                     The present study has an obvious limitation in its retrospective
marker of high tumor burden. Qin et al. have found a correlation            nature; another limitation is the single-institution design of the
between tumor burden, measured as the maximum diameter of                   study, that reduces the number of patients. The main strong
the primary mass, and the risk of neuroblastoma rupture (9);                point of this study is the homogeneity of the patients in both
in the present case series, a statistically significant correlation         groups, who are all affected by high risk neuroblastoma without
between tumor diameter and risk of hemorrhage could not                     pre-existing comorbidities, have a comparable prevalence of
be demonstrated.                                                            metastatic disease, a comparable size of the primary tumor and

Frontiers in Pediatrics | www.frontiersin.org                           8                                   November 2021 | Volume 9 | Article 761896
Voglino et al.                                                                                                   Hemorrhage in Neuroblastoma: Additional Risk Factors

are all treated according to the same protocol; such homogeneity                      DATA AVAILABILITY STATEMENT
reduces the presence of confounding factors in our analyses.
    The result of a perfect separation on multivariate logistic                       The original contributions presented in the study are included
regression is puzzling; it might be the expression of a substantial                   in the article/supplementary material, further inquiries can be
clinical difference between the two groups, or it might be simply                     directed to the corresponding author/s.
related to the small sample size. Further studies with larger
sample size might better clarify such result.                                         AUTHOR CONTRIBUTIONS
    In conclusion, the present data suggest that within the
population of patients affected by high-risk neuroblastoma there                      VV, GP, ACr, ACa, and AI contributed to conception and design
is a subgroup of children with some specific clinical features, i.e.,                 of the study. VV and GP organized the database. CM, ASe,
stage 2 hypertension, anemia, elevated serum LDH levels and                           and UG revised and analyzed the data. GN and PD revised
multiple vascular IDRF at diagnosis, who have an “additional”                         radiology images. ASt revised the pathology specimens. All
risk of developing hemorrhage during induction chemotherapy.                          authors contributed to manuscript revision, read, and approved
    The small sample size of the present study does not                               the submitted version.
allow to establish a clear causal relation; however, we suggest
that patients who present with these features at diagnosis                            ACKNOWLEDGMENTS
are carefully monitored so that hemorrhagic complications
are promptly diagnosed and treated before hemorrhagic                                 The authors thank Dr. Daniela Pacella, Ph.D., from the
shock develops.                                                                       Department of Public Health and Medical Statistics of Federico
    Further studies are needed to confirm the present                                 II University in Naples, and Prof. Francesco Solombrino, Ph.D.,
observations, define cut-off values for these parameters and                          from the Department of Mathematics of Federico II University in
design optimal management strategies for these patients.                              Naples, for critical revision of statistical analysis.

REFERENCES                                                                                  in children. Clinical practice guideline for screening and management
                                                                                            of high blood pressure in children and adolescents. Pediatrics. (2017)
 1. Yan P, Qi F, Bian L, Xu Y, Zhou J, Hu J, et al. Comparison                              140:e20171904. doi: 10.1542/peds.2017-3035
    of incidence and outcomes of neuroblastoma in children, adolescents,              12.   Vora D, Slovis TL, Boal DK. Hemoperitoneum and disseminated intravascular
    and adults in the United States: a Surveillance, Epidemiology, and                      coagulation in two neonates with congenital bilateral neuroblastoma. Pediatr
    End Results (SEER) program population study. Med Sci Monit. (2020)                      Radiol. (2000) 30:394–7. doi: 10.1007/s002470050769
    26:e927218. doi: 10.12659/MSM.927218                                              13.   Honda S, Miyagi H, Minato M, Kubota KC, Okada T. Hemorrhagic shock
 2. Irwin MS, Park JR. Neuroblastoma: paradigm for precision medicine. Pediatr              due to spontaneous rupture of adrenal neuroblastoma in an infant: a rare
    Clin North Am. (2015) 62:225–562. doi: 10.1016/j.pcl.2014.09.015                        case and review of the literature. J Pediatr Hematol Oncol. (2012) 34:635–
 3. Cohn SL, Pearson ADJ, London WB, Monclair T, Ambros PF, Brodeur GM,                     7. doi: 10.1097/MPH.0b013e3182678e1e
    et al. The International Neuroblastoma Risk Group (INRG) classification           14.   Brock CE, Ricketts RR. Hemoperitoneum from spontaneous
    system: an INRG task force report. J Clin Oncol. (2009) 27:289–                         rupture of neonatal neuroblastoma. Am J Dis Child. (1982)
    97. doi: 10.1200/JCO.2008.16.6785                                                       136:370–1. doi: 10.1001/archpedi.1982.03970400088026
 4. Monclair T, Brodeur GM, Ambros PF, Brisse HJ, Cecchetto G, Holmes                 15.   Normand C, Leblond P, Mazingue F, Nelken B, Defachelles AS, Bonnevalle
    K, et al. The International Neuroblastoma Risk Group (INRG) staging                     M. A case of adrenal haemorrhage after minor trauma in a young
    system: an INRG task force report. J Clin Oncol. (2009) 27:298–                         child: think of neuroblastoma. Eur J Pediatr Surg. (2006) 16:365–
    303. doi: 10.1200/JCO.2008.16.6876                                                      8. doi: 10.1055/s-2006-924605
 5. Whittle SB, Smith V, Doherty E, Zhao S, McCarty S, Zage PE. Overview and          16.   Tay M, Kapur J. Neuroblastoma with primary pleural involvement:
    recent advances in the treatment of neuroblastoma. Expert Rev Anticancer                an      unusual    presentation.    Pediatr    Radiol.    (2011)     41:530–
    Ther. (2017) 17:369–86.. doi: 10.1080/14737140.2017.1285230                             3. doi: 10.1007/s00247-010-1884-3
 6. Tolbert VP, Matthay KK. Neuroblastoma: clinical and biological approach           17.   Lode HN, Henze G, Siebert N, Ehlert K, Barthlen W. Management of
    to risk stratification and treatment. Cell Tissue Res. (2018) 372:195–                  tumor rupture and abdominal compartment syndrome in an infant with
    209. doi: 10.1007/s00441-018-2821-2                                                     bilateral high risk stage 4 neuroblastoma: a case report. Medicine. (2019)
 7. Meersman A, Wojciechowski M, Vaneerdeweg W, Jorens P, Michiels                          98:e16752. doi: 10.1097/MD.0000000000016752
    E, Ramet J. Acute retroperitoneal hemorrhage and shock as presenting              18.   Chung C, Boterberg T, Lucas J, Panoff J, Valteau-Couanet
    signs of neuroblastoma in an infant. Pediatr Emerg Care. (2008) 24:37–                  D, Hero B. Neuroblastoma. Pediatr Blood Cancer. (2021)
    8. doi: 10.1097/pec.0b013e31815f3c60                                                    68:e28473. doi: 10.1002/pbc.28473
 8. Shiokawa N, Okamoto Y, Kodama Y, Nishikawa T, Tanabe T, Mukai M, et al.           19.   European Low and Intermediate Risk Neuroblastoma Protocol: a SIOPEN
    Conservative treatment of massive hemothorax in a girl with neuroblastoma.              Study; Version 5.0; 1st October 2015. Available online at: https://bspho.be/
    Pediatr Int. (2016) 58:1090–2. doi: 10.1111/ped.13094                                   wp-content/uploads/2019/05/LINES-20170102-LINES_Protocol_version-5.
 9. Qin H, Yang S, Cai S, Ren Q, Han W, Yang W, et al. Clinical characteristics             0.pdf (accessed July 24, 2021).
    and risk factors of 47 cases with ruptured neuroblastoma in children. BMC         20.   Madre C, Orbach D, Baudouin V, Brisse H, Bessa F, Schleiermacher
    Cancer. (2020) 20:243. doi: 10.1186/s12885-020-06720-9                                  G, et al. Hypertension in childhood cancer: a frequent complication
10. High Risk Neuroblastoma Study 1.8 of SIOP-Europe (SIOPEN). Available                    of certain tumor sites. J Pediatr Hematol Oncol. (2006) 28:659–
    online at: https://clinicaltrials.gov/ct2/show/NCT01704716 (accessed                    64. doi: 10.1097/01.mph.0000212995.56812.bb
    November 18, 2019).                                                               21.   Kwok SY, Cheng FWT, Lo AFC, Leung WK, Yam MC, Li CK. Variants
11. Flynn JT, Kaelber DC, Baker-Smith CM, Blowey D, Carroll AE, Daniels SR,                 of cardiomyopathy and hypertension in neuroblastoma. J Pediatr Hematol
    et al. Subcommittee on screening and management of high blood pressure                  Oncol. (2014) 36:e158-61. doi: 10.1097/MPH.0b013e318290c628

Frontiers in Pediatrics | www.frontiersin.org                                     9                                         November 2021 | Volume 9 | Article 761896
Voglino et al.                                                                                                      Hemorrhage in Neuroblastoma: Additional Risk Factors

22. Strenger V, Kerbl R, Dornbusch H J, Ladenstein R, Ambros PF,                        29. Irtan S, Brisse HJ, Minard-Colin V, Schleiermacher G, Galmiche-Rolland L,
    Ambros IM, et al. Diagnostic and prognostic impact of urinary                           Le Cossec C, et al. Image-defined risk factor assessment of neurogenic tumors
    catecholamines in neuroblastoma patients. Pediatr Blood Cancer. (2007)                  after neoadjuvant chemotherapy is useful for predicting intra-operative risk
    48:504–9. doi: 10.1002/pbc.20888                                                        factors and the completeness of resection. Pediatr Blood Cancer. (2015)
23. Scaruffi P, Morandi F, Gallo F, Stigliani S, Parodi S, Moretti S, et al.                62:1543–9. doi: 10.1002/pbc.25511
    Bone marrow of neuroblastoma patients shows downregulation of CXCL12                30. Temple WC, Vo KT, Matthay KK, Balliu B, Coleman C, Michlitsch J,
    expression and presence of IFN signature. Pediatr Blood Cancer. (2012)                  et al. Association of image-defined risk factors with clinical features,
    59:44–51. doi: 10.1002/pbc.23339                                                        histopathology, and outcomes in neuroblastoma. Cancer Med. (2021)
24. Morandi F, Barco S, Stigliani S, Croce M, Persico L, Lagazio                            10:2232–41. doi: 10.1002/cam4.3663
    C, et al. Altered erythropoiesis and decreased number of
    erythrocytes in children with neuroblastoma. Oncotarget. (2017)                     Conflict of Interest: The authors declare that the research was conducted in the
    8:53194–209. doi: 10.18632/oncotarget.18285                                         absence of any commercial or financial relationships that could be construed as a
25. Moreno L, Guo D, Irwin MS, Hogarty M, Kamijo T, Morgenstern                         potential conflict of interest.
    D, et al. A nomogram of clinical and biologic factors to predict
    survival in children newly diagnosed with high-risk neuroblastoma: an               Publisher’s Note: All claims expressed in this article are solely those of the authors
    International Neuroblastoma Risk Group project. Pediatr Blood Cancer.               and do not necessarily represent those of their affiliated organizations, or those of
    (2021) 68:e28794. doi: 10.1002/pbc.28794
                                                                                        the publisher, the editors and the reviewers. Any product that may be evaluated in
26. Rejlekova K, Cursano MC, De Giorgi U, Mego M. Severe complications in
                                                                                        this article, or claim that may be made by its manufacturer, is not guaranteed or
    testicular germ cell tumors: the choriocarcinoma syndrome. Front Endocrinol.
    (2019) 10:218. doi: 10.3389/fendo.2019.00218                                        endorsed by the publisher.
27. Gupta H, Conrad J, Khoury JD, McGregor LM, Krasin MJ, Dome JS, et
    al. Significance of pleural effusion in neuroblastoma. Pediatr Blood Cancer.        Copyright © 2021 Voglino, Persano, Crocoli, Castellano, Serra, Giordano, Natali,
    (2007) 49:906–8. doi: 10.1002/pbc.21199                                             Di Paolo, Martucci, Stracuzzi and Inserra. This is an open-access article distributed
28. Cecchetto G, Mosseri V, De Bernardi B, Helardot P, Monclair T,                      under the terms of the Creative Commons Attribution License (CC BY). The use,
    Costa E, et al. Surgical risk factors in primary surgery for localized              distribution or reproduction in other forums is permitted, provided the original
    neuroblastoma: the LNESG1 study of the European International Society of            author(s) and the copyright owner(s) are credited and that the original publication
    Pediatric Oncology Neuroblastoma Group. J Clin Oncol. (2005) 23:8483–               in this journal is cited, in accordance with accepted academic practice. No use,
    9. doi: 10.1200/JCO.2005.02.4661                                                    distribution or reproduction is permitted which does not comply with these terms.

Frontiers in Pediatrics | www.frontiersin.org                                      10                                           November 2021 | Volume 9 | Article 761896
You can also read