High-coverage genomes to elucidate the evolution of penguins
←
→
Page content transcription
If your browser does not render page correctly, please read the page content below
GigaScience, 8, 2019, 1–17

                                                                                 doi: 10.1093/gigascience/giz117
                                                                                 Data Note

DATA NOTE

High-coverage genomes to elucidate the evolution of

                                                                                                                                                     Downloaded from https://academic.oup.com/gigascience/article/8/9/giz117/5571031 by guest on 04 August 2021
penguins
                               †                                             †
Hailin Pan 1,2,3, , Theresa L. Cole 4,5, , Xupeng Bi1,6,7 , Miaoquan Fang1,6,7 ,
Chengran Zhou1,6 , Zhengtao Yang1,6 , Daniel T. Ksepka 8 , Tom Hart9 ,
Juan L. Bouzat10 , Lisa S. Argilla11 , Mads F. Bertelsen12,13 , P. Dee Boersma14 ,
Charles-André Bost 15 , Yves Cherel15 , Peter Dann16 , Steven R. Fiddaman17 ,
Pauline Howard18,19 , Kim Labuschagne20 , Thomas Mattern5 , Gary Miller21,22 ,
Patricia Parker23 , Richard A. Phillips24 , Petra Quillfeldt25 , Peter G. Ryan26 ,
Helen Taylor27,28 , David R. Thompson29 , Melanie J. Young5 , Martin
R. Ellegaard30 , M. Thomas P. Gilbert30,31 , Mikkel-Holger S. Sinding 30 ,
George Pacheco30 , Lara D. Shepherd32 , Alan J. D. Tennyson32 ,
Stefanie Grosser5,33 , Emily Kay34,35 , Lisa J. Nupen26,36 , Ursula Ellenberg37,38 ,
David M. Houston39 , Andrew Hart Reeve3,40 , Kathryn Johnson34,35 ,
Juan F. Masello25 , Thomas Stracke19 , Bruce McKinlay41 , Pablo
Garcı́a Borboroglu 14,42,43 , De-Xing Zhang44 and Guojie Zhang 1,2,3,7,*
1
 BGI-Shenzhen, Beishan Industrial Zone, Yantian District, Shenzhen 518083, China; 2 State Key Laboratory of
Genetic Resources and Evolution, Kunming Institute of Zoology, Chinese Academy of Sciences, Kunming,
China; 3 Section for Ecology and Evolution, Department of Biology, University of Copenhagen, DK-2100
Copenhagen, Denmark; 4 Manaaki Whenua Landcare Research, PO Box 69040, Lincoln, Canterbury 7640, New
Zealand; 5 Department of Zoology, University of Otago, PO Box 56, Dunedin, Otago 9054, New Zealand; 6 China
National Genebank, BGI-Shenzhen, Shenzhen, Guangdong, China; 7 Center for Excellence in Animal Evolution
and Genetics, Chinese Academy of Sciences, Kunming 650223, China; 8 Bruce Museum, Greenwich, CT 06830,
USA; 9 Department of Zoology, University of Oxford, 11a Mansfield Road, Oxford OX1 3SZ, UK; 10 Department of
Biological Sciences, Bowling Green State University, Bowling Green, OH 43403, USA; 11 The Wildlife Hospital
Dunedin, School of Veterinary Nursing, Otago Polytechnic, Dunedin, Otago 9016,New Zealand; 12 Copenhagen
Zoo, Roskildevej 38, DK-2000 Frederiksberg, Denmark; 13 Department of Veterinary and Animal Sciences,
University of Copenhagen, Copenhagen, Denmark; 14 Center for Ecosystem Sentinels, Department of Biology,
University of Washington, Seattle, WA 98195, USA; 15 Centre d’Etudes Biologiques de Chizé (CEBC), UMR 7372
du CNRS-La Rochelle Université, 79360 Villiers-en-Bois, France; 16 Research Department, Phillip Island Nature

Received: 3 August 2019; Revised: 29 August 2019; Accepted: 29 August 2019

C The Author(s) 2019. Published by Oxford University Press. This is an Open Access article distributed under the terms of the Creative Commons

Attribution License (http://creativecommons.org/licenses/by/4.0/), which permits unrestricted reuse, distribution, and reproduction in any medium,
provided the original work is properly cited.

                                                                                                                                                 1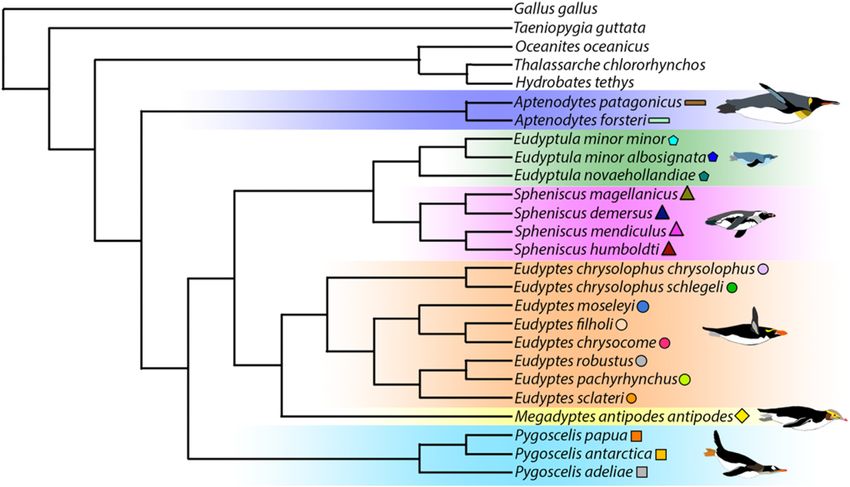
2     High-coverage genomes to elucidate the evolution of penguins

Parks, PO Box 97, Cowes, Phillip Island, Victoria, 3922, Australia; 17 Department of Zoology, University of Oxford,
Peter Medawar Building for Pathogen Research, South Parks Road, Oxford OX1 3SY, UK; 18 Hornby Veterinary
Centre, 7 Tower Street, Hornby, Christchurch, Canterbury 8042, New Zealand; 19 South Island Wildlife Hospital,
Christchurch, Canterbury, New Zealand; 20 National Zoological Garden, South African National Biodiversity
Institute, P.O. Box 754, Pretoria 0001, South Africa; 21 Division of Pathology and Laboratory Medicine, University
of Western Australia, Crawley, Western Australia 6009, Australia; 22 Institute for Marine and Antarctic Studies,
University of Tasmania, Hobart, Tasmania 7001, Australia; 23 Department of Biology, University of Missouri St.
Louis, St Louis, MO 63121, USA; 24 British Antarctic Survey, Natural Environment Research Council, High Cross,
Cambridge, UK; 25 Justus-Liebig-Universität Giessen, Heinrich-Buff-Ring 26, 35392 Giessen, Germany;
26
   FitzPatrick Institute of African Ornithology, University of Cape Town, Rondebosch 7701, South Africa; 27 Vet
Services Hawkes Bay Ltd, 801 Heretaunga Street, Hastings, New Zealand; 28 Wairoa Farm Vets, 77 Queen Street,

                                                                                                                                                       Downloaded from https://academic.oup.com/gigascience/article/8/9/giz117/5571031 by guest on 04 August 2021
Wairoa 4108, New Zealand; 29 National Institute of Water and Atmospheric Research Ltd., Private Bag 14901,
Kilbirnie, Wellington 6241, New Zealand; 30 Section for Evolutionary Genomics, The GLOBE Institute, Faculty of
Health and Medical Sciences, University of Copenhagen, Øster Farimagsgade 5A, Copenhagen, Denmark;
31
   NTNU University Museum, Trondheim, Norway; 32 Museum of New Zealand Te Papa Tongarewa, PO Box 467,
Wellington 6140, New Zealand; 33 Division of Evolutionary Biology, Faculty of Biology, LMU Munich,
Großhaderner Str. 2, 82152 Planegg-Martinsried, Germany; 34 Wildbase, Massey University, Private Bag 11 222,
Palmerston North 4442, New Zealand; 35 Wellington Zoo, 200 Daniell St, Newtown, Wellington 6021, New
Zealand; 36 National Zoological Gardens of South Africa, Pretoria, South Africa; 37 Department of Ecology,
Environment and Evolution, La Trobe University, Melbourne, Victoria, Australia; 38 Global Penguin Society,
University of Washington, Seattle, WA, USA; 39 Biodiversity Group, Department of Conservation, Auckland,
New Zealand; 40 Department of Biology, Natural History Museum of Denmark, University of Copenhagen,
Copenhagen, Denmark; 41 Biodiversity Group, Department of Conservation, Dunedin, New Zealand; 42 Global
Penguin Society, Puerto Madryn 9120, Argentina; 43 CESIMAR CCT Cenpat-CONICET, Puerto Madryn 9120,
Chubut, Argentina and 44 Center for Computational and Evolutionary Biology, Institute of Zoology, Chinese
Academy of Sciences, 1 Beichen West Road, Beijing 100101, China
∗
  Correspondence address. Guojie Zhang, E-mail: Building 3, Universitetsparken 15, Department of Biology, University of Copenhagen, Copenhagen 2100,
Denmark.Guojie.Zhang@bio.ku.dk http://orcid.org/0000-0001-6860-1521
†
  Contributed equally to this work.

Abstract
Background: Penguins (Sphenisciformes) are a remarkable order of flightless wing-propelled diving seabirds distributed
widely across the southern hemisphere. They share a volant common ancestor with Procellariiformes close to the
Cretaceous-Paleogene boundary (66 million years ago) and subsequently lost the ability to fly but enhanced their diving
capabilities. With ∼20 species among 6 genera, penguins range from the tropical Galápagos Islands to the oceanic
temperate forests of New Zealand, the rocky coastlines of the sub-Antarctic islands, and the sea ice around Antarctica. To
inhabit such diverse and extreme environments, penguins evolved many physiological and morphological adaptations.
However, they are also highly sensitive to climate change. Therefore, penguins provide an exciting target system for
understanding the evolutionary processes of speciation, adaptation, and demography. Genomic data are an emerging
resource for addressing questions about such processes. Results: Here we present a novel dataset of 19 high-coverage
genomes that, together with 2 previously published genomes, encompass all extant penguin species. We also present a
well-supported phylogeny to clarify the relationships among penguins. In contrast to recent studies, our results
demonstrate that the genus Aptenodytes is basal and sister to all other extant penguin genera, providing intriguing new
insights into the adaptation of penguins to Antarctica. As such, our dataset provides a novel resource for understanding the
evolutionary history of penguins as a clade, as well as the fine-scale relationships of individual penguin lineages. Against
this background, we introduce a major consortium of international scientists dedicated to studying these genomes.
Moreover, we highlight emerging issues regarding ensuring legal and respectful indigenous consultation, particularly for
genomic data originating from New Zealand Taonga species. Conclusions: We believe that our dataset and project will be
important for understanding evolution, increasing cultural heritage and guiding the conservation of this iconic southern
hemisphere species assemblage.

Keywords: genomics; Sphenisciformes; comparative evolution; phylogenetics; speciation; biogeography; demography;
climate change; Antarctica; evolution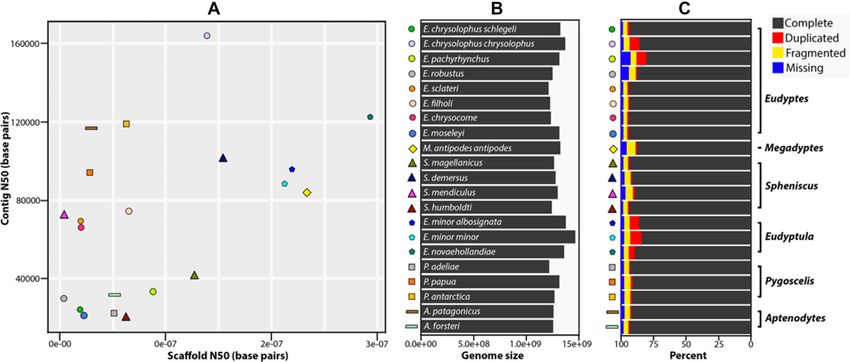
Pan et al.     3

Data Description                                                     riencing seasonal fluctuations in the length of daylight across
                                                                     the breeding and chick-rearing seasons [24], others inhabit rela-
Context
                                                                     tively temperate or even tropical climates, with little variation in
Penguins (Sphenisciformes) are a unique order of seabirds dis-       day length. The unique morphological and physiological adap-
tributed widely across the southern hemisphere (Fig. 1). Ap-         tations that have evolved within penguins include the complete
proximately 20 extant penguin species are recognized across 6        loss of aerial flight, where penguins instead use their flipper-like
well-defined genera (Aptenodytes, Pygoscelis, Eudyptula, Sphenis-    wings in wing-propelled diving [25], densely packed waterproof
cus, Eudyptes, and Megadyptes [1–3]). Debate has surrounded          and insulating feathers [26, 27], visual sensitivity of the eye lens
species/lineage boundaries in a few key areas:                       for underwater predation [28–30], dense bones, stiff wing joints
                                                                     and reduced distal wing musculature to overcome buoyancy in
1. Divisions between New Zealand little blue (Eudyptula mi-
                                                                     water [31–33], enhanced thermoregulation for extreme low tem-
   nor minor), New Zealand white-flippered (Eudyptula minor al-
                                                                     peratures, long-term fasting, ability to digest secreted food, de-
   bosignata), and Australian fairy penguins (Eudyptula novae-
                                                                     layed digestion [34–40], different plumage [41] and crest orna-
   hollandiae) [4–6].

                                                                                                                                            Downloaded from https://academic.oup.com/gigascience/article/8/9/giz117/5571031 by guest on 04 August 2021
                                                                     ments [42], and catastrophic moult [43]. As such, penguins are
2. Divisions between northern rockhopper (Eudyptes moseleyi),
                                                                     an excellent system to study comparative evolution of adaptive
   western rockhopper (Eudytes chrysocome), and eastern rock-
                                                                     traits.
   hopper penguins (Eudyptes filholi) [3, 7, 8].
                                                                         Penguins are also sentinels of the Southern Ocean [16], be-
3. Divisions      between    Fiordland       crested (Eudyptes
                                                                     ing particularly sensitive to human and environmental change
   pachyrhynchus) and Snares crested penguins (Eudyptes
                                                                     [44, 45]. Extensive demographic monitoring programs have in-
   robustus) [9, 10].
                                                                     dicated that many penguin species are declining in response to
4. Divisions between macaroni (Eudyptes chrysolophus chrysolo-
                                                                     global warming [44–46], pollution, environmental degradation,
   phus) and royal penguins (Eudyptes chrysolophus schlegeli)
                                                                     and competition with fisheries, which are considered key drivers
   [3, 8, 11].
                                                                     of these population declines [47–50]. Demographic coalescent
    Penguins have an extensive fossil record, with >50 extinct       models have demonstrated dramatic population declines dur-
species documented to date [3, 12, 13], extending back >60 mil-      ing the Pleistocene ice ages, followed by rapid population ex-
lion years [12]. Extant penguins span a modest range of sizes [14,   pansions in response to global warming [51–54]. Future global
15], with the emperor penguin (Aptenodytes forsteri) the largest     warming is predicted to cause significant population declines
(30 kg) and Eudyptula penguins the smallest (1 kg). In contrast,     [44, 55–57]. Understanding past demographic histories and in-
the fossil record reveals that many extinct penguin species were     ferring future demographic trajectories therefore remain impor-
giants (surpassing 100 kg in body mass [13]).                        tant steps for predicting ecosystem-wide changes in this rapidly
    The radiation of penguins provides an excellent case study       warming part of the planet.
for researching biogeographic impacts on speciation processes.           Although penguins are a relatively well-studied group, pre-
Penguins inhabit every major coastline in the southern hemi-         vious evolutionary studies have been limited by the genetic
sphere, and almost every island archipelago in the Southern          markers used, such as short mitochondrial [2, 10, 58–60] or nu-
Ocean [16]. Their range extends to unique ecological niches,         clear sequences [1, 8, 61, 62], microsatellites [63, 64], partial
from the tropical Galápagos Islands (Galápagos penguin, Sphenis-   mitochondrial genomes [3, 65], or single-nucleotide polymor-
cus mendiculus) to the oceanic temperate forests of New Zealand      phisms [11, 53, 54, 66–68]. Several studies have hinted at as-
(Eudyptes pachyrhynchus), rocky coastlines of the sub-Antarctic      sociations between biological patterns and climate change [51–
islands (E. filholi), and the sea ice around Antarctica (Apten-      54, 60, 69]. Only a few studies have explored genome-wide evo-
odytes forsteri) [17]. For this reason, penguins have evolved many   lutionary processes among penguins [51, 70] or between pen-
unique adaptations, specific to the variety of ecological envi-      guins and other birds [71–73], and these studies have focussed
ronments. Previous studies have suggested that global climate        on just 2 Antarctic taxa: the Adélie penguin (Pygoscelis adeliae)
change during the Eocene [18, 19], substantial oceanographic         and Aptenodytes forsteri. These previous studies have created a
currents [7], and geological island uplift [3] were key drivers      basic framework to understand the timing of penguin diver-
of penguin diversification. Although the phylogenetic relation-      sification, identify population fluctuations during past climate
ships within penguins are relatively well understood [1, 3, 18,      cycles, and have hinted at the molecular basis for a range of
20], it remains uncertain which lineage first diverged from other    physiological and morphological adaptations [51]. The molecu-
penguins. Molecular analyses have differed on whether Apten-         lar genomic basis for the unique morphological and physiologi-
odytes, Pygoscelis, or both together represent the sister taxa to    cal adaptations of penguins, compared to other aquatic and ter-
all other extant penguins [3]. Both of these genera are endemic      restrial birds, remains largely unknown. No previous study has
to coastal Antarctica and Antarctic and subantarctic islands,        attempted to explore the evolution of all penguins under a com-
and thus a sequential branching pattern would suggest a po-          parative genomic or evolutionary framework. In this Data Note,
lar ancestral area for extant penguins. In contrast, morphologi-     we present 19 new high-quality genomes that, together with
cal data and the fossil record suggest that the more temperate-      the 2 previously reported genomes [51], encompass all extant
adapted genus Spheniscus was the first to diverge [3, 20]. Un-       penguin species. We demonstrate the quality and application
derstanding the evolutionary diversification of penguins in re-      of this new dataset by constructing a well-supported phyloge-
spect to geological and climatic changes remains a substantial       nomic tree of penguins. These data provide a critical resource for
gap in understanding the biogeographic history of these iconic       understanding the drivers of penguin evolution, the molecular
birds.                                                               basis of morphological and physiological adaptations, and de-
    Although penguins are tied to landmasses for breeding and        mographic characteristics. For species naming, we follow stan-
nesting [21], all species spend most of their lives at sea [22]      dard nomenclature; however, for Eudyptula we follow Grosser
and are therefore important components of terrestrial, coastal,      et al. [5, 74] and for Eudyptes and Megadyptes we follow Cole
and marine ecosystems [23]. While some taxa inhabit environ-         et al. [3].
ments with strong winds and extreme cold temperatures, expe-
4 High-coverage genomes to elucidate the evolution of penguins
Downloaded from https://academic.oup.com/gigascience/article/8/9/giz117/5571031 by guest on 04 August 2021
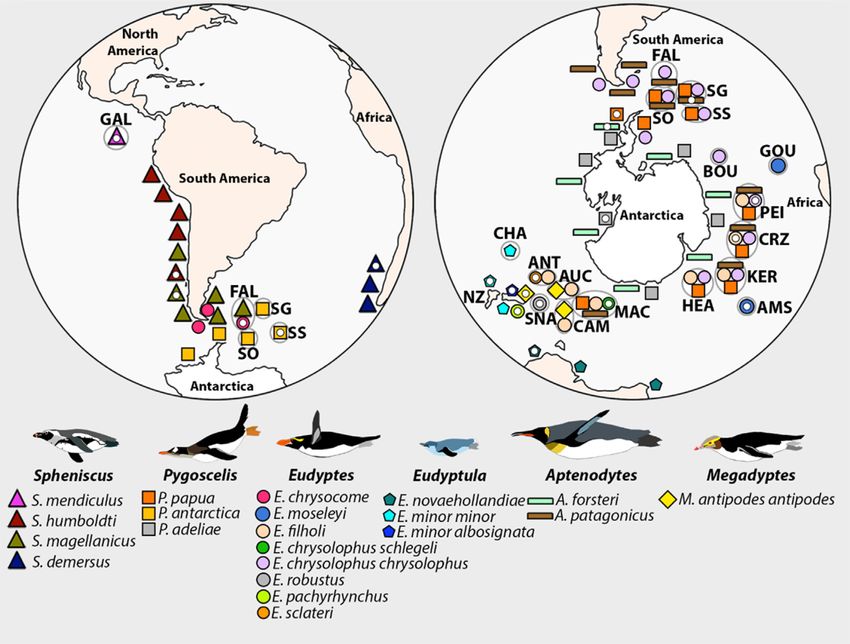
Figure 1: Locations of breeding colonies of penguins and sampling sites for the final genomes, adapted from Ksepka et al. [1]. Sampling locations are shown with a
small white ellipse. Note that the sampling location of the humboldt penguin (Spheniscus humboldti) is unclear because this individual was bred in the Copenhagen zoo,
with ancestors imported from Peru and Chile in 1972. AMS: Amsterdam Island; ANT: Antipodes Islands; AUC: Auckland Islands; BOU: Bouvet; CAM: Campbell Island;
CHA: Chatham Islands; CRZ: Crozet; FAL: Falkland Islands/Malvinas; GAL: Galapagos Islands; GOU: Gough Island; HEA: Heard Island; KER: Kerguelen; MAC: Macquarie
Island; NZ: New Zealand; PEI: Prince Edward/Marion Island; SG: South Georgia; SNA: The Snares; SO: South Orkney Islands; SS: South Sandwich Islands.
Methods sis. Following quality control, a single sample per species was
chosen for genomic library construction (Table 1).
Sample collection, library construction, and sequencing We constructed 1 or more genomic libraries for each of the
While it is possible to recover genome sequences from histori- 19 penguin species depending on the DNA quality. For species
cal museum samples [75], such genomes are often of low qual- that we could obtain high molecular weight DNA with the main
ity and/or fragmented [76], limiting the ability of downstream band longer than 40 kb, we constructed 10X Genomics genomic
analyses. Our project design (see below) relies on high-coverage libraries to produce 100× coverage sequencing data (Table 2). To
genomes with little missing data (see Li et al. [51]). Therefore, do this, we attached a specific unique barcode to 1 end of short
we designed our sample collection to include only high-quality DNA fragments that are broken from 1 long DNA fragment, us-
blood samples. We collected 94 blood samples spanning 19 dif- ing standard protocols provided by ChromiumTM Genome So-
ferent penguin species (1–28 samples per species; Supplemen- lution. Because this protocol encompasses >1 million specific
tary Table 1). Samples were derived from the wild, zoological barcodes in a single solution, it decreases the chance of short
parks, or wildlife hospitals and were obtained according to strict DNA fragments with the same barcode being derived from un-
permitting procedures, animal ethics, and consultation with in- related long DNA fragments. For those species with shorter DNA
digenous representatives (Supplementary Table 1). fragments (111 Gb data per species
ated by pulse gel electrophoresis or 1% agarose gel electrophore- (Table 2).Table 1: Sample collection information for the 21 penguin genomes (including 2 obtained in Li et al. (51)
Date
Latin name Common name Sample type Sampling location Sample label extracted
Eudyptes chrysolophus schlegeli Royal Wild Green Gorge, Macquarie Island 4458 October 2017
Eudyptes chrysolophus chrysolophus Macaroni Wild Marion Island, Prince Edward Islands MP PEI 1 October 2017
Eudyptes pachyrhynchus Fiordland-crested Wild Harrison Cove, Milford Sound, New Zealand South MS 9 May 2017
Island
Eudyptes robustus Snares-crested Dunedin Wildlife Hospital The Snares, New Zealand sub-Antarctic 68M 28/09/13 September
2018
Eudyptes sclateri Erect-crested Wild Antipodes Island, New Zealand sub-Antarctic Ant 5 September
2018
Eudyptes filholi Eastern rockhopper Wild Crozet Island GS 12 May 2016
Eudyptes chrysocome Western rockhopper Wild Falkland Islands/Malvinas RH 110–1 May 2016
Eudyptes moseleyi Northern rockhopper Wild Amsterdam Island NRP 118–1 May 2016
Megadyptes antipodes antipodes Yellow-eyed Wild Otago Peninsula, New Zealand South Island OT 2 9/2/18 August 2018
Spheniscus magellanicus Magellanic Wild Chiloe Island, Chile AH 6 May 2016
Spheniscus demersus African Wild Luderitz, Namibia AP 173 July 2018
Spheniscus mendiculus Galápagos Wild Galápagos Islands GAPE 212 October 2017
Spheniscus humboldti Humboldt Copenhagen Zoo Peru and Chile lineage Z-67–15 October 2016
Eudyptula minor albosignata White-flippered Christchurch Antarctic Banks Peninsula, Canterbury, New Zealand South Fred July 2018
Centre Island
Eudyptula minor minor Little blue National Aquarium of New New Zealand North Island Gonzo August 2018
Zealand
Eudyptula novaehollandiae Fairy Wild Phillip Island, Victoria, Australia 10/9/18–1 October 2018
Pygoscelis adeliae Adélie Wild Inexpressible Island, Antarctica [51] NA
Pygoscelis papua Gentoo Wild West Antarctic Peninsula, Antarctica Gentoo penguin DNA -4 January 2018
Pygoscelis antarctica Chinstrap Wild Thule Island, South Sandwich Islands CP TH 060 November
2017
Aptenodytes patagonicus King Wild Fortuna Bay, South Georgia KP FORT 001 November
2017
Aptenodytes forsteri Emperor Wild Emperor Island, Antarctica [51] NA
Pan et al.
5
Downloaded from https://academic.oup.com/gigascience/article/8/9/giz117/5571031 by guest on 04 August 20216 High-coverage genomes to elucidate the evolution of penguins
Table 2: Details of the sequencing platform used and the data statistics for 21 penguin genomes
Species Library construction strategy Sequencing platform Raw data (Gb) Clean data (Gb)
Eudyptes chrysolophus chrysolophus 10X BGIseq500 145.9 126.9
Megadyptes antipodes antipodes 10X BGIseq500 111.9 104.1
Spheniscus demersus 10X BGIseq500 141.1 131.3
Spheniscus mendiculus 10X BGIseq500 112.2 104.4
Eudyptula minor albosignata 10X BGIseq500 132.5 124.8
Eudyptula minor minor 10X BGIseq500 121.4 112.7
Eudyptula novaehollandiae 10X BGIseq500 180.4 168.5
Pygoscelis papua 10X BGIseq500 134.5 124.0
Pygoscelis antarctica 10X BGIseq500 154.5 139.7
Aptenodytes patagonicus 10X BGIseq500 147.6 134.0
Downloaded from https://academic.oup.com/gigascience/article/8/9/giz117/5571031 by guest on 04 August 2021
Eudyptes chrysolophus schlegeli 250 bp, 2 kb, 5 kb, 10 kb BGIseq500 402.6 296.6
Eudyptes pachyrhynchus 250 bp, 2 kb, 5 kb, 10 kb HiSeq X ten and HiSeq 4000 146.4 104.7
Eudyptes robustus 250 bp, 2 kb HiSeq X ten and HiSeq 4000 171.2 107.6
Eudyptes sclateri 250 bp, 2 kb, 5 kb HiSeq X ten and HiSeq 4000 156.2 103.2
Eudyptes filholi 250 bp, 2 kb, 5 kb, 10 kb HiSeq X ten and HiSeq 4000 195.0 146.8
Eudyptes chrysocome 250 bp, 2 kb, 5 kb HiSeq X ten and HiSeq 4000 195.1 111.6
Eudyptes moseleyi 250 bp, 2 kb, 5 kb, 10 kb HiSeq X ten and HiSeq 4000 173.6 133.1
Spheniscus magellanicus 250 bp, 2 kb, 5 kb, 10 kb HiSeq X ten and HiSeq 4000 212.6 150.7
Spheniscus humboldti 250 bp, 2 kb, 5 kb, 10 kb HiSeq X ten and HiSeq 4000 208.8 137.2
HiSeq X ten was used for sequencing small insert size libraries; HiSeq 4000 was used for sequencing mate-pair libraries.
Table 3: Assembly statistics and BUSCO results for 21 penguin genomes within a total of 4,915 conserved avian orthologs
Library
construction Contig Scaffold Genome
strategy Species N50 (bp) N50 (bp) size (bp) Complete Duplication Fragmented Missing
10x Eudyptes chrysolophus 163,848 13,794,837 1,368,663,695 85.40% 7.70% 4.40% 2.50%
chrysolophus
Megadyptes antipodes 83,954 23,315,117 1,317,732,923 91.80% 1.20% 4.20% 2.80%
antipodes
Spheniscus demersus 101,408 15,386,364 1,278,371,924 91.30% 0.90% 4.70% 3.10%
Spheniscus mendiculus 72,552 380,950 1,300,348,609 88.90% 1.60% 5.70% 3.80%
Eudyptula minor 95,773 21,866,543 1,374,338,381 85.60% 7.40% 4.20% 2.80%
albosignata
Eudyptula minor minor 88,190 21,127,646 1,466,686,831 84.00% 8.60% 4.60% 2.80%
Eudyptula novaehollandiae 122,461 29,280,209 1,357,427,560 89.00% 4.70% 3.80% 2.50%
Pygoscelis papua 93,785 2,780,837 1,309,329,553 90.70% 1.50% 5.00% 2.80%
Pygoscelis antarctica 118,336 6,180,260 1,265,661,676 91.30% 1.20% 4.60% 2.90%
Aptenodytes patagonicus 116,769 2,903,810 1,256,739,118 91.50% 1.10% 4.20% 3.20%
Multi-libraries Eudyptes chrysolophus 24,191 1,877,548 1,310,605,488 93.20% 1.50% 3.30% 2.00%
schlegeli
Eudyptes pachyrhynchus 33,319 8,795,033 1,310,923,788 80.20% 7.70% 4.30% 7.80%
Eudyptes robustus 29,712 363,310 1,248,618,553 87.30% 1.10% 5.10% 6.50%
Eudyptes sclateri 69,562 1,921,244 1,211,737,899 93.60% 1.10% 3.20% 2.10%
Eudyptes filholi 74,280 6,429,221 1,223,976,468 93.20% 1.00% 3.60% 2.20%
Eudyptes chrysocome 66,005 1,949,323 1,231,067,970 93.80% 1.00% 3.00% 2.20%
Eudyptes moseleyi 21,362 2,248,088 1,306,699,575 93.60% 1.20% 3.00% 2.20%
Spheniscus magellanicus 41,455 12,679,469 1,262,636,738 93.10% 1.30% 3.50% 2.10%
Spheniscus humboldti 19,849 6,229,819 1,243,403,142 93.30% 1.10% 3.50% 2.10%
Pygoscelis adeliae 22,195 5,118,896 1,216,600,033 92.80% 0.60% 4.00% 2.60%
Aptenodytes forsteri 31,730 5,071,598 1,254,347,440 93.20% 0.80% 3.60% 2.40%
Genome assembly and quality evaluation timated as the read number ∗ (read length – 17 + 1)/K dep. The
Sequences obtained from the 250-bp insert size libraries and the filtered reads for the 10x libraries were only used for estimat-
10x libraries were used to evaluate the genome size for each ing the genome size with 17 k-mer, while all reads were used for
penguin using a k-mer approach [79]. Reads were scanned us- Supernova assembly.
ing a 17-bp window with 1 bp sliding and the frequency of each Sequencing errors have a major effect on subsequent
17 k-mer was recorded. After all the reads were scanned, the k- genome assembly because they both introduce mistakes in
mer frequency distributions were plotted and the depth with the the assembly and also decrease the assembly continuities.
highest frequency (K dep) was defined. The genome size was es- Several features can be linked to sequencing noise, includingPan et al. 7
Downloaded from https://academic.oup.com/gigascience/article/8/9/giz117/5571031 by guest on 04 August 2021
Figure 2: Genome assembly statistics of all penguin species. A, Dot plot of the quality of each index showing contig N50 (maximum is Eudyptes chrysolophus chrysolophus
with 163,848 bp; minimum is Spheniscus humboldti with 19,849 bp) and scaffold N50 (maximum is Eudyptula novaehollandiae with 29,280,209 bp; minimum is Eudyptes
robustus with 363,310 bp). Each symbol indicates a penguin species, the x-axis indicates the scaffold N50, and the y-axis indicates the contig N50 for each species. B,
Genome size for each penguin species (maximum is Eudyptula minor with 1,466,686,831 bp; minimum is Eudyptes sclateri with 1,211,737,899 bp). C, BUSCO assessments
of all penguin genomes, showing the percentage of complete, duplicated, fragmented, or missing data. See Table 3 for more details. The symbols for each penguin
species correspond to the symbols used in Fig. 1. and Fig. 3.
low-quality bases, adaptor contamination, and duplication [80]. bly, we used GapCloser v. 1.12 (GapCloser, RRID:SCR 015026) [81]
To remove the potential biases introduced by sequencing noise, to locally assemble and close gaps within each scaffold following
we filtered our raw sequencing reads prior to genome assem- the default parameters.
bly, following strict standards including (i) discarding paired-end All penguins (including those obtained in Li et al. [51]) were
reads containing overlaps, (ii) removing reads with >20% low- estimated to have a ∼1.3-Gb genome (Fig. 2), containing little
quality bases as the quality score was 5% ambiguous N bases, (iv) removing paired-end reads contig N50 than the Aptenodytes forsteri and Pygoscelis adeliae as-
containing identical sequences likely to be PCR duplicates, and semblies obtained by Li et al. [51] (Fig. 2). In total, the 21 genomes
(v) removing reads with adaptor sequences. Following filtering, contained a scaffold N50 >1 Mb, and of those, 13 genomes con-
each genome contained >104 Gb data. Overall, we obtained a tained a scaffold N50 >3 Mb. All penguin genomes contain a con-
total of 2.56 Tb high-quality data for all 19 penguin genomes tig N50 >19 kb and 15 of the genomes are >30 kb. The maximum
(Table 2). contig N50 extends to 163 kb for the macaroni penguin (Eudyptes
Both SOAPdenovo v. 2–2.04 (SOAPdenovo2, RRID:SCR 014986) chrysolophus chrysolophus ) (Fig. 2). The highest-quality genome is
[81] and Allpaths-LG (ALLPATHS-LG, RRID:SCR 010742) [82] were Eudyptula novaehollandiae , encompassing a 29.3-Mb scaffold N50.
used to assemble the genomic libraries from the various insert Therefore, our results demonstrate consistency and high quality
sizes. For SOAPdenovo, paired-end reads from small insert size among all 21 penguin genomes (Fig. 2).
libraries were used to construct de Bruijn graphs, with various The genome assembly completeness provides an evalua-
k-mer ranging from 23 to 47. Contigs were subsequently con- tion of the assembly quality. We used BUSCO v. 3.0.2 (BUSCO,
structed using contig modular with the “-D 1 -g” parameter to RRID:SCR 015008) [84] to evaluate our newly assembled pen-
remove edges containing coverages no larger than 1. Following guin genomes with the avian database aves odb9, which encom-
this, “map -k 35 -g” was used to map mate-pair reads into con- passes 4,915 conserved avian orthologs (Table 3). Only ∼3% of
tigs, with k-mer size 35. Finally, we conducted scaffolding with the core genes in aves odb9 could not be annotated on the 21
parameters “scaff -g -F” to assemble the contigs into longer link- penguin genomes (ranging between 2% and 7.8%). This demon-
ages. The best version, in terms of various k-mer in the graph strates that all 21 penguin genomes are near-complete, contain-
construction step, was chosen as the SOAPdenovo representa- ing only a few gaps. We identified an average of 90% complete
tive for each species. In addition, we also assembled genomic core genes on each of the 21 penguin genomes, with the rich-
libraries from various insert sizes using Allpaths-LG following est being 93.8% on Eudyptes chrysocome. Furthermore, when sev-
the default parameters. By comparing the assemblies from both eral genes were annotated in >1 copy, we considered them to be
SOAPdenovo and Allpaths-LG, according to both the scaffold N50 duplications. Duplication rates among the 21 penguin genomes
and the total length, we chose the best assembler as a represen- varied only between 0.6% and 8.6%. In addition, only ∼4% of
tative for each of the 19 penguin species. Supernova v. 2.0 [83], the core genes were partly annotated on each of the 21 pen-
recommended for 10x genomic data [83], was used to assemble guin genomes (Fig. 2). Overall, we obtained almost-complete,
those species with 10x genomic libraries, following the default high-quality genomes. Our genomic dataset (including those ob-
parameters. The optimal assembly strategy chosen for each pen- tained in Li et al. [51]) encompasses all extant penguin species,
guin species is listed in Supplementary Table 2. For each assem- representing a comprehensive dataset.8 High-coverage genomes to elucidate the evolution of penguins
Repeat annotation e-value cut-off. Multiple adjacent hits from the same protein
We used RepeatMasker v. 4.0.7 (RepeatMasker, RRID:SCR 012954) were then linked together using genBlastA v. 1.0.4 [93] to obtain
[85, 86], TRF v. 4.09 [87], and RepeatModeler v. 1.0.8 (RepeatMod- the candidate gene boundary. A candidate hit was removed if a
eler, RRID:SCR 015027) [88, 86] to identify repetitive sequences in protein had 2 adjacent gene model were extracted from each genome according to the
copies, were identified with TRF using the default parameters. annotated gene model, and then each coding sequence was
Downloaded from https://academic.oup.com/gigascience/article/8/9/giz117/5571031 by guest on 04 August 2021
In addition, we used RepeatModeler in a de novo repeat family translated into the protein sequence. This annotated protein se-
identifying approach. All identified repeat elements were clas- quence was then aligned with the corresponding homolog pro-
sified into 7 categories (DNA, long interspersed nuclear element tein sequence using MUSCLE v. 3.8.31 (MUSCLE, RRID:SCR 01181
[LINE], short interspersed nuclear element [SINE], long terminal 2) [95], while removing annotated proteins with
gallus, we compared the 2 proteins in each ortholog and chose transcriptome.
the longer homologous sequence with the human ortholog pro- After applying the above methods, we annotated the 19
tein sequence in the reference gene set. Within 12,337 orthologs, newly assembled penguin genomes, as well as the 2 previously
6,888 from Taeniopygia guttata and 5,449 from Gallus gallus were published penguin genomes [51]. We identified ∼16,000 genes on
selected as the reference gene set. Following this, specific genes each penguin genome, which is similar to the genomes of Tae-
of Taeniopygia guttata or Gallus gallus were added to the ref- niopygia guttata and Gallus gallus. The average gene length and
erence gene set. This reference gene set comprised 5,084 Tae- coding sequence length are ∼19 and 1.3 kb, respectively. Each
niopygia guttata genes without Gallus gallus orthologs and 3,158 gene encompasses ∼8 exons, with an average length of 170 bp.
G. gallus genes that had not been identified as ortholog genes Intron lengths are an average length of 2.6 kb (Table 5).
to Taeniopygia guttata. Finally, protein sequences were filtered
if they containedTable 4: Repeat annotation results for 21 penguins and 5 outgroups
DNA LINE SINE LTR Other Unknown TRF Total
Species Length % in Length % in Length % in Length % in Length % in Length % in Length % in Length % in
(bp) genome (bp) genome (bp) genome (bp) genome (bp) genome (bp) genome (bp) genome (bp) genome
Eudyptes chrysolophus 10,967,993 0.84 56,600,258 4.32 1,886,042 0.14 23,772,820 1.81 1,709 0.00013 7,181,843 0.55 27,041,073 2.06 122,778,314 9.37
schlegeli
Eudyptes chrysolophus 9,840,577 0.72 81,007,897 5.92 2,325,630 0.17 42,950,488 3.14 2,109 0.00015 6,349,669 0.46 7,624,752 0.56 147,221,283 10.80
chrysolophus
Eudyptes 9,700,549 0.74 57,537,411 4.39 1,761,671 0.13 26,951,871 2.06 7,163 0.00055 8,778,995 0.67 15,315,109 1.17 115,154,499 8.78
pachyrhynchus
Eudyptes robustus 10,035,161 0.80 54,876,908 4.40 1,694,896 0.14 21,900,240 1.75 1,197 0.000096 6,793,784 0.54 13,082,350 1.05 105,161,038 8.42
Eudyptes sclateri 9,603,106 0.79 57,388,336 4.74 1,648,534 0.14 22,555,283 1.86 2,155 0.00018 5,455,896 0.45 7,045,858 0.58 101,615,942 8.39
Eudyptes filholi 9,447,824 0.77 58,471,185 4.78 1,894,915 0.16 23,146,953 1.89 2,662 0.00022 8,146,713 0.67 7,812,634 0.64 104,766,914 8.56
Eudyptes chrysocome 9,067,962 0.74 58,040,264 4.71 1,608,644 0.13 22,515,809 1.83 2,095 0.00017 7,321,722 0.60 7,332,611 0.60 103,276,447 8.39
Eudyptes moseleyi 9,367,954 0.72 58,805,425 4.50 1,990,469 0.15 23,593,767 1.81 2,664 0.00020 9,786,633 0.75 45,959,293 3.52 141,103,330 10.80
Megadyptes antipodes 9,608,349 0.73 78,978,618 5.99 1,728,524 0.13 46,464,418 3.53 1,059 0.000080 8,168,785 0.62 7,802,048 0.59 148,977,693 11.30
antipodes
Spheniscus 10,393,349 0.82 65,351,067 5.18 1,812,355 0.14 26,759,543 2.12 1,546 0.00012 9,851,237 0.78 10,398,934 0.82 118,099,179 9.35
magellanicus
Spheniscus demersus 9,811,467 0.77 72,969,293 5.71 1,610,171 0.13 34,709,683 2.72 1,509 0.00012 20,385,557 1.59 6,712,698 0.53 130,219,709 10.2
Spheniscus mendiculus 10,792,037 0.83 80,340,773 6.18 1,694,428 0.13 43,906,026 3.38 2,265 0.00017 13,023,335 1.00 7,421,979 0.57 147,721,431 11.4
Spheniscus humboldti 9,850,523 0.80 63,427,971 5.10 2,095,439 0.17 26,032,187 2.09 2,610 0.00021 7,051,364 0.57 10,846,563 0.87 115,794,679 9.31
Eudyptula minor 10,287,254 0.75 86,732,446 6.31 2,230,442 0.16 49,548,759 3.61 2,285 0.00017 10,370,641 0.76 8,661,285 0.63 160,541,239 11.70
albosignata
Eudyptula minor minor 10,691,141 0.73 95,293,482 6.50 1,790,448 0.12 62,515,534 4.26 2,245 0.00015 8,460,299 0.58 9,083,782 0.62 183,740,284 12.5
Eudyptula 10,542,998 0.78 87,757,466 6.46 1,654,900 0.12 53,144,657 3.92 1,522 0.00011 12,914,720 0.95 8,531,830 0.63 164,989,801 12.20
novaehollandiae
Pygoscelis adeliae 8,905,965 0.73 52,089,816 4.28 1,643,684 0.14 17,580,686 1.45 1,685 0.00014 6,938,950 0.57 8,565,483 0.70 93,839,128 7.71
Pygoscelis papua 10,878,036 0.83 79,578,503 6.08 1,683,574 0.13 47,004,788 3.59 2,163 0.00017 8,393,877 0.64 7,857,958 0.60 151,240,877 11.60
Pygoscelis antarctica 10,021,109 0.79 75,467,782 5.96 1,660,023 0.13 36,515,988 2.89 1,645 0.00013 5,649,521 0.45 6,850,733 0.54 133,620,728 10.60
Aptenodytes 9,883,830 0.79 72,143,844 5.74 1,669,248 0.13 33,210,718 2.64 2,273 0.00018 5,987,857 0.48 6,868,165 0.55 126,913,554 10.10
patagonicus
Aptenodytes forsteri 9,648,988 0.77 47,421,228 3.78 1,755,252 0.14 14,998,979 1.20 1,055 0.000084 5,984,114 0.48 28,075,518 2.24 103,411,467 8.24
Hydrobates tethys 10,174,835 0.85 43,642,750 3.65 1,593,248 0.13 13,363,132 1.12 1,780 0.00015 6,044,078 0.51 10,375,034 0.87 82,871,365 6.93
Oceanites oceanicus 8,172,757 0.69 53,982,174 4.58 1,518,213 0.13 19,561,601 1.66 2,202 0.00019 6,101,243 0.52 10,501,141 0.89 97,111,623 8.24
Thalassarche 10,390,449 0.93 41,856,139 3.74 1,766,094 0.16 14,374,696 1.29 2,035 0.00018 5,822,959 0.52 6,943,803 0.62 79,491,403 7.11
chlororhynchos
Taeniopygia guttata 5,985,051 0.49 51,144,902 4.15 883,324 0.072 50,817,604 4.12 4,713 0.00038 13,099,829 1.06 25,800,776 2.09 137,289,217 11.10
Gallus gallus 13,929,789 1.33 78,779,279 7.52 571,067 0.055 21,043,114 2.01 1,638 0.00016 20,514,532 1.96 10,603,861 1.01 129,394,288 12.40
Pan et al.
9
Downloaded from https://academic.oup.com/gigascience/article/8/9/giz117/5571031 by guest on 04 August 202110 High-coverage genomes to elucidate the evolution of penguins
Table 5: Protein-coding gene statistics of all 21 penguin genomes and 5 outgroups
Number of
protein-coding Mean gene Mean coding Mean exons Mean exon Mean intron
Species genes length (bp) sequence length (bp) per gene length (bp) length (bp)
Eudyptes chrysolophus schlegeli 17,191 18,860 1,351 7.9 171 2,540
Eudyptes chrysolophus 16,311 20,248 1,392 8.2 170 2,623
chrysolophus
Eudyptes pachyrhynchus 19,170 17,394 1,306 7.4 178 2,535
Eudyptes robustus 17,126 16,254 1,295 7.4 174 2,329
Eudyptes sclateri 15,786 19,627 1,402 8.2 171 2,527
Eudyptes filholi 15,963 19,959 1,407 8.2 171 2,562
Eudyptes chrysocome 16,280 19,436 1,382 8.1 171 2,555
Downloaded from https://academic.oup.com/gigascience/article/8/9/giz117/5571031 by guest on 04 August 2021
Eudyptes moseleyi 16,812 19,767 1,370 8.0 171 2,621
Megadyptes antipodes 16,563 18,509 1,334 7.8 171 2,533
antipodes
Spheniscus magellanicus 16,795 19,311 1,381 8.1 171 2,535
Spheniscus demersus 16,134 19,029 1,344 7.8 171 2,584
Spheniscus mendiculus 16,390 17,097 1,311 7.6 172 2,382
Spheniscus humboldti 16,587 19,642 1,387 8.1 170 2,558
Eudyptula minor albosignata 17,424 18,837 1,338 7.8 172 2,574
Eudyptula minor minor 17,802 19,078 1,349 7.8 172 2,598
Eudyptula novaehollandiae 17,188 19,271 1,355 7.9 172 2,609
Pygoscelis adeliae 14,463 20,595 1,385 8.3 168 2,648
Pygoscelis papua 16,698 18,276 1,333 7.8 172 2,503
Pygoscelis antarctica 15,488 19,520 1,381 8.1 171 2,558
Aptenodytes patagonicus 15,195 19,596 1,384 8.1 170 2,552
Aptenodytes forsteri 15,593 19,844 1,381 8.1 170 2,584
Hydrobates tethys 15,915 17,898 1,344 8.1 165 2,323
Oceanites oceanicus 16,055 17,936 1,356 8.0 170 2,377
Thalassarche chlororhynchos 13,347 10,029 1,110 6.4 175 1,667
Taeniopygia guttata 19,174 14,787 1,196 7.2 167 2,198
Gallus gallus 17,883 16,965 1,414 8.3 171 2,135
terns to obtain the motifs and domains for each gene. Gene using trimAl, using the parameter “backtrans” to obtain a back-
Ontology [102] terms for each gene were obtained from the cor- translation for a given amino acid alignment. Alignment filter-
responding InterPro entry. To identify the pathways in which the ing was applied to (i) the column-based alignments, by remov-
gene might be involved, protein sequences for each gene were ing all missing data, and retaining alignment lengths >50 bp (re-
then aligned against the KEGG database using BLASTP. For each sulting in 7,229 orthologs, the “TrimAl data” set); and (ii) apply-
penguin genome, a total of >99% of the protein-coding genes ing a full-matrix occupancy to the no missing dataset (retaining
were assigned ≥1 function annotation in each penguin, which 7,011 orthologs, the “No missing data” set) following the pipeline
is similar to the 5 outgroups (Table 6). Overall, >95% of the pro- published previously [108]. Loci containing no missing taxa were
tein genes were assigned a Swiss-Prot function, demonstrating then retained, by removing alignment columns containing gaps,
high-quality gene sets. undetermined bases (Ns), or ambiguity characters and loci with
a post-filtering alignment lengthPan et al. 11
Table 6: Function annotation results for protein-coding genes for 21 penguins and 5 outgroups
Swissprot KEGG Interpro Overall
Species
Number % Number % Number % Number %
Eudyptes chrysolophus schlegeli 16,739 97.37 15,347 89.27 16,916 98.40 17,064 99.26
Eudyptes chrysolophus chrysolophus 15,863 97.25 14,646 89.79 16,051 98.41 16,191 99.26
Eudyptes pachyrhynchus 18,680 97.44 17,250 89.98 18,873 98.45 19,028 99.26
Eudyptes robustus 16,580 96.81 15,500 90.51 16,816 98.19 16,988 99.19
Eudyptes sclateri 15,383 97.45 14,172 89.78 15,540 98.44 15,664 99.23
Eudyptes filholi 15,555 97.44 14,362 89.97 15,696 98.33 15,840 99.23
Eudyptes chrysocome 15,692 96.39 14,732 90.49 15,977 98.14 16,148 99.19
Eudyptes moseleyi 16,377 97.41 15,153 90.13 16,540 98.38 16,688 99.26
Downloaded from https://academic.oup.com/gigascience/article/8/9/giz117/5571031 by guest on 04 August 2021
Megadyptes antipodes antipodes 15,755 95.12 14,993 90.52 16,264 98.19 16,445 99.29
Spheniscus magellanicus 16,371 97.48 15,136 90.12 16,532 98.43 16,670 99.26
Spheniscus demersus 15,388 95.38 14,579 90.36 15,839 98.17 16,001 99.18
Spheniscus mendiculus 15,714 95.88 14,801 90.31 16,090 98.17 16,254 99.17
Spheniscus humboldti 16,172 97.50 14,954 90.15 16,319 98.38 16,460 99.23
Eudyptula minor albosignata 16,615 95.36 15,778 90.55 17,098 98.13 17,297 99.27
Eudyptula minor minor 16,994 95.46 16,073 90.29 17,476 98.17 17,663 99.22
Eudyptula novaehollandiae 16,423 95.55 15,561 90.53 16,892 98.28 17,060 99.26
Pygoscelis adeliae 13,964 96.55 13,054 90.26 14,220 98.32 14,348 99.20
Pygoscelis papua 15,931 95.41 15,097 90.41 16,378 98.08 16,553 99.13
Pygoscelis antarctica 15,050 97.17 13,853 89.44 15,224 98.30 15,360 99.17
Aptenodytes patagonicus 14,808 97.45 13,493 88.80 14,954 98.41 15,063 99.13
Aptenodytes forsteri 15,053 96.54 14,112 90.50 15,308 98.17 15,478 99.26
Hydrobates tethys 15,493 97.35 14,273 89.68 15,628 98.20 15,775 99.12
Oceanites oceanicus 15,622 97.30 14,412 89.77 15,775 98.26 15,919 99.15
Thalassarche chlororhynchos 12,958 97.09 11,881 89.02 13,072 97.94 13,219 99.04
Taeniopygia guttata 18,367 95.79 17,115 89.26 18,537 96.68 18,918 98.66
Gallus gallus 16,760 93.72 15,585 87.15 17,079 95.50 17,263 96.53
ogy, we kept the highest-scoring tree as the final tree for further compassing all extant penguin genomes is slightly different to
analysis. Branch lengths were re-estimated in coalescent units a recent phylogenetic study using mitochondrial genomes [3].
of substitutions per site by constraining alignments to the MP- Specifically, while the mitochondrial phylogeny suggested that
EST tree topology using the “-f E” option in ExaML v.3.0.21 [103]. Aptenodytes + Pygoscelis are sister to all other penguins, our full
Bootstrap values were plotted using RAxML based on the boot- genome phylogeny suggests that Aptenodytes alone is sister to
strap replicates, and trees were outgroup-rooted with G. gallus. all other penguins. This result confirms earlier results combin-
In addition, we used the coalescent-based method ASTRAL-III ing data from a small set of mitochondrial genes and the nuclear
[105] with default parameters to obtain the tree with the max- RAG-1gene [1, 62] and provides intriguing new evidence on the
imum number of shared induced quartet trees in the set of historical biogeographical and evolutionary patterns of adapta-
unrooted gene trees, constrained by the set of bipartitions in tion to Antarctica. We expect this novel genomic dataset to pro-
the tree based on a predefined set of partitions. The inferenced vide further important insights into the evolution of penguins in
trees also shared the same tree topology with the MP-EST re- the southern hemisphere.
sults. Then, the concatenation-based phylogenomic inference
was conducted using ExaML v3.0.21. This was achieved using a
GTR+GAMMA substitution model on the partitioned (each locus Re-use Potential
as a separate partition), concatenated alignments, and inferring
Consortium organization and further research plans
the topology from 21 full maximum likelihood tree searchers:
20 beginning with random starting trees, and a single search The 19 high-coverage genomes presented here, along with the
beginning with the random stepwise addition order parsimony Aptenodytes forsteri and Pygoscelis adeliae genomes presented
tree conducted using RAxML. For each dataset, 100 ExaML boot- by members of our consortium in 2014 [51], provide an excit-
strap replicates were conducted and convergence was assessed ing resource for understanding evolutionary diversification, the
according to the bootstrapping analysis and applying a majority- molecular basis for unique functional adaptation, and demo-
rule consensus tree criterion in RAxML with option “-I autoMRE”. graphic histories of penguins. The Penguin Genome Consortium
We then compared the resulting trees obtained using the “Tri- is an international team of scientists with backgrounds in ma-
mAl data” and the “No missing data” from coalescent-based MP- rine ornithology, ecology, molecular biology, evolutionary and
EST and ASTRAL with concatenation-based ExaML (Supplemen- comparative genomics, phylogenetics, physiology, palaeontol-
tary Fig. 1). ogy, veterinary science, and bioinformatics. The diverse skills
While the resulting topologies of the outgroups Hydrobates encompassed within our highly collaborative consortium will be
tethys, Oceanites oceanicus, and Thalassarche chlororhynchos are essential to study these genomes under comparative genomic
slightly different between coalescent-based and concatenation- and evolutionary frameworks. In doing so, we will expand on
based methods, the topologies of our penguin genomes are iden- [51] by investigating 3 key areas related to penguin evolution and
tical using both methods (Fig. 3). Our final phylogeny (Fig. 3) en- adaptation.12 High-coverage genomes to elucidate the evolution of penguins
Downloaded from https://academic.oup.com/gigascience/article/8/9/giz117/5571031 by guest on 04 August 2021
Figure 3: Phylogenomic reconstruction of penguins inferred by the ExaML method with no missing data. The topology of all clades was strongly supported (bootstrap
support: 100). The topology and support were identical using the MP-EST and ASTRAL methods (with no missing data) except for the outgroup (bootstrap support for
the split between Hydrobates tethys and Oceanites oceanicus: 37) and within the penguin genus Spheniscus (bootstrap support for the split between the African penguin
[Spheniscus demersus] and the magellanic penguin [S. magellanicus]: 97).
Evolutionary relationships and taxonomic boundaries servation management of penguins and other Southern Ocean
With a deep evolutionary history, and diverse radiation, pen- assemblages.
guins provide an exciting system to understand the evolution-
ary drivers of diversification [3]. Moreover, robust taxonomic
frameworks can be crucial for directing limited conservation Cultural significance
resources for maximum gains. Significant uncertainty remains
The context in which wildlife research in New Zealand is under-
regarding species/lineage boundaries between some closely re-
taken is evolving rapidly and heading into new legal and novel
lated penguin taxa. The genomes generated here therefore pro-
cultural contexts [111–114]. Recent initiatives such as the be-
vide an exciting new dataset to examine taxonomic, phyloge-
stowing of the rights of an individual on Te Urewera, a former
nomic, and biogeographical patterns for understanding penguin
national park, set an international precedent for this change in
evolution.
approach [115]. Therefore, it is critical that research permissions
be obtained and appropriate indigenous consultation with Iwi,
Comparative genomics and adaptation Rūnanga, Whānau, and Hapū be conducted. The regulatory arm
Penguins provide an excellent system to study comparative of the New Zealand government in this process, the Department
evolutionary adaptation [51]. We will use our genomes to ex- of Conservation, is legally required to give effect to the Principles
plore comparative evolution among penguins, and between pen- of the Treaty of Waitangi [116] in its administration of the legis-
guins and other avian orders. By examining loci under pos- lation pursuant to which Authorities are issues.
itive selection, we shall reveal the molecular basis for the At another level the Ngāi Tahu Deed of Settlement Act recog-
unique physiological and morphological adaptations to dif- nizes all native penguin species as Taonga, or treasured posses-
ferent environments and ecologies that are exhibited by sions [117]. Consequently, not only is it a legal requirement to
penguins. undertake rigorous Māori consultation when studying Taonga
[118, 119], the Department of Conservation has to have par-
Penguins in a changing world ticular regard to the views of Iwi, Rūnanga, Whānau, or Hapū
Penguins are sensitive indicators of environmental change [44, when considering whether to authorize any application. Re-
45]. It is predicted that future climate change will lead to signif- cent discussions have also emphasized that Taonga genomes
icant declines in many penguin populations [47–50]. Conserva- are sacred (tapu) because they are considered to contain both
tion management decisions can be guided by demographic as- the living and the future generations (whakapapa, mauri, and
sessments. However, there remains a substantial gap in predict- wairua of tipuna), engendering Māori concerns surrounding
ing ecosystem-wide changes to future climate change. As such, the commercialization, ownership, storage, and modification
demographic analyses of these genomes will be critical for con- of Taonga genomes [120]. We generated Taonga genomes en-Pan et al. 13
compassing hoiho (yellow-eyed penguin, Megadyptes antipodes minimizing sequencing costs, and laboratory and analytical ef-
antipodes), kororā (little penguin, Eudyptula spp.), pokotiwha forts.
(Snares-crested penguin, E. robustus), tawaki (Fiordland-crested In this study we have presented 19 new high-coverage pen-
penguin, E. pachyrhynchus), and erect-crested penguin (Eudyptes guin genomes. Together with 2 genomes previously obtained
sclateri). These genomes were obtained following rigorous De- by members of our consortium [51], this combined dataset en-
partment of Conservation permitting procedures (including col- compasses the genomes of all extant penguin species. We have
lection, holding, and exporting permits) and following Depart- also constructed a comprehensive phylogenomic tree encom-
ment of Conservation Iwi, Rūnanga, Whānau, or Hapū consul- passing all extant penguins. We will use these datasets to ad-
tation (Supplementary Table 1). Several of the Taonga genomes dress a range of evolutionary, adaptive, biogeographic, and de-
studied here were collected alongside broader research projects, mographic questions regarding penguins. As such, we hope not
and additional consultation efforts were undertaken for those only that our ongoing projects that encompass these genomes
projects. We emphasize that there will be no commercialization, will provide novel insights for understanding the broad evolu-
ownership, or modification of any of the genomes presented tion and adaptation of avifauna to different environments but
Downloaded from https://academic.oup.com/gigascience/article/8/9/giz117/5571031 by guest on 04 August 2021
here. While these Taonga genomes will be publicly available, it also that this knowledge will increase cultural heritage and
is critical that new researchers studying these genomes take the aid conservation management decisions for remote Southern
appropriate steps to seek additional Māori permissions and con- Ocean regions.
sultation, which will ensure respect of New Zealand cultural val-
ues.
The emerging issues surrounding the generation and use of Availability of supporting data and materials
Taonga genomes also highlight that Māori consultation should The genome sequencing data and assemblies of this study have
also be undertaken when obtaining genomes from Taonga been deposited in the CNSA (https://db.cngb.org/cnsa/) of the
housed in overseas museum collections. We hope that the data CNGBdb database with the accession number CNP0000605, as
and our research questions presented here, and our future re- well as the NCBI database with the Bioproject ID PRJNA556735
search outputs using these genomes will be valuable for both (Aptenodytes patagonicus: SAMN12384866; Eudyptes chrysolophus
cultural heritage and for conservation management of penguin chrysolophus: SAMN12384869; E. c. schlegeli: SAMN12384870; E.
populations. chrysocome: SAMN12384872; E. filholi: SAMN12384873; E. moseleyi:
SAMN12384871; E. pachyrhynchus: SAMN12384875; Eudyptes ro-
bustus: SAMN12384876; E. sclateri: SAMN12384874; Eudyptula mi-
Early-release use of the data
nor albosignata: SAMN12384880; E. m. minor: SAMN12384879; E.
The Fort Lauderdale [121] and Toronto [122] agreements state novaehollandiae: SAMN12384878; Megadyptes antipodes antipodes:
that in exchange for early release of datasets, the data produc- SAMN12384877; Pygoscelis antarctica: SAMN12384868; P. papua:
ers retain the right to be the first to describe and analyse the SAMN12384867; Spheniscus demersus: SAMN12384881; S. hum-
complete datasets in peer-reviewed publications. Comparative boldti: SAMN12384883; S. magellanicus: SAMN12384882; S. men-
and evolutionary genomic analyses are currently being carried diculus: SAMN12384884. Data from all of the penguin species are
out, and the consortium welcomes new members interested in also available from the GigaScience GigaDB database [127].
contributing to this work. While this work is still underway we
have published these 19 penguin genomes to provide early ac-
cess, while requesting researchers intending to use these data
Additional files
for similar cross-species comparisons to continue to follow the Supplementary Figure 1: Phylogenomic trees.
long-running Fort Lauderdale and Toronto rules. Supplementary Table 1: Sampling and permitting details of all
penguin samples tested.
Supplementary Table 2: Assemblers and Kmer sizes used for
Conclusions each penguin.
Supplementary Table 3: Information of 71 avian transcriptomic
Genomics is prohibitively costly—it requires high-quality sam-
samples downloaded from NCBI.
ples and extensive laboratory and bioinformatic skills. The ge-
nomics era has been boosted by global research consortiums,
which bring together contextual, technical, and analytical skills Abbreviations
spanning a network of international collaborations [123–126].
Our consortium and dataset introduced here are no exception, BLAST: Basic Local Alignment Search Tool; bp: base pairs;
and as such, we expect our future research using these genomes BUSCO: Benchmarking Universal Single-Copy Orthologs; CNSA:
to bring together additional collaborators that encompass a wide CNGB Nucleotide Sequence Archive; ExaML: Exascale Maximum
range of expertise regarding penguin biology and physiology. At Likelihood; Gb: gigabase pairs; kb: kilobase pairs; KEGG: Kyoto
another level, collecting high-quality fresh blood samples from Encyclopedia of Genes and Genomes; LINE: long interspersed
some of the most remote regions in the Southern Ocean re- nuclear element; LTR: long terminal repeat; Mb: megabase
mains technically and logistically difficult, requiring the efforts pairs; NCBI: National Center for Biotechnology Information;
and long-term organization from many collaborations and ex- ORF: open reading frame; RAxML: Randomized Axelerated Maxi-
pedition programs. While this study is an exciting development mum Likelihood; SINE: short interspersed nuclear element; TRF:
for understanding the evolution of penguins, the global efforts Tandem Repeat Finder; UCSC: University of California Santa
involved in designing our study, obtaining samples, and devel- Cruz.
oping appropriate sequencing and bioinformatic pipelines have
been extensive. The dataset and project design introduced here
Ethics approval and consent to participate
highlight the need for transparent research projects and global
collaborations, which together maximize the use of samples, All samples were obtained under valid animal ethics permits.You can also read