High Inflation and Slowing Growth - Click to add text

Page created by Melanie Brooks
 
CONTINUE READING
High Inflation and Slowing Growth - Click to add text
High Inflation and
Slowing Growth
                                                Click to add text

Karen Dynan
April 12, 2022
Spring 2022 Global Economic Prospects Event

1750 Massachusetts Avenue, NW | Washington, DC 20036 | www.piie.com
Inflation has climbed sharply in most
economies
Consumer Prices
Percent change from 12 months earlier                                                       Therefore, many central banks are
8
                Eurozone
                US
                                                                                            or will be tightening policy, which will
6
                UK
                Japan
                                                                                            represent a downward force on
                                                                                            economic activity
4

2

0

-2
  2015       2016        2017        2018        2019        2020        2021        2022
Sources: US Bureau of Labor Statistics, Eurostat, UK Office for National Statistics, and
Japanese Statistics Bureau via Macrobond
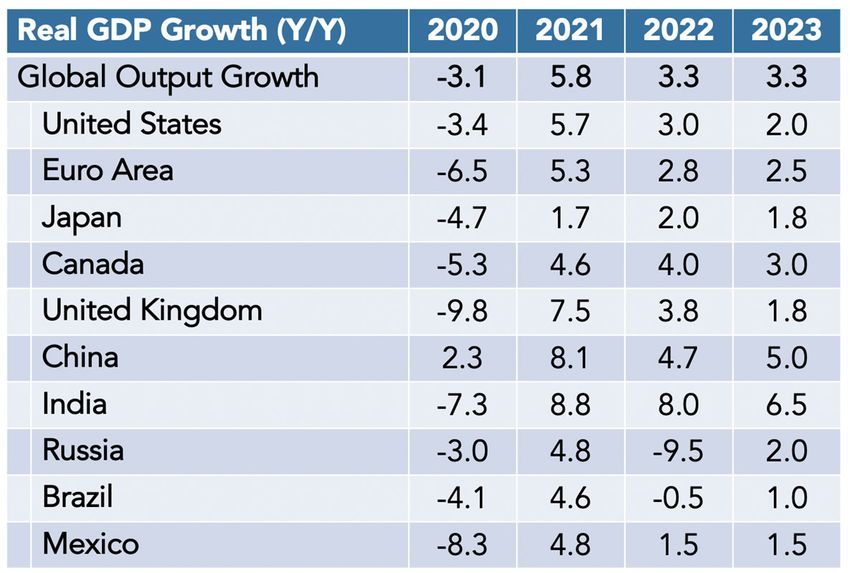
                                                                                                               Dynan Global Economic Prospects | 2
Global economic growth has stepped down
markedly
 Global Real GDP Growth
 Percent change from previous year

                                            5.8

                                                                                      Growth has already slowed on a
                                                              3.3              3.3
         2.8
                                                                                      quarterly basis in many countries

                          -3.1
        2019             2020              2021              2022              2023

Note: Purchasing power parity weights used to calculate global GDP
Sources: Consensus forecasts for 2019-2021; author’s forecasts for 2022-2023

                                                                                                      Dynan Global Economic Prospects | 3
Some common factors are bearing on the
outlook for most countries

• Underlying momentum in demand for goods and services
• Setbacks from episodes of resurging COVID
• Disruptions from war in Ukraine, including higher prices for energy, food, and
  other commodities
• Highest inflation in decades, necessitating rapid transition from monetary support
  to neutral policy or beyond

                                                                Dynan Global Economic Prospects | 4
Growth slows across all advanced economies
despite scope for further rebound in some

 Sources: Consensus forecasts for 2019-2021; author’s forecasts for 2022-2023.

                                                                                 Dynan Global Economic Prospects | 5
Growth in emerging economies is diverging
to a striking degree

                               Dynan Global Economic Prospects | 6
Summary of the outlook for large economies

     Source: Consensus forecasts for 2020-2021; author’s forecasts for 2022-2023. Annual-average-over-annual-average growth rates. PPP weights.

                                                                                                                      Dynan Global Economic Prospects | 7
The US GDP outlook is less robust than
expected last fall
US Real GDP
Chained 2012 Dollars (Trillions)
21                                                                                 Growth in GDP last year pushed the
                                   Fall 2021 Forecast                              economy further beyond its short-run
20
                                                           Revised Forecast        productive capacity than had been
                                                                                   anticipated
19

                                                       Q4/Q4 growth forecast:      Underlying demand remains strong
18
                                                       2022
                                                       2023
                                                                     2.1%
                                                                     2.1%
                                                                                   at this point, but it will need to be
                                                                                   restrained for inflation to moderate
17
     Q1 Q2 Q3 Q4 Q1 Q2 Q3 Q4 Q1 Q2 Q3 Q4 Q1 Q2 Q3 Q4 Q1 Q2 Q3 Q4
         2019             2020             2021             2022            2023

Source: US Bureau of Economic Analysis via FRED; author’s forecast

                                                                                                    Dynan Global Economic Prospects | 8
Demand is likely to be boosted by consumers
making up for lost ground in some categories
Average New Light Motor Vehicle Sales                                         Real PCE Healthcare Services
Millions (annual rate)                                                        Billions of chained (2020) dollars

20                                                                             3000
                       17.1
                                                                                                                                     pre-pandemic trend
16                                                             14.5
                                                                               2000
12

 8
                                                                               1000

 4

 0                                                                                 0
          three years prior to pandemic                since pandemic began            2017        2018          2019         2020          2021          2022

     Source: US Bureau of Economic Analysis via FRED                          Source: US Bureau of Economic Analysis

                                                                                                                        Dynan Global Economic Prospects | 9
Accumulated savings during the pandemic will
also boost demand across the distribution
Personal Saving Rate                                                          Aggregate Wealth by Income Percentile
Percent of disposable personal income                                         Trillions
35                                                                            70
                                                                                                                                                 + 24%
                                                                                            2019:Q4         2021:Q4
30                                                                            60

25                                                                            50
                                                                                                                                                                + 41%
20                                                                            40

15                                                                            30
                 2015-2019                                                                                                       + 33%
               average = 7.4%
10                                                                            20
                                                                                                      + 25%         + 24%
                                                                              10       + 21%
 5
                                                                               0
 0                                                                                     0-20th        20th-40th     40th-60th      60th-80th     80th-99th    top 1 percent
  2000 2002 2004 2006 2008 2010 2012 2014 2016 2018 2020 2022                         percentile     percentile    percentile     percentile    percentile

     Source: US Bureau of Economic Analysis via FRED; author's calculations        Source: Federal Reserve Distributional Financial Accounts; author's calculations

                                                                                                                            Dynan Global Economic Prospects | 10
The waning of fiscal stimulus represents a
drag on demand
 Contribution of Fiscal Policy to Real GDP Growth                               The normalization of fiscal policy
 Percentage points
  16                                                                            generates some drag
  12

   8                                                                            (But remember that the earlier
   4                                                                            increases in government spending
   0                                                                            and reductions in taxes is
   -4                                                                           what helped people build their
   -8                                                                           substantial cushion of savings and
        Q1 Q2 Q3 Q4 Q1 Q2 Q3 Q4 Q1 Q2 Q3 Q4 Q1 Q2 Q3 Q4 Q1 Q2 Q3 Q4
             2019             2020              2021             2022    2023
                                                                                also has contributed to many states
Note: Estimates do not include multipliers or monetary policy response          and localities being flush with cash)
Source: Brookings Hutchins Center

                                                                                              Dynan Global Economic Prospects | 11
Demand will also be restrained by the
removal of monetary accommodation
Median FOMC Projections for Federal Funds Rate              Interest Rate on Two-Year Treasury Note
Percent                                                     Percent
 4                                                        3.0
                                        Projections for
                                        year-end values
                                        as of:            2.5

 3
                                           March 2022
                                                          2.0

                                           Dec. 2021
 2                                                        1.5

                                           Sept. 2021
                                                          1.0

 1
                                                          0.5

 0                                                        0.0
            2022          2023   2024                        2019                  2020             2021             2022

Source: Federal Reserve
                                                          Source: Federal Reserve via FRED

                                                                                             Dynan Global Economic Prospects | 12
The pace of funds rate increases will depend on
the evolution of inflation
 PCE Inflation
 Percent change from 12 months earlier                                                 Overall inflation began to ramp up
12.5                                                                                   last March and has now surged to
10.0
           overall inflation
                                                                                       a level not seen since the early
 7.5
                                                                                       1980s
 5.0
                                  “trimmed mean”                                       Measures that exclude outsized
                                  inflation
 2.5                                                                                   changes remained subdued
 0.0                                                                                   through the end of last summer but
 -2.5
                                                                                       then began rising and have now
        1980               1990             2000              2010              2020
                                                                                       also hit levels not seen in decades
 Source: Federal Reserve Bank of Dallas and US Bureau of Economic Analysis via FRED

                                                                                                     Dynan Global Economic Prospects | 13
The path of inflation will depend primarily on
three factors

Slack—the extent to which demand is below (or above) potential supply

Supply shocks—for example, reductions in Russian oil exports and COVID-
related shutdowns in China

Expected future inflation and past inflation

                                                        Dynan Global Economic Prospects | 14
Rising labor supply will increase slack this
year
Labor Force Participation Rate                                  Foreign Born Population, Age 16-64
Percent of Population                                           Thousands
64                                                               42000

63                                                               40000
                                                                                                                       2010-2019 trend
62                                                               38000

61                                                               36000

60                                                               34000

59                                                               32000

58                                                               30000
     2019                  2020                   2021   2022         2010          2012        2014         2016        2018        2020         2022
                                                                Note: January changes incorporate annual adjustments to BLS population controls
 Source: US Bureau of Labor Statistics via FRED                 Source: US Bureau of Labor Statistics

                                                                                                        Dynan Global Economic Prospects | 15
But labor demand shows no sign of slowing
as yet
Nonfarm Payroll Employment                                         Job Openings per Unemployed Worker
Change (thousands)
800                                                                 2

700                  3-month
                     moving
                     average
600                                                                1.5

500

400                                                                 1

300

200                                                                0.5

100

  0                                                                 0
   Jan 2021             May 2021             Sep 2021   Jan 2022     2001        2004         2007        2010        2013        2016        2019        2022
                                                                   Note: Job openings for March 2022 are estimated based on Indeed Hiring Lab job postings.
 Source: US Bureau of Labor Statistics via FRED                    Sources: US Bureau of Labor Statistics via Macrobond; Indeed Hiring Lab; author's calculations

                                                                                                              Dynan Global Economic Prospects | 16
Some supply shocks may be abating, but
new ones are arising
Global Supply Chain Pressure Index                                     West Texas Intermediate Spot Price of Oil
Standard deviations from average value                                 Dollars per barrel
   6                                                                   130

   4                                                                   110

   2                                                                    90

   0                                                                    70

   -2                                                                  50
     1998        2002         2006         2010   2014   2018   2022   Sep 2021               Nov 2021               Jan 2022    Mar 2022

Source: Federal Reserve Bank of New York                                Source: US Energy Information Administration via FRED

                                                                                                               Dynan Global Economic Prospects | 17
Inflation is heavily influenced by expectations and
also by previous inflation
Long-term Inflation Expectations                                                           Monthly Google Searches for "Inflation"
Percent
                                                                                           Index
5                                                      The limited rise in longer‐term                                                   But people noticed the higher
                                                                                           120
                                                       expectations will help tame                                                       inflation in 2021 and that will boost
                                                       inflation                                                                         price setting this year
4                                                                                          100

                    households (next 5-10 yrs)
                                                                                            80
3

                                                                                            60
2
    private
    forecasters                                                                             40
    (next 10 yrs)                                     market-based
1                                                     (5 yr, 5 yrs ahead)
                                                                                            20

0                                                                                           0
    2004              2008               2012               2016               2020              2004           2008              2012              2016            2020

Source: University of Michigan, Survey of Professional Forecasters, Federal Reserve Bank    Note: Last data point is March 2022
of St. Louis via FRED.                                                                      Source: Google Trends

                                                                                                                                   Dynan Global Economic Prospects | 18
The Fed will likely need to raise rates
aggressively to subdue inflation                                                                                                                Q4/Q4 forecasts:
                                                                                                                                                         headline         core
 Federal Funds Rate                                                                              Consumer Prices                                2022       5.0%           2.9%
 Percent                                                                                         12-month percent change                        2023       4.1%           3.0%
  4.5                                                                                        8

   4                                                                                         7
  3.5
                                                                                             6
   3                                                                                                                                            headline PCE
                                                                                             5
  2.5
                                                                                             4
   2

  1.5                                                                                        3                                                                core PCE
                                                                                                       Fed target
   1                                                                                         2
  0.5
                                                                                             1
   0
        Q1     Q2          Q3   Q4   Q1    Q2          Q3   Q4   Q1   Q2          Q3   Q4    0
                    2021                        2022                       2023               2014    2015    2016    2017    2018    2019    2020     2021    2022      2023
Note: Dashed line corresponds to forecast                                                   Note: Dashed lines correspond to forecasts
Source: Federal Reserve via FRED and author’s forecast                                      Source: US Bureau of Economic Analysis via FRED and author’s forecast

                                                                                                                                     Dynan Global Economic Prospects | 19
Fed tightening causes the labor market
to cool                                                      Q4 average forecasts:
 Unemployment Rate                                           2022      3.8%
 Percent                                                     2023      4.5%
 14                                                                                         The unemployment rate rises to 4.5
 12                                                                                         percent in this forecast, about ½
 10
                                                                                            percentage point above the natural
                                                                                            rate
  8

  6                                                                                         The job openings rate falls back
  4
                                                                                            close to traditional levels
  2                                                                                         (Inflation is also tempered by tighter
  0                                                                                         monetary policy keeping long-term
                                                                                            inflation expectations contained)
      Q1 Q2 Q3 Q4 Q1 Q2 Q3 Q4 Q1 Q2 Q3 Q4 Q1 Q2 Q3 Q4 Q1 Q2 Q3 Q4 Q1 Q2 Q3 Q4 Q1 Q2 Q3 Q4
          2017        2018        2019        2020         2021        2022      2023
Note: Dashed line corresponds to forecast
Source: US Bureau of Labor Statistics via FRED and author’s forecast

                                                                                                          Dynan Global Economic Prospects | 20
Uncertainty is higher than usual and
recession risks are elevated
Consider the following possible developments:
• Continued fighting in Ukraine pushes up global energy and food prices more
  than currently envisioned
• Inflation expectations move up and core inflation stays high
• The Fed responds by raising the funds rate much more than expected, and
  asset prices fall sharply
• Consumers worry more about risks and pull back on spending
• Rolling COVID shutdowns slow Chinese growth
Some combination of these factors could push the economy into recession by
the end of this year

                                                         Dynan Global Economic Prospects | 21
High Inflation and Slowing Growth

Karen Dynan
karen.dynan@piie.com

1750 Massachusetts Avenue, NW | Washington, DC 20036 | www.piie.com
You can also read