Housing and Property Sector Chartpack December 2021

Page created by Clarence Byrd
 
CONTINUE READING
Housing and Property Sector Chartpack December 2021
Housing and Property Sector
Chartpack
December 2021

Prepared by the Economics Division
Department of Finance
www.gov.ie/finance
Housing and Property Sector Chartpack December 2021
Introduction
Given the important implications which developments in the property and construction sector can have for the
economy, the Department of Finance actively monitors developments in this sector on an ongoing basis. The Housing
and Property Sector Chartpack sets out some of the key indicators used by the Department for this purpose. Each
section of the Chartpack examines a different component of the sector, including residential property prices and rents,
affordability metrics, construction sector activity, property market transactions and mortgage market activity. The
publication of the Chartpack is intended to provide a useful source of information on the sector and to make these
indicators accessible to a wider audience. Note, while housing and property data updates are frequent, this Chartpack
contains all updates to available data at the date of publication.

                                                          Table of Contents

  Introduction: ....................................................................................................................................... 2
  Section 1: Residential Property Price and Rent Developments ........................................................ 3
  Section 2: Affordability Metrics ......................................................................................................... 7
  Section 3: Construction Sector Activity ............................................................................................. 9
  Section 4: Property Market Transactions ........................................................................................ 13
  Section 5: Mortgage Market Activity............................................................................................... 15

Department of Finance | Housing and Property Sector Chartpack                                                                                               Page | 2
Housing and Property Sector Chartpack December 2021
Section 1: Residential Property Price and Rent Developments
 Figure 1.1 CSO Residential Property Price Index (RPPI) month-on-month
                                                                Latest developments:
                                                                   Between September and October 2021, the national
                                                                      residential property price index increased by 1.4%.

                                                                     In Dublin prices increased by 1%.

                                                                     Prices outside of Dublin increased 1.7% over the
                                                                      month.

                                                                Notes: The latest three months of data are provisional and
                                                                subject to revisions.

                                                                Source: CSO
                                                                Last updated: December 2021 Next update: January 2022
 Figure 1.2 CSO RPPI Year-on-Year Change
                                                                Latest developments:

                                                                     In the year to October 2021 residential property prices
                                                                      increased by 13.5%, the highest level of property price
                                                                      inflation since May 2015.

                                                                     In the year to October 2021, the residential property
                                                                      price index in Dublin increased by 12.3%, compared to
                                                                      the fall in the index of 1.3% in the 12 months to
                                                                      October 2020.

                                                                     Prices in the rest of Ireland excluding Dublin were up
                                                                      14.6%, compared to an increase of 0.3% in the 12
                                                                      months to October 2020.

                                                                Source: CSO
                                                                Last updated: December 2021 Next update: January 2022
 Figure 1.3 CSO RPPI by Housing Type
                                                                Latest developments:
                                                                  Between September and October house prices
                                                                     increased by 1.5%.

                                                                    Nationally, apartment prices increased by 0.5%
                                                                     between September and October 2021. In Dublin,
                                                                     apartment prices also increased by 0.7% over the
                                                                     month.

                                                                    Nationally excluding Dublin, house prices have
                                                                     increased 14.7% over the year.

                                                                    Dublin house prices are up 13.3% over the year.

                                                                    Dublin apartment prices increased by 8.1% over the
                                                                     year.
                                                                Source: CSO
                                                                Last updated: December 2021 Next update: January 2022

Department of Finance | Housing and Property Sector Chartpack                                                   Page | 3
Figure 1.4 Comparison of Property Price Indices
                                                                Latest developments:
                                                                  The latest CSO data shows there has been a 13.5%
                                                                     increase in property prices in October 2021 compared to
                                                                     October 2020.

                                                                    According to the Daft.ie Q3 2021 House Price Report
                                                                     asking prices in the third quarter of 2021 were 9.1%
                                                                     higher than a year previously

                                                                    The MyHome.ie Q3 2021 property report shows there has
                                                                     been a 9% increase in asking prices between Q3 2020 and
                                                                     Q3 2021.

                                                                Note: The MyHome and Daft.ie index has been recalculated
                                                                to make 2015 the base year.
                                                                Source: CSO, Daft.ie, MyHome.ie
                                                                Last updated: December 2021 Next update: January 2022
 Figure 1.5 Rolling 12 month Median Sales Price
                                                                Latest developments:
                                                                 The 12 month rolling median market transaction price was
                                                                    €275,000 nationally in October 2021.

                                                                   The 12 month rolling median price of a new dwelling was
                                                                    €353,075 in October 2021.

                                                                   The 12 month rolling median price of a second hand
                                                                    dwelling was €251,000 in October 2021.

                                                                Note: The estimated median price is not quality adjusted and
                                                                cannot account for the location or the physical characteristics
                                                                of the properties.

                                                                Source: CSO
                                                                Last updated: December 2021 Next update: January 2022
 Figure 1.6 Dublin House Prices Year-on-Year Change
                                                                Latest developments:

                                                                   Across the Dublin regions Dublin City house prices
                                                                    experienced the largest annual increase in the 12 months
                                                                    to October 2021 increasing by 15.5%.

                                                                   The lowest rate of annual growth across the Dublin regions
                                                                    was in Fingal, where in the 12 months to October 2021
                                                                    house prices increased by 9.6%.

                                                                Note: The regional indices only reflect changes in house prices
                                                                and do not take into account apartment prices.

                                                                Source: CSO
                                                                Last updated: December 2021 Next update: January 2022

Department of Finance | Housing and Property Sector Chartpack                                                  Page | 4
Figure 1.7 Change in Regional House prices since trough
                                                                Latest Developments:

                                                                   House prices in Dublin have increased by 117.7% and in
                                                                    the Midland Region have increased by 127.4% from the
                                                                    trough in the market.

                                                                   The Border region has seen the slowest growth in house
                                                                    prices, increasing 102.2% from the bottom of the
                                                                    market.

                                                                Note: The regional indices reflect changes in house prices
                                                                only and do not take into account apartment prices.

                                                                Source: CSO
                                                                Last updated: December 2021 Next update: January 2022
 Figure 1.8 The 12 Month Rolling Median Transaction Price
 by Region
                                                                Latest developments:

                                                                    Significant variation in transaction prices across the
                                                                     country.

                                                                    Highest 12 month rolling median transaction price in
                                                                     October 2021 was in Dublin, at €402,500.

                                                                    The lowest 12 month rolling median transaction price in
                                                                     October 2021 was in the Border region at €150,000.

                                                                Note: The estimated median price is not quality adjusted
                                                                and cannot account for the location or the physical
                                                                characteristics of the properties.

                                                                Source: CSO
                                                                Last updated: December 2021 Next update: January 2022
 Figure 1.9 Rent Indices
                                                                Latest developments:
                                                                 The RTB rent index is the most comprehensive source of
                                                                    rent prices in Ireland.

                                                                   Nationally, average rents increased by 3.3% between Q2
                                                                    2021 and Q3 2021 according to the RTB index*.

                                                                    The RTB national standardised average rent in Q3 2021
                                                                     was €1,397 per month.
                                                                 Nationally the average asking rent was €1,516 in
                                                                     October 2021 according to the Daft Rental Price Report
                                                                     Q3 2021.
                                                                Note: *Note that RTB data is not seasonally adjusted. Also
                                                                seasonal patterns are evident in the RTB data when
                                                                interpreting quarter on quarter changes.
                                                                Source: CSO, Daft, RTB
                                                                Last updated: December 2021 Next update: January 2022

Department of Finance | Housing and Property Sector Chartpack                                                    Page | 5
Figure 1.10 Rent Indices Year-on-Year % Change
 Figure 1.10 Rent Indices Year-on-Year % Change                 Latest developments:

                                                                   According to the RTB index, rents increased by 8.3% in
                                                                    Q3 2021 compared to Q3 2020.

                                                                   CSO CPI Private Rent inflation was approximately 8.1%
                                                                    higher in November 2021 compared to November 2020.

                                                                   Asking rents were 9.4% higher on an annual basis in
                                                                    October 2021, according to the Daft Housing Market
                                                                    Report Q3 2021.

                                                                Source: CSO, Daft, RTB
                                                                Last updated: December 2021 Next update: January 2022
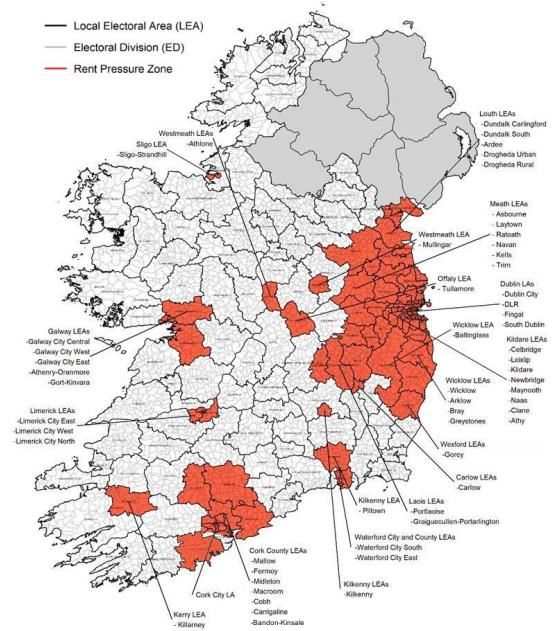
 Figure 1.11 Rent Pressure Zones
                                                                Latest developments:

                                                                   National standardised average rent in Q3 2021 increased
                                                                    annually by 7%, to €1,397 per month.

                                                                   From December 11th 2021, when setting the rent at the
                                                                    start of a tenancy in a RPZ or when carrying out a rent
                                                                    review in a RPZ, rent increases are capped at 2% per
                                                                    year on a pro rata basis, where HICP inflation is higher.

                                                                   As of November 2021 HICP inflation stood at 5.4%.

                                                                The two criteria required to be classified as an RPZ are:
                                                                (1) The annual rate of rental growth in an area must have
                                                                    exceeded 7% in 4 of the last 6 quarters.
                                                                (2) The average rent in an area must exceed the relevant
                                                                    national standardized average in that quarter.

                                                                From June 2019 there are three different standardized
                                                                average rents to be used when assessing an area:
                                                                 (1) Dublin areas will remain compared to the national
                                                                s standardized average rent.
                                                                 (2) The GDA excluding Dublin will be compared to the        n
                                                                national standardized average rent excluding Dublin
                                                                 (3) The rest of the country outside the GDA and Dublin
                                                                w will be compared to an outside GDA standardised
                                                                average rent.
                                                                Source: RTB
                                                                Last updated: December 2021 Next update: Q1 2022

Department of Finance | Housing and Property Sector Chartpack                                                  Page | 6
Section 2: Affordability Metrics
 Figure 2.1 House Price/ Disposable Income per capita
                                                                Latest developments:

                                                                    Average house prices were 12.4 times average
                                                                     disposable income per capita in Q2 2021.

                                                                    This is slightly below the long term average of 12.72.

                                                                Notes: House Price series is based on CSO average house
                                                                price in Q2 2017, which is then indexed to the CSO House
                                                                Price Index and the PRTB/ESRI Index. The long term average
                                                                is for the period 1999Q4-2021Q2.

                                                                Source: CSO, ESRI/PRTB – pre 2017
                                                                Last updated: October 2021 Next update: January 2022
 Figure 2.2 House Price/Disposable Income per household
                                                                Latest developments:
                                                                  Average house prices were 4.5 times average gross
                                                                     disposable household income in Q2 2021.

                                                                    The ratio is equal the long term average of 4.5.

                                                                Definition: House Price/ Disposable Income per household

                                                                Notes: House Price series is based on CSO average house
                                                                price in Q4 2017, which is then indexed to CSO House Price
                                                                Index and the PRTB/ESRI Index. The long term average is for
                                                                the period 1999Q4-2021Q2.

                                                                Source: CSO, ESRI/PRTB – pre 2017
                                                                Last updated: October 2021 Next update: January 2022

 Figure 2.3 Average National Rent/Disposable Income per
 Household
                                                                Latest developments:

                                                                   Rents accounted for approximately 23.5% of household
                                                                    disposable income in 2021 Q2.

                                                                   The Rent to Income ratio increased in Q2 2021 after the
                                                                    fall off seen during more severe public health
                                                                    restrictions.

                                                                Note: Long term average estimated for period 2002Q1-
                                                                2021Q2.

                                                                Source: CSO, RTB.
                                                                Last updated: October 2021 Next update: January 2022

Department of Finance | Housing and Property Sector Chartpack                                                   Page | 7
Figure 2.4 House Price/Rent Ratio
                                                                Latest developments:

                                                                   House prices are approximately 19.7 times average
                                                                    annual rents in Q3 2021.

                                                                   The ratio showed a slight uptick in Q3 2021, however,
                                                                    the ratio is still below the long term average of 23.2.

                                                                Note: Long term average is for period 2002Q1-2021Q3.
                                                                Source: CSO, RTB.
                                                                Last updated: December 2021 Next update: January 2022

Department of Finance | Housing and Property Sector Chartpack                                                   Page | 8
Section 3: Construction Sector Activity
 Figure 3.1 Completions and Registrations
                                                                Latest developments:

                                                                    In the year to Q3 2021 there were 20,903 new home
                                                                     completions. This represents a 2% decrease on Q2
                                                                     2021.

                                                                   Registrations in the year to Q3 2021 (15,316) are up
                                                                    23% on the year to Q2 2021.

                                                                Source: CSO, DHLGH
                                                                Last updated: November 2021 Next update: Q1 2022
 Figure 3.2 Completions by Region
                                                                Latest developments:

                                                                    Completions in the 12 months to September 2021:
                                                                     Dublin 6,200, Kildare, Meath and Wicklow 3,987, ROC
                                                                     10,716.

                                                                   Home completions in Dublin in the 12 months to
                                                                    September 2021 (6,200) were 11% higher than the 12
                                                                    months to September 2020.

                                                                   In Kildare, Meath and Wicklow completions (3,987)
                                                                    decreased by 5% in the 12 months to September 2021,
                                                                    while the rest of the country (10,716) saw an 9%
                                                                    increase in completions

                                                                Source: CSO
                                                                Last updated: November 2021 Next update: Q1 2022
 Figure 3.3 Housing Completions by type
                                                                Latest developments:
                                                                  In Q3 2021, apartments accounted for 55% of total
                                                                     completions in Dublin.
                                                                 In Q3 2021, 41% (502) of residential units built in Dublin
                                                                    were scheme houses.
                                                                 Outside of the Dublin region 24% (1,139) of residential
                                                                    units completed in Q3 2021 were individual houses, 42%
                                                                    (1,956) were scheme houses and 7% (326) were
                                                                    apartments.

                                                                Definition: "Single House" is where connection is provided to
                                                                separate detached house. "Scheme House" is where connection is
                                                                provided to two or more houses. "Apartments" is where all
                                                                customer metering for the block is centrally located.

                                                                Source: CSO
                                                                Last updated: November 2021 Next update: Q1 2022

Department of Finance | Housing and Property Sector Chartpack                                                      Page | 9
Figure 3.4 House Commencements, Quarterly
                                                                Latest developments:

                                                                   30,947 units were commenced in the 12 months to
                                                                    October 2021 representing the highest level of housing
                                                                    starts since July 2008.

                                                                   There were 24,001 commencements between April
                                                                    and October 2021 following the full reopening of the
                                                                    construction sector.

                                                                Source: DHLGH
                                                                Last updated: December 2021 Next update: January 2022

 Figure 3.5 House commencements by region, Quarterly
                                                                Latest developments:

                                                                   In Q3 2021, 58% of all commencement notices were in
                                                                    Dublin and the surrounding commuter counties.

                                                                   In the 12 months to October 2021, there were 11,086
                                                                    commencement notices in Dublin, 41% higher than the
                                                                    12 months to October 2020.

                                                                   Commencement activity outside of the Greater Dublin
                                                                    Region has also shown a strong rebound following the
                                                                    easing of public health restrictions on residential
                                                                    construction. Between April and October there were
                                                                    8,926 commencements outside the GDA, compared to
                                                                    the 2,520 commencements in the six months between
                                                                    October 2020 and March 2021

                                                                Source: DHLGH
                                                                Last updated: December 2021 Next update: January 2022
 Figure 3.6 Construction Sector Employments
                                                                Latest developments:
                                                                  The seasonally adjusted number of people in
                                                                     employment in the construction sector in Q3 2021 was
                                                                     144,400. This represents a 17.2% increase from the
                                                                     127,200 workers employed in Q2 2021.

                                                                   Construction sector employment as of Q3 2021
                                                                    accounted for 5.9% of total employment.

                                                                Note: As of 14th December 2021 there were 5,594
                                                                construction workers in receipt of the Pandemic
                                                                Unemployment Payment (PUP). This compares to the 2021
                                                                peak of 63,700 construction workers on 9th February and an
                                                                overall peak of 84,653 construction workers on 4th May
                                                                2020.
                                                                Source: CSO, LFS, DEASP
                                                                Last updated: December 2021 Next update: Q1 2022

Department of Finance | Housing and Property Sector Chartpack                                                 Page | 10
Figure 3.7 Construction Wages Year-on-Year Change
                                                                Latest developments:

                                                                   Wages in the construction sector have increased by 12%
                                                                    between 2020 Q3 and 2021 Q3.

                                                                   In comparison wages across all sectors have increased
                                                                    by 11.2% over the same period.

                                                                Source: CSO
                                                                Last updated: December 2021 Next update: Q1 2022

 Figure 3.8 Investment
                                                                Latest developments:

                                                                   Investment in the construction of new dwellings stood
                                                                    at €1,206 million in Q3 2021, 7% lower than pre-
                                                                    pandemic levels in Q3 2019.

                                                                   Investment in new dwellings made up approximately
                                                                    10.6% of all investment* in Q6 2021.

                                                                *Note: Investment equates to ‘Modified’ Gross Domestic
                                                                Fixed Capital Investment as it removes the distortionary
                                                                impact of R&D-related intellectual property imports and
                                                                aircraft leasing and better captures domestic investment
                                                                activity.

                                                                Source: Quarterly National Accounts, CSO
                                                                Last updated: December 2021 Next update: Q1 2022
 Figure 3.9 Ulster Bank Purchasing Managers Index (PMI) for the Construction sector
                                                                Latest developments:
                                                                  Construction activity is now showing an expansion
                                                                     following the lifting of stringent public health
                                                                     restrictions earlier this year.

                                                                   The Construction PMI was 56.3 in November, the
                                                                    seventh consecutive month of expansion. Housing
                                                                    activity, a subcategory of the overall PMI, had a reading
                                                                    of 55.1 in November. By contrast in November 2020, a
                                                                    housing activity PMI of 53 was recorded.

                                                               Methodology:
                                                                This PMI surveys selected companies which provide an
                                                                advance indication of what is happening in the construction
                                                                sector by tracking variables such as output, new orders,
                                                                employment and prices across the construction sector. A
                                                                reading of >50(
Figure 3.10 Planning permissions (new units) by region
                                                                Latest developments:
                                                                  11,428 units were granted planning permission in Q3
                                                                     2021, a 16% decrease compared with Q3 2020 (13,599).

                                                                   In Q3 2021, 59% of the units granted planning permission
                                                                    (6,749) were in Dublin and the Greater Dublin Area
                                                                    (Kildare, Meath and Wicklow).

                                                                   In the Rest of the Country the number of units granted
                                                                    planning permission (4,679) increased by 13.6%
                                                                    compared to Q3 2020.

                                                                Note: Planning permissions based on data for new build units
                                                                only. Figures for extensions and renovations have been
                                                                excluded.

                                                                Source: CSO
                                                                Last updated: December 2021 Next update: Q1 2022

Department of Finance | Housing and Property Sector Chartpack                                                Page | 12
Section 4: Property Market Transactions
 Figure 4.1 Quarterly Market Transactions
                                                                Latest developments:
                                                                  Transactions in Q3 2021 were 12,550, a decrease of 20
                                                                     per cent nationally compared to pre-pandemic levels in
                                                                     Q3 2019.

                                                                   Transactions in Q3 in Dublin were 3,913, a decrease of
                                                                    30% on Q3 2019. Transactions in Kildare, Meath and
                                                                    Wicklow were 1,844, a decrease of 12% on Q3 2019,
                                                                    while in the rest of the country transactions were 6,793,
                                                                    a decrease of 14% over the same time period.

                                                                Source: CSO RPPI
                                                                Last updated: November 2021 Next update: February 2022
 Figure 4.2 Four Quarter Residential Property Trans.
                                                                Latest developments:

                                                                   At 55,746, transactions were 2.1% lower in the 12
                                                                    months to Q3 2021 compared to pre-pandemic levels in
                                                                    the 12 months to Q3 2019.

                                                                   Transactions were 12% lower in Dublin, 6% higher in
                                                                    Kildare, Meath and Wicklow and 1.7 % higher in the rest
                                                                    of the country compared with pre pandemic levels up to
                                                                    Q3 2019.

                                                                   Annual transactions are approximately 2.6% of total
                                                                    housing stock.

                                                                Source: CSO RPPI
                                                                Last updated: November 2021 Next update: February 2022
 Figure 4.3 Regional Breakdown of Transactions
                                                                Latest developments:

                                                                   In Q3 2021, Dublin accounted for 31% of all transactions.
                                                                    While Kildare, Meath and Wicklow accounted for 15% of
                                                                    transactions with the rest of the country accounting for
                                                                    the remaining 54% of all transactions in Q3 2021.

                                                                   The chart shows that the regional breakdown of
                                                                    transactions has been relatively steady across all regions
                                                                    of the country since 2010.

                                                                Source: CSO RPPI
                                                                Last updated: November 2021 Next update: February 2022

Department of Finance | Housing and Property Sector Chartpack                                                     Page | 13
Figure 4.4 Proportion of Residential Market Buyers
                                                                Latest Developments:
                                                                   Former owner occupiers represent the largest share of
                                                                      the market, accounting for 45% of all transactions in Q3
                                                                      2021.

                                                                     The share of first-time buyers (FTB) has increased from
                                                                      21% in Q1 2016 to 27% in Q3 2021.

                                                                     Non-Household purchasers (e.g. private firms and public
                                                                      sector institutions) accounted for 16% of market
                                                                      transactions in Q3 2021.

                                                                     Household buyer –non occupiers accounts for 11% of
                                                                      residential market buyers. This share has fallen from a
                                                                      high of 23% in Q1 2014.

                                                                Source: CSO RPPI
                                                                Last updated: November 2021 Next update: February 2022

Department of Finance | Housing and Property Sector Chartpack                                                     Page | 14
Section 5: Mortgage Market Activity
 Figure 5.1 No. of Mortgages Drawn Down
                                                           Latest developments:

                                                               The number of mortgage drawdowns for home
                                                                purchase in Q3 2021 (9,124) was 4% lower than pre-
                                                                pandemic levels in Q3 2019.

                                                               Composition of mortgage drawdowns in Q3 2021: FTB
                                                                53%, Movers 25%, Investment 2%, Re-mortgage 14%
                                                                and Top-up 6%.

                                                               Approximately 66% of all mortgages drawn down for
                                                                purchases were by first-time buyers in Q3 2021.

                                                           Source: BPFI – Data from BPFI member institutions.
                                                           Last updated: October 2021 Next update: Q1 2022

 Figure 5.2 Value of Loans Drawn down
                                                           Latest developments:

                                                               The value of mortgage drawdowns for house
                                                                purchases in Q3 2021 (€2,313m) increased by 3%
                                                                compared to pre-pandemic levels in Q3 2019.

                                                               Composition of value all mortgage drawdowns in Q3
                                                                2021: FTB 53%, Movers 29%, Investment 1%, Re-
                                                                mortgage 14% and Top-up 2%.

                                                               Approximately 64% of the value of all mortgages
                                                                drawn down for purchases were by first-time buyers.

                                                           Source: BPFI – Data from BPFI member institutions.
                                                           Last updated: October 2021 Next update: Q1 2022

 Figure 5.3 Mortgage Interest Rates
                                                           Latest developments:

                                                               The average mortgage interest rate on the stock of
                                                                outstanding housing loans with original maturity over
                                                                5 years was approximately 2.4% in October 2021.

                                                               This figure disguises compositional differences
                                                                between those on standard variable rates and tracker
                                                                mortgages.

                                                           Source: Central Bank, CSO.
                                                           Last updated: December 2021 Next update: January 2022

Department of Finance | Housing and Property Sector Chartpack                                                   Page | 15
Figure 5.4 Interest Rate on New Housing loans
                                                           Latest developments:

                                                               The average mortgage interest rate agreed on new
                                                                housing loans is 2.6% as of October 2021.

                                                               This is an increase on the 2.5% recorded in April 2021,
                                                                which was the lowest prevailing rate of interest on
                                                                new housing loans since the beginning of the data set
                                                                in 2003.

                                                           Source: Central Bank.
                                                           Last updated: December 2021 Next update: January 2022

Department of Finance | Housing and Property Sector Chartpack                                                   Page | 16
Tithe an Rialtas. Sráid Mhuirfean Uacht,
Baile Átha Cliath 2, D02 R583, Éire
Government Buildings, Upper Merrion Street,
Dublin 2, D02 R583, Ireland

T:+353 1 676 7571
@IRLDeptFinance
www.gov.ie/finance

Department of Finance | Housing and Property Sector Chartpack   Page | 17
You can also read