How can the public health impact of vaccination be estimated?
←
→
Page content transcription
If your browser does not render page correctly, please read the page content below
Echeverria-Londono et al. BMC Public Health             (2021) 21:2049
https://doi.org/10.1186/s12889-021-12040-9

 RESEARCH                                                                                                                                         Open Access

How can the public health impact of
vaccination be estimated?
Susy Echeverria-Londono1† , Xiang Li1† , Jaspreet Toor1† , Margaret J. de Villiers1 , Shevanthi
Nayagam1 , Timothy B. Hallett1 , Kaja Abbas2 , Mark Jit2 , Petra Klepac2 , Kévin Jean1,3,4 , Tini Garske1 , Neil M.
Ferguson1 and Katy A. M. Gaythorpe1*

  Abstract
  Background: Deaths due to vaccine preventable diseases cause a notable proportion of mortality worldwide. To
  quantify the importance of vaccination, it is necessary to estimate the burden averted through vaccination. The
  Vaccine Impact Modelling Consortium (VIMC) was established to estimate the health impact of vaccination.
  Methods: We describe the methods implemented by the VIMC to estimate impact by calendar year, birth year and
  year of vaccination (YoV). The calendar and birth year methods estimate impact in a particular year and over the
  lifetime of a particular birth cohort, respectively. The YoV method estimates the impact of a particular year’s
  vaccination activities through the use of impact ratios which have no stratification and stratification by activity type
  and/or birth cohort. Furthermore, we detail an impact extrapolation (IE) method for use between coverage scenarios.
  We compare the methods, focusing on YoV for hepatitis B, measles and yellow fever.
  Results: We find that the YoV methods estimate similar impact with routine vaccinations but have greater yearly
  variation when campaigns occur with the birth cohort stratification. The IE performs well for the YoV methods,
  providing a time-efficient mechanism for updates to impact estimates.
  Conclusions: These methods provide a robust set of approaches to quantify vaccination impact; however it is vital
  that the area of impact estimation continues to develop in order to capture the full effect of immunisation.
  Keywords: Vaccine, Impact, Modelling, Hepatitis, Measles, Yellow fever

Background                                                                              as measles [2, 3]. Most vaccines have been shown to be
Vaccination is one of the most effective interventions                                  safer than therapeutic medicines and are deemed second
against infectious diseases and is estimated to prevent                                 only to safe drinking water in terms of public health
2-3 million deaths annually, with an additional 1.5 mil-                                benefit [4–6].
lion deaths that could be averted with improvements in                                    Of the burden that does occur due to vaccine pre-
global vaccination coverage [1]. Vaccines can provide                                   ventable diseases, the majority is in low- and middle-
cost-effective, long-term protection and have resulted in                               income countries (LMICs) [7]. In many countries, the lack
the eradication of two major pathogens, rinderpest and                                  of reliable surveillance data and the inability to observe
smallpox, as well as the local elimination of others, such                              the burden that would have occurred without vaccina-
                                                                                        tion makes it difficult to directly calculate the mortality
*Correspondence: k.gaythorpe@imperial.ac.uk                                             and morbidity prevented by vaccination. Hence, mathe-
† Susy Echeverria-Londono, Xiang Li and Jaspreet Toor contributed equally to

this work.
                                                                                        matical models are crucial for providing estimates of the
1
  MRC Centre for Global Infectious Disease Analysis, Jameel Institute, School of        burden averted by immunisation as they can project a no-
Public Health, Imperial College London, London, UK                                      vaccination (counterfactual) scenario and scenarios with
Full list of author information is available at the end of the article

                                          © The Author(s). 2021 Open Access This article is licensed under a Creative Commons Attribution 4.0 International License,
                                          which permits use, sharing, adaptation, distribution and reproduction in any medium or format, as long as you give appropriate
                                          credit to the original author(s) and the source, provide a link to the Creative Commons licence, and indicate if changes were
                                          made. The images or other third party material in this article are included in the article’s Creative Commons licence, unless
                                          indicated otherwise in a credit line to the material. If material is not included in the article’s Creative Commons licence and your
                                          intended use is not permitted by statutory regulation or exceeds the permitted use, you will need to obtain permission directly
                                          from the copyright holder. To view a copy of this licence, visit http://creativecommons.org/licenses/by/4.0/. The Creative
                                          Commons Public Domain Dedication waiver (http://creativecommons.org/publicdomain/zero/1.0/) applies to the data made
                                          available in this article, unless otherwise stated in a credit line to the data.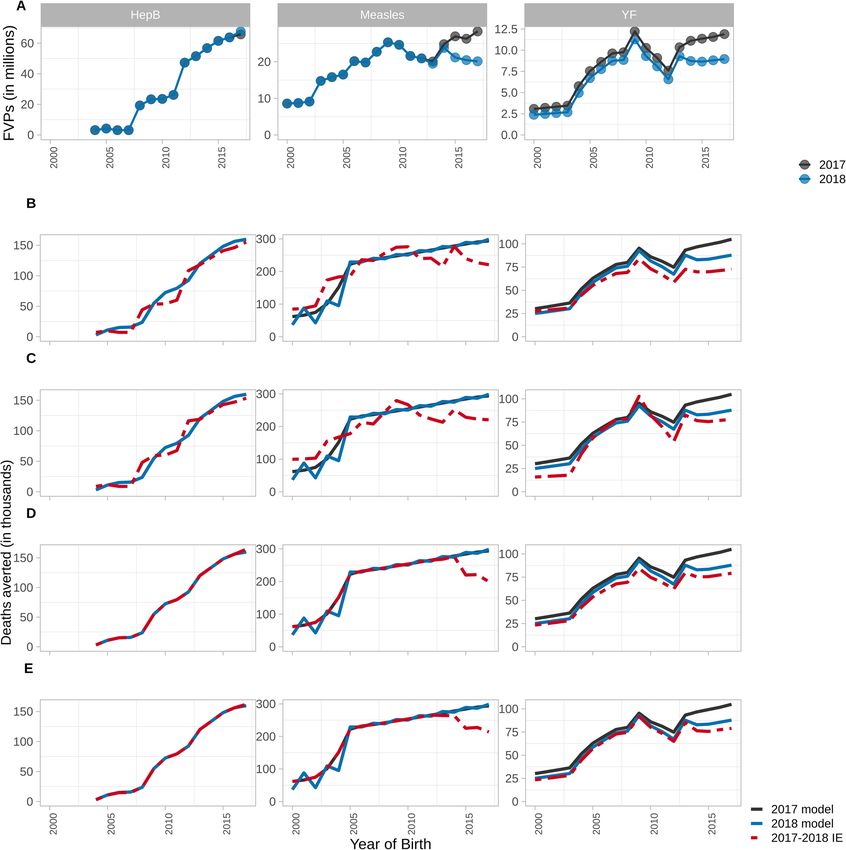
Echeverria-Londono et al. BMC Public Health   (2021) 21:2049                                                    Page 2 of 12

vaccination [8]. The Vaccine Impact Modelling Consor-          the underlying model being used. The models within
tium (VIMC) [9] was established in 2016, formally bring-       the VIMC vary from being static, whereby the direct
ing together several modelling groups and a secretariat        effects of vaccination on FVPs are modelled assuming that
with a history of working together to estimate the impact      pathogen transmission intensity is not modified by vacci-
of vaccines against ten pathogens, namely, Haemophilus         nation coverage, to dynamic, whereby infectious disease
influenzae type b (Hib), hepatitis B (HepB), human papil-      transmission dynamics, direct effects of vaccination on
lomavirus (HPV), Japanese encephalitis, measles, Neisse-       FVPs and herd effects are modelled. Herd effects account
ria meningitidis serogroup A (Meningitis A), rotavirus,        for any indirect effects of immunity (both natural and/or
rubella, Streptococcus pneumoniae and yellow fever (YF).       from vaccination activities) due to a reduction in trans-
Estimating the impact of vaccination is important as this      mission. For example, an increase in FVPs offers indirect
reveals the effectiveness of current global vaccination        protection as it reduces the risk of a non-vaccinated indi-
strategies and whether any changes are needed.                 vidual coming into contact with the disease. Herd effects
   Calculating vaccine impact is complex as for some           will not arise for all vaccine preventable diseases, for
pathogens, such as HepB and HPV, the consequences due          example, Japanese encephalitis is vector-borne (i.e. not
to disease are not seen until long after infection. Thus,      transmitted person-to-person) and the majority of cases
any vaccine impact is not immediately evident, but is still    are due to spillover events [11]. Hence in this case, FVPs
substantial leading to questions around how to appro-          will not provide protection to others.
priately attribute the impact of vaccination activities in        The VIMC uses vaccine coverage estimates from the
order to inform the public and policy makers of their          World Health Organization (WHO), United Nations Chil-
value. Vaccination activities also face a paradox as “vac-     dren’s Fund (UNICEF) and Gavi, the Vaccine Alliance
cines are victims of their own success” [10]. For example,     [12–14]. Due to changes and uncertainties in data on vac-
when the transmission of a fatal disease from an outbreak      cination coverage, estimates of coverage are constantly
is prevented by vaccination, political and public support      refined and updated [13], requiring estimates of vaccine
is assured. However, when vaccination is successful and        impact to be recalculated accordingly. Whilst mathemat-
the formerly-feared disease starts disappearing, the ben-      ical modelling of vaccine impact is vital to the process
efits of vaccination become less clear whilst the costs        of the VIMC and ascertaining the effect of vaccination,
remain visible. As a consequence, public and political sup-    it can be incredibly computationally expensive and time-
port may begin to decline. The benefits of the success of      consuming. This limitation sometimes precludes it from
vaccination and control of diseases become less obvious        being used for quick updates as new coverage becomes
with time, no longer being viewed with the same sense of       available; an event which can happen multiple times a
urgency.                                                       year. As such, the VIMC secretariat has developed an
   Through mathematical modelling of vaccination scenar-       impact extrapolation (IE) method whereby the impact
ios, we can explore the impact of vaccination activities       ratio (impact per fully vaccinated person) from one mod-
stratified by characteristics such as birth cohort. Mathe-     elling exercise can be applied to a new coverage scenario
matical modelling, such as that carried out by the VIMC,       in order to extrapolate the impact calculation to the latest
is able to provide estimates of disease burden in terms        coverage estimates.
of the number of cases, deaths and/or disability adjusted         In this paper, we describe the methods that have been
life years (DALYs). DALYs measure the years of healthy         implemented by the VIMC to calculate the vaccination
life lost due to disability from the disease and premature     impact by calendar year, birth year and year of vaccination
death. Comparing burden estimates in scenarios with and        (YoV). To show how these methods perform, we use exam-
without vaccination can then quantify the burden averted       ples from HepB, measles and YF. Further, we describe an
by vaccination. However, impact may be attributed in dif-      IE method which facilitates the estimation of impact from
ferent ways, some of which may be more appropriate in          new vaccination coverage scenarios without full model
some settings than others. For example, one may be inter-      runs. This is an approximation of the model projections
ested in the effect of vaccination on a particular birth       which, whilst informative, is not a replacement for full
cohort, so the impact of vaccination activities over the       model estimation. The IE does, however, allow for new
lifespan of that cohort needs to be aggregated. In con-        approximate estimates to be produced very quickly and we
trast, for advocacy, planning and financing, it is valuable    detail a number of approaches each with their strengths
to ascertain the impact attributable to a particular year’s    and weaknesses.
vaccination activities.
   As the burden in each vaccination scenario is calcu-        Methods
lated using mathematical models of pathogen transmis-          We detail a range of methods for calculating the impact of
sion dynamics and implementation of vaccination activ-         vaccination (D) defined as the burden averted for a given
ities, the impact of vaccination will vary depending on        disease, country, year and, in some cases, birth cohort.
Echeverria-Londono et al. BMC Public Health   (2021) 21:2049                                                                                Page 3 of 12

Each method is used to address a specific point of inter-            Table 2 Stratifications of the impact ratios (ρ)
est, such as the number of lives saved by vaccination in             No stratification: Vaccine                     Stratification by activity
                                                                     impact does not vary between                   type: Vaccine impact varies
a particular year (calendar year method), the number of              vaccination activities or birth                between RV and CV but does
individuals born in a particular year that will be saved due         cohorts in a population.                       not vary across birth cohorts.
to vaccination (birth year method), and the number of                ρ=     DR +DC
                                                                                                                    RV: ρR =       DR
                                                                                                                                         and CV:
                                                                          FVPR +FVPC                                              FVPR
individuals that will be saved due to a particular year’s vac-                                                      ρC =    DC
                                                                                                                           FVPC
cination activities (YoV methods). These usually involve
the comparison of a focal scenario, the vaccination sce-             Stratification by birth                        Stratification by activity
                                                                     cohort: Vaccine impact varies                  type and birth cohort:
nario we wish to assess, to a counterfactual or baseline             across birth cohorts in a                      Vaccine impact varies between
scenario, which is the vaccination scenario we wish to               population but does not vary                   vaccination activities and birth
compare against. We also detail the IE process and the               between vaccination activities.                cohorts.
                                                                               D(k)                                                  DR (k)
scenarios carried out. All parameters and variables are              ρ(k) =   FVP(k)                                RV: ρR (k) =    FVPR (k)   and CV:
defined in Table 1. Impact ratios are shown in Table 2 and                                                                      DC (k)
                                                                                                                    ρC (k) =   FVPC (k)
a summary of the impact methods is shown in Table 3.                 Here, FVPR and FVPC denote fully vaccinated persons (FVPs) due to routine (RV) or
                                                                     campaign vaccination activities (CV) only; DR and DC denote impact due to RV or CV
                                                                     only, D denotes impact from both routine and campaign vaccinations, and k
Impact by calendar year (cross-sectional impact)                     denotes a particular birth cohort
The calendar year method calculates the impact accrued
over all ages for a specific year. It is generally the most
intuitive and frequently used method to calculate the
                                                                     country c, this is given by D(c, k) = y−a=k Db−f (a, c, y),
impact of vaccination. In this case, the vaccine impact,
                                                                     where y ∈ Ym and a ∈ Am . The duration of modelling
Db−f (a, c, y), for age a, country c in year y is defined as the
                                                                     needs to be appropriate to the pathogen of interest as in
difference in disease burden between baseline and focal
                                                                     some cases, such as HepB, disease occurs later in life. For
scenarios for a given year, Db−f (a, c, y) = Bb (a, c, y) −
                                                                     example, if we model vaccination for birth cohorts born
Bf (a, c, y). Here, the baseline scenario can have no vacci-
                                                                     from 2000 to 2030 and model disease burden until 2100,
nation or different coverage to the focal scenario. Aggre-
                                                                     we do not account for the vaccine impact for those born
gating the impact over all ages modelled (Am ) means the
                                                                     in 2030 once they are over 70 years old. The method also
impact for a country c in year y is given by D(c, y) =
                                                                    does not specifically account for the impact of vaccinat-
   a∈Am Db−f (a, c, y). This does not account for the future         ing a cohort outside the cohort vaccinated (e.g. because of
disease burden averted through current vaccine activities.
                                                                     herd protection).
Impact by birth year (lifetime impact)
                                                                     Impact by year of vaccination
The birth year method accounts for the long-term impact
                                                                     The YoV methods are vital for determining the long-term
accrued over the lifetime of a particular birth cohort k. For
                                                                     impact of vaccination due to activities carried out in a par-
                                                                     ticular year. We obtain the impact ratio, ρ, as the impact
                                                                     attributable per fully vaccinated person (FVP) calculated
Table 1 Parameter and variable definitions
                                                                     as the coverage × cohort size. This ratio can be stratified
Parameter     Definition           Variable   Definition             by different characteristics, such as birth cohort in order
y             Year                 Bb         Burden in base-        to catch temporal changes in transmission or healthcare
                                              line/counterfactual    or by activity type to capture the differing effects of rou-
                                              scenario
                                                                     tine and campaign vaccination (RV and CV, respectively);
Yv            Years of             Bf         Burden in focal
              vaccination                     scenario
                                                                     see Table 2 for details. The impact ratio allows effects due
                                                                     to a particular year’s worth of vaccination to be attributed
Ym            Years evaluated      Db−f       Difference or impact
                                              between baseline and   to that year. Additionally, the impact ratio can then be pro-
                                              focal burden           jected with the IE method by updating the impact with
a             Age                             baseline and focal     a new estimate of FVPs; see impact extrapolation section
                                              scenarios (Bb − Bf )   for further details.
Av            Age at routine       ρ          Impact ratio (impact
              vaccination                     per FVP)               Impact by year of vaccination: unstratified impact ratio
Am            Ages modelled        D          Vaccine impact         The simplest approach to calculate the impact by YoV
                                                                     is with an unstratified impact ratio which assumes that
c             Country              FVP        The number of fully
                                              vaccinated persons     the effect of a vaccine is invariant over time and activ-
v             Vaccine
                                                                     ity type. As such, the impact ratio, ρ, for a country, c, is
                                                                     the attributable vaccine impact divided by the number of
k             Birth cohort
                                                                     FVPs:
Echeverria-Londono et al. BMC Public Health (2021) 21:2049 Page 4 of 12
Table 3 Summary of methods used by the VIMC for calculating the impact of vaccination (refer to Tables 1–2 for parameter values and
for stratifications of the year of vaccination method, respectively)
Method Definition Advantages Limitations
Calendar year Impact for a particular year Intuitive. Does not account for the long-term
impact of vaccination on individual
disease risk and cannot be linked to
specific vaccination activities.
Birth year Impact for a particular birth cohort Captures the long-term effects of Duration of modelling needs to be
vaccination in protecting those pathogen-appropriate, e.g. the
vaccinated. effects of HepB require a longer
modelling time frame. Does not
account for inter-cohort effects
(e.g. herd protection).
Year of vaccination (YoV) Impact attributed to year in which Possible to assess the effects of a An impact ratio is required which
vaccination occurred specific year’s activities and thus can be affected by the
provide a direct comparison of the years/activities or birth cohorts
number of doses provided and included, see Table 2 for details.
their effect. This is useful for Does not account for inter-cohort
planning and economic purposes. effects (e.g. herd protection).
DR (a, c, y)
y−a∈Yv −Av DR (a, c, y) + a∈Am DS (a, c, y)
y−a∈Yv −Av
ρ(c) =
y∈Ym
, ρR (c) = , (3)
FVPR (c, y)
y∈Yv FVPR (c, y) + y∈Yv FVPS (c, y) y∈Yv
(1) where Yv − Av are cohorts receiving vaccinations in years
Yv . The impact by year of vaccination is then:
where Yv − Av refers to cohorts vaccinated in Yv through
RV. Thus, the impact attributed to a year of vaccination is
given by: DR (c, y) = ρR (c) × FVPR (c, y), (4)
where FVPR are FVPs vaccinated through RV and the
D(c, y) = ρ(c) × FVP(c, y), (2) impact ratio is the same across age groups. This does not
account for the impact generated by indirect effects from
where FVP(c, y) = FVPR (c, y) + FVPS (c, y) and the impact and to cohorts not eligible for routine vaccination in Yv ,
ratio is the same across age groups. This method does nor does it account for interactions between RV and CV
not take into account any changes in treatment or trans- that may occur during or before years Y − v.
mission over time, nor the differing effects of vaccination For CV, the impact ratio is averaged evenly over all ages
through RV or CV. However, it is less complex to calcu- across the entire time period (Ym ). This is because we do
late and could be considered a weighted average of impact not attempt to predict future CV coverage after the final
ratios for each vaccination activity. year of credible campaign schedules. Therefore, the only
impact due to CV comes from CV years Yv and all cam-
Impact by year of vaccination: impact ratio stratified by paign impact for birth cohorts born after this period can
activity type be attributed back to these vaccination years. The impact
To calculate the impact by YoV using impact ratios strat- of CV, DC , is given by DbC −fC , where bC and fC are the
ified by activity type, we assume that RV and CV, which baseline and focal CV scenarios, respectively. The impact
target multiple age groups, have different effects; for ratio is given by the following:
example due to dosage clustering. Hence, this method
produces multiple activity-specific impact ratios which
can then be multiplied by the number of FVPs to calculate y∈Ym a∈Am DC (a, c, y)
impact. ρC (c) = . (5)
y∈Yv FVPC (c, y)
For RV, the impact ratio is defined as the impact for all
cohorts who are vaccinated over time period Yv per the The impact by year of vaccination is then given by the
additional FVPs between the baseline and focal scenarios. following:
The impact for RV, DR , is given by DbR −fR , where bR and fR
are the baseline and focal RI scenarios, respectively. Here,
the impact ratio for RV is: DC (c, y) = ρC (c) × FVPC (c, y), (6)Echeverria-Londono et al. BMC Public Health (2021) 21:2049 Page 5 of 12
where FVPC are FVPs vaccinated through CV. Again, this D(c, y) = DR (c, y) + DC (c, y)
does not account for interactions with the level of routine = ρR (c, k) × FVPR (c, k, y) + ρC (c, k) × FVPC (c, k, y).
coverage across or before the same years. k k
The aggregated impact by YoV for both activities is the (11)
sum of the impact from RV and CV, i.e. sum of Eqs. 4
Note that in the above method the numerator may
and 6.
also be affected by vaccination activities experienced by
Impact by year of vaccination: impact ratio stratified by birth cohorts around them, so not captured in the denominator.
cohort Hence the impact ratio could potentially be infinite.
In this method the impact ratio is invariant to vaccina-
tion activity type. However, vaccine effect is assumed to Summary of impact methods
vary over time through birth cohorts. This means that We summarise the key features of each vaccine impact
rather than averaging the effect of vaccination over time, method in Table 3.
we account for the variation in transmission and health
of the population. This influences how one year’s vacci- Impact extrapolation
nation may work compared to another. For example, if As coverage estimates are frequently updated within
therapeutic treatments for a disease improve over time, the WHO/UNICEF Estimates of National Immunization
we may expect the impact of vaccination in 2050 to be less Coverage (WUENIC) and Gavi’s Operational Forecast
than that now as the population is generally healthier. In (OP) [12–14], one of the vital tasks of the VIMC is to
this case, the impact ratio is cohort specific, given by the provide updated impact estimates to inform future RV
following equations: and CV. Translating these coverage estimates into tangi-
ble estimates of vaccine impact in terms of mortality and
morbidity averted is crucial. However, given the regular
Db−f (c, k) updates of vaccination coverage and the effort and time
ρ(c, k) = , (7)
FVP(c, k) required for full model updates across the VIMC, a sim-
plified process, the IE, has been developed to update past
where k is the cohort defined by k = y − a and a ∈ rounds of impact estimates with new coverage data.
Am . In order to find the impact attributed to one year of The IE is primarily a linear interpolation of current
vaccination, all cohort-specific impacts for those cohorts vaccine impact estimates with new coverage estimates
vaccinated in the year of interest must be aggregated. The assuming constant country- and delivery strategy-specific
impact by YoV is then given as follows: rates of mortality and morbidity averted per dose of vac-
cine. It can be applied to the YoV methods as these provide
us with an impact ratio (ρ in Table 2). Hence, when cov-
D(c, y) = ρ(c, k) × FVP(c, k, y), (8) erage is updated, the updated number of FVPs can be
k calculated by multiplying the new coverage with the target
population. The updated FVPs (FVP∗ ) are then multiplied
Impact by year of vaccination: impact ratio stratified by both
by the previously calculated ρ to calculate the updated
activity type and birth cohort
impact (D∗ ):
In the above methods, we illustrate the potential ways the
impact ratio could change between birth cohorts or by
vaccination activity. However, it is likely that in reality the D∗ (c) = ρ(c) × FVP∗ (c). (12)
impact varies with respect to both of these aspects. In
the following method, we use the approach of the activity Models and vaccination scenarios
stratification over birth cohort to arrive at an impact ratio In this analysis, we focus on calculating impact estimates
per birth cohort and activity. The impact ratios by activity for HepB (dynamic model with long-term outcomes and
(R for RV; C for CV) are thus the following: herd effects), measles (dynamic model with short-term
outcomes and herd effects) and YF (static model with-
out herd effects) [15–18]. Model details are provided in
DR (c, k) the supplementary material. We use anonymised coun-
ρR (c, k) = , (9)
FVPR (c, k) tries for each of the pathogens, denoted by Country A for
DC (c, k) HepB, Country B for measles and Country C for YF, with a
ρC (c, k) = . (10)
FVPC (c, k) focus on the years 2000–2017. The countries were chosen
as they included examples of relevant vaccination activi-
Therefore the impact by YoV is provided by the sum of ties over the time period. Standardised demographic data
the activity and cohort-specific components: (live births per year, death rates) are based on the 2017Echeverria-Londono et al. BMC Public Health (2021) 21:2049 Page 6 of 12 United Nations World Population Prospects (UNWPP) 2018–2030 routine and campaign coverage is updated to [19]. Immunisation coverage from 1980 to 2016 cor- Gavi’s October 2018 OP [14]. Changing coverage of activ- responds to the WHO/UNICEF Estimates of National ities alters the number of FVPs (population demography Immunization Coverage (WUENIC) as published in July and models remain the same). We then re-run the models 2017 [13], and 2017–2030 coverage corresponds to Gavi’s with this updated coverage scenario and compare to the IE October 2017 Operational Forecast (OP) [14, 15]. Using projections in order to determine the reliability of the IE. each of the vaccine impact methods, we calculate the All of the analyses were carried out in R and the impact number of deaths averted due to vaccination over the methods are available through the R package vimpact on years 2000–2017. Though we only show this for 2000– GitHub (https://github.com/vimc/vimpact) [20]. 2017, we are taking into account the impact of vaccination activities from 2000 to 2030 as we follow individuals Results through their lives to capture later deaths averted. Estimates of the impact of vaccination We also investigate the performance of the IE under the From 2000 to 2017, HepB, measles and YF have different YoV methods with no stratification, stratification by activ- vaccination activities in each of the countries. We anal- ity and cohort separately and in combination by applying yse the impact calculation methods for RV alone and in it to HepB, measles and YF in Countries A, B and C combination with CV. with updated coverage data. More specifically, for each Only RV exists for HepB; this is given as a birth of these pathogens, we update RI coverage from 1980 to dose (soon after birth) and as infant doses (
Echeverria-Londono et al. BMC Public Health   (2021) 21:2049                                                       Page 7 of 12

those over 40 years of age, we find that the birth year          published in 2018 (as described in Methods; change in
method captures a greater impact as it accrues the long-         FVPs shown in Figs. 2A and 3A). The accuracy of the
term benefits of vaccination over the lifetime of birth          IE projections is determined by comparing to model esti-
cohorts. With the calendar year method accruing the              mates given the same updated coverage. Vaccine impact,
impact for all ages over a particular year, this long-term       i.e. deaths averted, by year of vaccination and by year
impact is not captured (Fig. 1B). Prior to 2013, YF has rou-     of birth are visualised in Figs. 2 and 3, respectively, for
tine infant dose vaccinations (
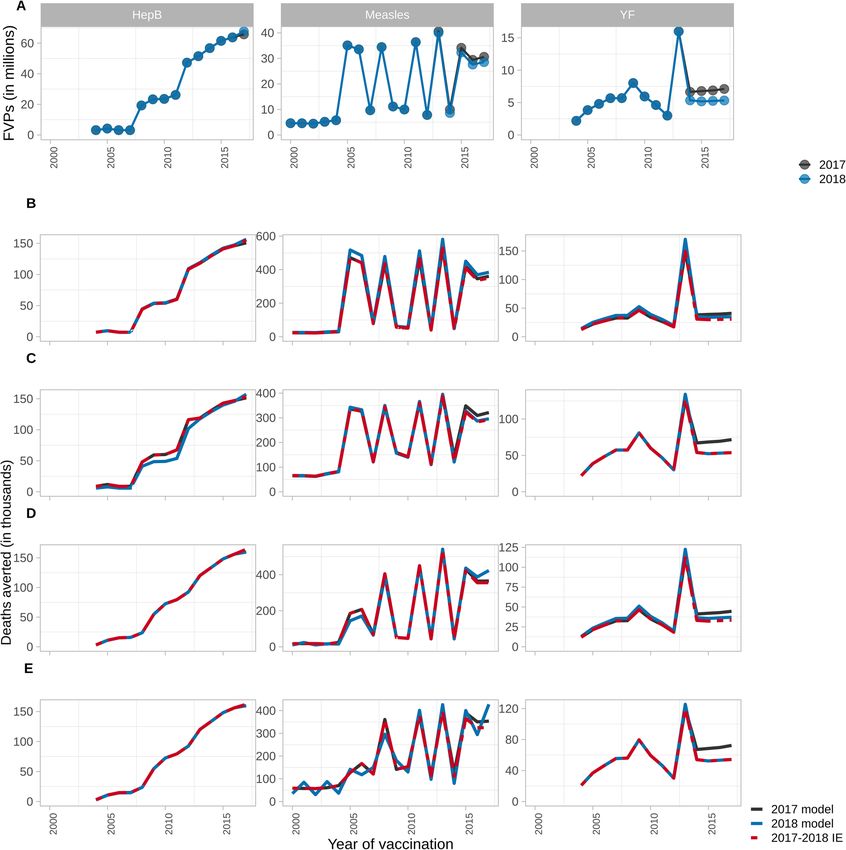
Echeverria-Londono et al. BMC Public Health          (2021) 21:2049                                                                             Page 8 of 12

 Fig. 2 Model estimates and impact extrapolation showing deaths averted by year of vaccination per year for hepatitis B (HepB) in Country A,
 measles in Country B and yellow fever (YF) in Country C from 2000 to 2017 using 2017 coverage (2017 model), 2018 coverage with corresponding
 model estimates (2018 model), and 2018 coverage with the impact extrapolation (2017–2018 IE). (A) Fully vaccinated persons (FVPs) in 2017 and
 2018. (B) Impact by year of vaccination with unstratified impact ratio. (C) Impact by year of vaccination with impact ratio stratified by activity type.
 (D) Impact by year of vaccination with impact ratio stratified by birth cohort. (E) Impact by year of vaccination with impact ratio stratified by activity
 type and birth cohort

impact ratio for RV is larger than the unstratified impact                      averted by year of vaccination and birth year under the
ratio which accounts for the fact that RV will almost                           updated coverage scenarios for measles and YF (Table 4;
always be given to unvaccinated infants, as opposed to CV                       Figs. 2D and 3D). Although the 2018 coverage scenarios
which, as dose distribution is assumed to be random, may                        generally have higher coverage post-2020, the coverage
revaccinate individuals who are already immune.                                 drops prior to 2020 for measles and YF but for HepB it
  Using the birth cohort stratification, the IE performs                        improves slightly (Figs. 2A and 3A). As the birth cohort
well for HepB but underestimates the number of deaths                           stratification captures greater yearly variation, it does well
Echeverria-Londono et al. BMC Public Health          (2021) 21:2049                                                                              Page 9 of 12

 Fig. 3 Model estimates and impact extrapolation showing deaths averted by year of vaccination per birth year for hepatitis B (HepB) in Country A,
 measles in Country B and yellow fever (YF) in Country C from 2000 to 2017 using 2017 coverage (2017 model), 2018 coverage with corresponding
 model estimates (2018 model), and 2018 coverage with the impact extrapolation (2017–2018 IE). (A) Fully vaccinated persons (FVPs) in 2017 and
 2018. (B) Impact by year of birth with unstratified impact ratio. (C) Impact by year of birth with impact ratio stratified by activity type. (D) Impact by
 year of birth with impact ratio stratified by birth cohort. (E) Impact by year of birth with impact ratio stratified by activity type and birth cohort

for the smaller change in HepB coverage and shows a cor-                         given to a susceptible child whereas campaigns may vac-
responding decline in impact for measles and YF as it                            cinate individuals who have already been vaccinated, thus
is more sensitive to changes in coverage than the activ-                         non-intuitively having a smaller impact.
ity stratification. This captures a limitation of the birth                        Implementing the IE when stratifying by both activity
cohort stratification as it assumes the impact from RV                           and birth cohort results in the IE being sensitive to a com-
and CV will be similar when they could be distinctively                          bination of factors that affect the activity and birth cohort
affected by dose wastage i.e. a RV will almost always be                         stratifications, such as the type of activities occurring,
Echeverria-Londono et al. BMC Public Health              (2021) 21:2049                                                                                  Page 10 of 12

Table 4 Relative total difference of impact extrapolation (IE) to model estimates for deaths averted over 2000–2017 (%) by year of
vaccination (YoV) and year of birth (YoB) due to vaccination activities for hepatitis B (HepB) in Country A, measles in Country B and
yellow fever (YF) in Country C
Disease and deaths                   No stratification                    Activity type                     Birth cohort                      Activity type and birth
averted by YoV/YoB                                                        stratification                    stratification                    cohort stratification
HepB- YoV                            -0.86                                7.24                              0.40                              0.30
HepB- YoB                            -4.12                                -0.35                             0.40                              0.04
Measles- YoV                         -8.90                                -0.76                             -0.02                             -0.81
Measles- YoB                         -0.51                                -4.04                             -4.34                             -4.10
YF- YoV                              -12.16                               -0.84                             -8.80                             -0.67
YF- YoB                              -10.37                               -7.41                             -8.62                             -4.66
Impact estimated by the year of vaccination stratification methods as shown in Figs. 2-3. Negative numbers correspond to the IE underestimating and positive numbers
correspond to the IE overestimating the number of deaths averted over 2000–2017

underlying model dynamics and yearly coverage changes.                                 vaccination activities vary in who is targeted and when,
For measles and YF, this stratification captures a decline                             the estimation of impact becomes complex.
in coverage prior to 2020 which does not occur for                                       The two impact by YoV methods differ not in when
HepB. Additionally it captures any herd protection arising                             they attribute impact but in the assumptions around how
from post-2020 coverage improvements to varying extents                                the effect of vaccination may change over time or by
(seen more for HepB than measles because of differing age                              delivery method. The birth cohort stratification accounts
dynamics; Table 4; Figs. 2E and 3E).                                                   for changes in transmission and healthcare over time,
   When determining the accuracy of the IE, it is useful to                            allowing the impact of vaccination to be adjusted given
look at both the relative total difference in deaths averted                           improvements in other interventions such as treatment or
over 2000–2017 between the IE and model estimates                                      the effects of climate change on vector-borne diseases as
(Table 4), and the difference across each year (Figs. 2 and                            seen for YF [21, 22]. The issue with this method is that it
3). Some of the under- and over-estimation of the IE that                              may be sensitive to the introduction of RV or CV as these
is seen across the years can cancel out when looking at the                            dictate the vaccination experience of cohorts to come, for
aggregated difference over the whole time period. As such,                             example, a birth cohort born the year after a mass vacci-
the IE performs well when looking at the total difference                              nation campaign should be well protected by the popu-
for no stratification viewed by year of birth for measles,                             lation vaccinated in that campaign. This characteristic is
the activity stratification viewed by year of birth for HepB                           a strength in that it accounts for herd effects. However,
and the birth cohort stratification viewed by year of vacci-                           the denominator for this method does not include vacci-
nation for measles (Table 4). However, when focusing on                                nations given to birth cohorts vaccinated outside the year
the difference in a specific year, the IE is seen to under-                            of interest that might have an indirect (herd) effect on the
and over-estimate in certain years (Figs. 2D, 3B and C).                               birth cohort of interest. Furthermore, as the vaccination
                                                                                       coverage, implementation and, arguably, demography are
Discussion                                                                             all subject to high degrees of uncertainty, this characteris-
We have presented the main methods used by VIMC to                                     tic will also exacerbate any inaccuracies.
estimate vaccine impact (summarised in Table 3). We also                                 The most accurate way to capture herd effects would
have shown how these methods perform when provid-                                      be to repeatedly run the underlying mathematical mod-
ing an IE. Each of the methods differ and the appropriate                              els incrementally, i.e. starting with the baseline and adding
method will depend on the perspective of interest.                                     vaccination of a single birth cohort, year and activity type
  The vaccine impact methods primarily differ by                                       with each iteration. This has the advantage of correctly
how they attribute impact. The calendar year method                                    attributing the full indirect impact of each additional set
attributes impact to the year examined irrespective of                                 of vaccinations to the whole population. The disadvantage
which age groups are targeted and when the vaccina-                                    of this method is that it is computationally expensive.
tion occurred. In contrast, impact by birth year attributes                              Overall, in our examples, we have shown that the IE
impact to the birth cohorts of interest, irrespective of                               works well and is an effective tool to update vaccine
when the vaccination occurred over their lifespan. When                                impact. Notably, the activity stratification is accurate for
only RV occurs in the first year of life, the impact by YoV                            static models with dose dependency but may overesti-
and impact by birth year will be similar. However, when                                mate the impact of coverage improvements when dynamic
Echeverria-Londono et al. BMC Public Health (2021) 21:2049 Page 11 of 12
herd protection is included. The birth cohort stratifica- healthcare clustering which has been shown to be influ-
tion may underestimate impact if coverage declines before ential [3, 23]. An extension would be to account for the
improving in later years. potential of re-vaccinating the same individuals each time,
Caution needs to be taken when deciding the appro- a method that could highlight and identify groups of zero-
priateness of implementing an IE. In cases where cov- dose children and health equity [24]. Similarly, the current
erage is reduced drastically or an activity is delayed, if activity stratification allows us to further explore ques-
the pathogen poses a risk of outbreaks and the model is tions around vaccine delivery and health access. Finally,
dynamic, the IE may not be accurate as it may miss cap- the results shown are presented nationally, whereas RV
turing the impact of any outbreaks that may occur during and CV may be delivered sub-nationally and the disease
this period. With larger delays to activities, the risks of the transmission and health access may be spatially hetero-
IE not capturing such outbreaks would rise. Additionally, geneous especially for large countries. As such, the next
if a follow-up activity cannot reach the individuals missed, steps will be to examine the sensitivity to these national
using the IE may not be accurate. In such cases, new model assumptions and account for the spatial heterogeneity in
runs would be required to provide updated estimates of vaccine impact.
vaccine impact. Whilst vaccination is one of the most effective interven-
For computational and time efficiency, the IE is used by tions against infectious diseases, the specific implementa-
the VIMC to approximate the impact of vaccination given tion of vaccination requires substantial planning, support
a new scenario around FVPs relative to the one modelled. and financing. Calculating the public health impact of
This means that uncertainties in the modelling process are vaccination and understanding the different methods for
propagated into the IE. The update was developed in order doing so is vital. We have presented multiple methods to
to provide estimates on a short timescale given the latest express the complex effects of vaccination which will con-
available demographic and vaccination data. We show that tinue to be developed for ever increasing questions around
impact by YoV methods perform well in many situations optimal vaccine use.
and given updates in coverage, each stratification would
Acknowledgements
be appropriate for their related insights. However, there Not applicable.
are limitations to the IE, particularly for diseases that pose
a risk of outbreaks and that are modelled dynamically, if Authors’ contributions
XL, TG, NMF developed the methods; SEL, XL, JT, KAMG, TG conducted the
there are drastic changes to activities (e.g. coverage drops analyses; SEL, XL, JT, KAMG, TG analysed the results; JT, SEL, XL, KAMG wrote
or delays to activities) as the IE may not account for rises the first draft; MJdV, SN, TBH modelled hepatitis B; KA, MJ modelled measles;
in case numbers during such periods. A careful choice TG, KAMG, KJ modelled yellow fever. All authors edited and reviewed the
manuscript. The author(s) read and approved the final manuscript.
of the impact ratio informed by the natural history of
the disease, individual vaccination strategy and modelling Funding
approach is needed to provide an effective extrapolation. We thank Gavi, the Vaccine Alliance and the Bill & Melinda Gates Foundation
for funding VIMC (BMGF grant number: OPP1157270 / INV-009125). Under the
The impact we show is measured primarily through grant conditions of the Foundation, a Creative Commons Attribution 4.0
mortality; however, there are far reaching benefits of vac- Generic License has already been assigned to the Author Accepted
cination including reduction in morbidity as well is reduc- Manuscript version that might arise from this submission. SEL, XL, JT, KW, TG,
NMF, KAMG also acknowledge funding from the MRC Centre for Global
ing pressure on health care services shown. The VIMC Infectious Disease Analysis (reference MR/R015600/1), which is jointly funded
uses the methods shown here in a similar manner for cases by the UK Medical Research Council (MRC) and the UK Foreign,
and DALYs (disability adjust life-years); deaths are pre- Commonwealth & Development Office (FCDO), under the MRC/FCDO
Concordat agreement and is also part of the EDCTP2 programme supported
sented as there is a more widely accepted, and comparable, by the European Union; and acknowledge funding by Community Jameel.
definition of this outcome. Whilst the methods of mod-
elling and impact calculation provide an indication of the Availability of data and materials
The materials supporting the conclusions of this article are available through
benefits of vaccination, they are limited to very specific the R package vimpact on GitHub (https://github.com/vimc/vimpact) [20].
research questions and outcomes. As such, they cannot
replace wider surveys and alternative modelling efforts
to examine the broader benefits of vaccination such as Declarations
economic, equity and healthcare improvements. Ethics approval and consent to participate
The methods shown have their strengths but are also Not applicable.
limited in certain ways, and as further research ques-
Consent for publication
tions develop, new methods for calculating vaccine impact Not applicable.
will need to be created. Though the YoV methods cap-
ture changes over time due to healthcare or transmission Competing interests
This publication is authored by members of the Vaccine Impact Modelling
variation and the different effects of vaccination activ- Consortium (VIMC, www.vaccineimpact.org). VIMC is jointly funded by Gavi,
ity, they do not capture issues around vaccination and the Vaccine Alliance, and by the Bill & Melinda Gates Foundation. The viewsEcheverria-Londono et al. BMC Public Health (2021) 21:2049 Page 12 of 12
expressed are those of the authors and not necessarily those of the Consortium 15. Li X, Mukandavire C, Cucunubá ZM, Londono SE, Abbas K, Clapham HE,
or its funders. The funders were given the opportunity to review this paper Jit M, Johnson HL, Papadopoulos T, Vynnycky E, Brisson M. Estimating
prior to publication, but the final decision on the content of the publication the health impact of vaccination against ten pathogens in 98 low-income
was taken by the authors. Consortium members received funding from Gavi and middle-income countries from 2000 to 2030 : a modelling study. The
and BMGF via VIMC during the course of the study (see funding statement). Lancet. 2021;397(10272):398–408.
16. Nayagam S, Thursz M, Sicuri E, Conteh L, Wiktor S, Low-Beer D, Hallett
Author details TB. Requirements for global elimination of hepatitis B: a modelling study.
1 MRC Centre for Global Infectious Disease Analysis, Jameel Institute, School of Lancet Infect Dis. 2016;16(12):1399–408. https://doi.org/10.1016/S1473-
Public Health, Imperial College London, London, UK. 2 Department of 3099(16)30204-3. Accessed 06 Oct 2020.
Infectious Disease Epidemiology, London School of Hygiene & Tropical 17. Verguet S, Johri M, Morris SK, Gauvreau CL, Jha P, Jit M. Controlling
Medicine, WC1E 7HT London, UK. 3 Laboratoire MESuRS, Conservatoire measles using supplemental immunization activities: a mathematical
national des Arts et Métiers, Paris, France. 4 Unité PACRI, Institut Pasteur, model to inform optimal policy. Vaccine. 2015;33(10):1291–6. https://doi.
Conservatoire national des Arts et Métiers, Paris, France. org/10.1016/j.vaccine.2014.11.050. Accessed 06 Oct 2020.
18. Garske T, Van Kerkhove MD, Yactayo S, Ronveaux O, Lewis RF, Staples
Received: 27 July 2021 Accepted: 19 October 2021 JE, Perea W, Ferguson NM, Committee YFE. Yellow fever in Africa:
estimating the burden of disease and impact of mass vaccination from
outbreak and serological data. PLoS Med. 2014;11(5):1001638. https://doi.
org/10.1371/journal.pmed.1001638. Accessed 06 Oct 2020.
References
19. World Population Prospects - Population Division - United Nations. 2021.
1. World Health Organization. Immunization Agenda 2030: a global strategy
Retrieved 28 October 2021, from https://population.un.org/wpp/.
to leave no one behind. Geneva: WHO; 2020. https://www.who.int/
20. R Core Team. R: A Language and Environment for Statistical Computing.
publications/m/item/immunization-agenda-2030-a-global-strategy-to-
Vienna, Austria: R Foundation for Statistical Computing; 2020. https://
leave-no-one-behind.
www.R-project.org/.
2. Greenwood B. The contribution of vaccination to global health: past,
21. World Health Organization. Climate change and human health : risks and
present and future. Philos Trans R Soc B Biol Sci. 2014;369(1645):
responses : summary: World Health Organization; 2003. https://apps.who.
20130433. https://doi.org/10.1098/rstb.2013.0433. Accessed 02 Feb 2020.
int/iris/handle/10665/42749.
3. McKee A, Ferrari MJ, Shea K. Correlation between measles vaccine doses:
22. Gaythorpe KA, Hamlet A, Jean K, Ramos DG, Cibrelus L, Garske T,
implications for the maintenance of elimination. Epidemiol Infect.
Ferguson N. The global burden of yellow fever. Elife. 2021;10:e64670.
2018;146(4):468–75. https://doi.org/10.1017/S0950268817003077.
23. Truelove SA, Graham M, Moss WJ, Metcalf CJE, Ferrari MJ, Lessler J.
Accessed 22 July 2020.
Characterizing the impact of spatial clustering of susceptibility for
4. Andre FE, Booy R, Bock HL, Clemens J, Datta SK, John TJ, Lee BW,
measles elimination. Vaccine. 2019;37(5):732–41. https://doi.org/10.1016/
Lolekha S, Peltola H, Ruff TA, Santosham M, Schmitt HJ. Vaccination
j.vaccine.2018.12.012. Accessed 22 July 2020.
greatly reduces disease, disability, death and inequity worldwide. Bull
24. Portnoy A, Jit M, Helleringer S, Verguet S. Impact of measles
World Health Organ. 2008;86(2):140–6. https://doi.org/10.2471/blt.07.
supplementary immunization activities on reaching children missed by
040089. Accessed 28 April 2017.
routine programs. Vaccine. 2018;36(1):170–8. https://doi.org/10.1016/j.
5. Pezzotti P, Bellino S, Prestinaci F, Iacchini S, Lucaroni F, Camoni L,
vaccine.2017.10.080. Accessed 22 July 2020.
Barbieri MM, Ricciardi W, Stefanelli P, Rezza G. The impact of
immunization programs on 10 vaccine preventable diseases in Italy:
1900-2015. Vaccine. 2018;36(11):1435–43. https://doi.org/10.1016/j. Publisher’s Note
vaccine.2018.01.065. Accessed 22 July 2020. Springer Nature remains neutral with regard to jurisdictional claims in
6. Doherty M, Buchy P, Standaert B, Giaquinto C, Prado-Cohrs D. Vaccine published maps and institutional affiliations.
impact: Benefits for human health. Vaccine. 2016;34(52):6707–14. https://
doi.org/10.1016/j.vaccine.2016.10.025. Accessed 24 June 2020.
7. Restrepo-Méndez MC, Barros AJ, Wong KL, Johnson HL, Pariyo G,
França GV, Wehrmeister FC, Victora CG. Inequalities in full immunization
coverage: trends in low- and middle-income countries. Bull World Health
Organ. 2016;94(11):794–805. https://doi.org/10.2471/BLT.15.
162172. Accessed 06 Oct 2020.
8. Scherer A, McLean A. Mathematical models of vaccination. Br Med Bull.
2002;62:187–99. https://doi.org/10.1093/bmb/62.1.187. Accessed 06 Oct
2020.
9. Vaccine Impact Modelling Consortium. 2021. Retrieved 28 October 2021,
from https://www.vaccineimpact.org/.
10. MacIntyre CR, Leask J. Immunization myths and realities: responding to
arguments against immunization. J Paediatr Child Health. 2003;39(7):
487–91. https://doi.org/10.1046/j.1440-1754.2003.t01-1-00200.
x. Accessed 06 Oct 2020.
11. Quan TM, Thao TTN, Duy NM, Nhat TM, Clapham H. Estimates of the
global burden of Japanese encephalitis and the impact of vaccination
from 2000-2015. Elife. 2020;9:e51027.
12. Zerhouni E. GAVI, the vaccine alliance. Cell. 2019;179(1):13–7. https://doi.
org/10.1016/j.cell.2019.08.026. Accessed 06 Oct 2020.
13. WHO UNICEF coverage estimates WHO World Health Organization:
Immunization, Vaccines And Biologicals. Vaccine preventable diseases
Vaccines monitoring system 2020 Global Summary Reference Time
Series: DTP3. 2021. Retrieved 28 October 2021, from https://apps.who.int/
immunization_monitoring/globalsummary/timeseries/
tswucoveragedtp3.html.
14. Vaccine demand forecasting. 2021. Retrieved 28 October 2021, from
https://www.gavi.org/our-alliance/market-shaping/vaccine-demand-
forecasting.You can also read