2021 Full-Year Result - Sanoma
←
→
Page content transcription
If your browser does not render page correctly, please read the page content below
Full-Year Result

2021

Sanoma Corporation
P.O.Box 60, 00089 Sanoma, Finland
www.sanoma.com
ID 1524361-1
Full-Year Result 2021                                                                                                       2

SANOMA CORPORATION, FULL-YEAR RESULT 2021

Strong growth in net sales and
operational EBIT in both businesses
Q4 2021
 ◼    The Group’s net sales grew to EUR 252 million (2020: 227) driven by the acquisition of Santillana as well as strong
      organic growth especially in Learning. The Group’s comparable net sales growth was 6% (2020: 1%).
 ◼    Operational EBIT excl. PPA was negative driven by the typical quarterly pattern in the growing Learning business
      and amounted to EUR -5 million (2020: -2).
 ◼    EBIT was EUR -19 million (2020: -23). Items affecting comparability (IACs) were EUR -5 million (2020: -16).
      Purchase price allocation adjustments and amortisations (PPAs) increased to EUR 8 million (2020: 6) as a result of
      the Santillana acquisition.
 ◼    Operational EPS was EUR -0.06 (2020: -0.06) and EUR -0.07 (2020: -0.07) including discontinued operations.
 ◼    EPS was EUR -0.09 (2020: -0.14) and EUR -0.09 (2020: -0.16) including discontinued operations.
 ◼    On 21 December, Sanoma announced that Alex Green has been appointed CFO of Sanoma as of 1 March 2022.

FY 2021
 ◼    The Group’s net sales grew by 18% to EUR 1,252 million (2020: 1,062). Net sales grew in both businesses both
      organically and through acquisitions. The Group’s comparable net sales growth was 7% (2020: -4%).
 ◼    Operational EBIT excl. PPA grew by 26% to EUR 197 million (2020: 157), corresponding to a margin of 15.8%
      (2020: 14.7%). The improvement was driven by solid net sales growth in both Learning and Media Finland.
 ◼    EBIT was EUR 142 million (2020: 270). IACs totalled EUR -16 million (2020: 136). In 2020, the EBIT and IACs
      included a capital gain of EUR 165 million related to the divestment of Oikotie online classified business. PPAs
      increased to EUR 39 million (2020: 22) as a result of the Santillana and regional news media business acquisitions.
 ◼    Operational EPS increased to EUR 0.69 (2020: 0.58). Operational EPS including discontinued operations was
      EUR 0.69 (2020: 0.67).
 ◼    EPS was EUR 0.62 (2020: 1.46) and EUR 0.61 (2020: 1.51) including discontinued operations.
 ◼    Free cash flow improved significantly to EUR 140 million (2020: 95), mainly driven by strong net sales and related
      EBITDA growth as well as solid contribution from Santillana.
 ◼    Net debt/Adj. EBITDA decreased to 2.4 (2020: 2.6), well below the long-term leverage target of
Full-Year Result 2021 3 Alternative performance measures and discontinued operations Sanoma presents certain financial performance measures on a non-IFRS basis as alternative performance measures (APMs). The APMs exclude certain non-operational or non-cash valuation items affecting comparability (IACs) and are provided to reflect the underlying business performance and to enhance comparability between reporting periods. The APMs should not be considered as a substitute for performance measures in accordance with IFRS. Unless otherwise stated, all income statement related quarterly and FY figures presented in this report cover continuing operations only. Figures related to balance sheet and cash flow cover both continuing and discontinued operations. Media Netherlands is reported as discontinued operations until the completion of the divestment on 20 April 2020. In addition, certain Learning operations that are under strategic review are reported as discontinued operations for 2020 and 2021. Sanoma’s continuing operations include Learning and Media Finland, which are also Sanoma’s reporting segments. Definitions of key IFRS indicators and APMs are available on p. 39. Reconciliations are available on p. 19–20. More information on discontinued operations is available on p. 36–37.
Full-Year Result 2021                                                                                                                                  4

Key indicators for continuing operations

 EUR million                                                       Q4 2021       Q4 2020        Change       FY 2021       FY 2020       Change

 Net sales                                                             252.4         227.3          11%       1,251.6       1,061.7              18%

 Operational EBITDA 1)                                                   42.1         43.4           -3%         361.0         309.9             16%

     Margin 1)                                                        16.7%         19.1%                       28.8%         29.2%

 Operational EBIT excl. PPA 2)                                           -5.2          -1.5       -255%          197.2         156.5             26%

     Margin 2)                                                         -2.1%         -0.6%                      15.8%         14.7%

 EBIT                                                                   -18.5         -22.7         19%          142.4         270.1         -47%

 Result for the period                                                  -13.9         -23.5         41%          101.4         237.8         -57%

 Operational EPS, EUR 1)                                                -0.06         -0.06          -2%          0.69          0.58             19%

 EPS, EUR                                                               -0.09         -0.14         36%           0.62          1.46         -58%

 Average number of employees (FTE)                                                                               4,885         4,255             15%
 Number of employees at the end of the period (FTE)                                                              4,822         4,806             0%

Key indicators incl. continuing and discontinued operations 3)

 EUR million                                                       Q4 2021       Q4 2020        Change       FY 2021       FY 2020       Change

 Result for the period                                                  -14.0         -26.9         48%          101.2         247.1         -59%

 Free cash flow                                                          55.2          30.4         82%          139.7          94.8             47%

 Equity ratio 4)                                                                                                40.6%         37.4%

 Net debt                                                                                                        616.4         660.7             -7%

 Net debt / Adj. EBITDA                                                                                             2.4           2.6            -8%

 Operational EPS, EUR 1)                                                -0.07         -0.07           2%          0.69          0.67             4%

 EPS, EUR                                                               -0.09         -0.16         44%           0.61          1.51         -59%

 Free cash flow per share, EUR                                           0.34          0.19         82%           0.86          0.58             47%

 Dividend per share, EUR 5)                                                                                       0.54          0.52             4%
1)
   Excluding IACs
2) Excluding IACs and purchase price allocation adjustments and amortisations (PPAs)
3)
   In 2021, discontinued operations include certain Learning operations that are under strategic review. In 2020, discontinued operations also
included Sanoma Media Netherlands. More information on discontinued operations’ financial performance is available on p. 36–37.
4)
   Advances received included in the formula of equity ratio were EUR 155.2 million in 2021 (2020: 152.3).
5) 2021 is a proposal of the Board of Directors.
Full-Year Result 2021 5 President and CEO Susan Duinhoven: ”2021 was another successful year for Sanoma. The Group’s net sales grew by 18%, operational EBIT excluding PPA even more strongly by 26% and free cash flow by 47%, or EUR 45 million. I am particularly encouraged by the strong organic growth of 7% in both Learning and Media Finland, which proves that our focus on the customers, the digitalisation of our offering and our increased scale are successful contributors to our organic growth and improved profitability. I would like to thank all our teams for the work well done under the challenging conditions that we have experienced during 2021. Having seen how agile and flexible our teams are, I am confident that we can again adapt and capture the positives of the ‘better normal’ in the times ahead. In Learning, 2021 was a year of strong net sales and profitability growth, resulting both from the organic growth across the businesses and the acquisition of Santillana in Spain. The integration of Santillana has progressed according to our plan and its first year as a Sanoma company was successful. The Santillana team is well prepared for the educational reform in 2022−23, although its pace and phasing continue to be partially uncertain, as the local authorities in the Spanish provinces have not yet concluded their decision taking. In 2021, majority of the organic growth in Learning resulted from Poland, where it was the last implementation year of the latest curriculum renewal, and the Netherlands, where demand was amplified by higher public spending on education, increasing share of subscriptions as well as an increase in market share. In Media Finland, organic growth was strong. It was driven by advertising rebound from the 2020 decline caused by the coronavirus pandemic as well as the reopened opportunity to organise some events during the summer. The number of subscriptions to both Helsingin Sanomat and Ruutu+ continued to grow, even though we saw signs of the strong corona- driven subscription growth normalising towards the end of the year. Digital advertising growth accelerated during the year, and we expect this to continue also in the coming year. We are quite pleased that our large, fast-growing digital advertising base was already offsetting the decline in print advertising, which all-in-all amounted to only approx. EUR 60 million of net sales. Strong net sales growth also supported earnings growth, and profitability improved slightly. In 2022, we expect another strong year with the Group’s reported net sales at EUR 1.25−1.30 billion (2021: 1.25) and operational EBIT margin excl. PPA 15−16% (2021: 15.8%). In Learning, we expect strong curriculum driven sales growth in Spain during 2022−2023. In Poland, we foresee after years of strong growth a significant market decline in 2022 ahead of the next curriculum renewal in 2023. In Media Finland the advertising sales are expected to show continued strength driven by digital, which is already exceeding the share of the declining print advertising. During the year, we will continue to develop our digital platforms and adapt our offices to the new ways of working both in Learning and Media Finland. We expect to see a temporary margin impact due to increasing paper and printing costs. We have a strong pipeline of acquisition opportunities that we continue to work on and develop further. Our long-term targets are unchanged: 2−5% organic growth in Learning and +/-2% in Media Finland, and above 23% operational EBIT margin excl. PPA in Learning and 12−14% in Media Finland. In 2021 we clarified and communicated our Sustainability Strategy and have been very encouraged to see how strongly it resonates with our employees, customers, suppliers and investors. The more structured approach and improved transparency in our sustainability reporting increased our ESG ratings significantly and can attract new impact and ESG investors on both equity and debt sides. We are very pleased that the positive impact our learning and media businesses have on society is now more clearly reflected in our ESG ratings. After a successful year 2021, the Board proposes an increased dividend of EUR 0.54 (2020: 0.52), corresponding to a yield of 4% and in line with our policy of paying a growing dividend. We are also in good positions and eager to continue to grow Sanoma further. Our focus will be in growing our K12 learning business both organically and through M&A, for which we have a solid balance sheet. In our Finnish media business, we will continue the successful digitalisation in our three strategic strongholds − news & feature, entertainment and B2B marketing solutions.’’
Full-Year Result 2021                                                                                                            6

Financial review Q4 2021
Net sales by SBU

EUR million                                                                         Q4 2021         Q4 2020          Change

Learning                                                                                 88.5            66.6            33%

Media Finland                                                                          164.1           160.8              2%

Other operations                                                                         -0.1            -0.1           -33%

Group total                                                                            252.4           227.3             11%

The Group’s net sales grew to EUR 252 million (2020: 227). In Learning, net sales grew driven by the acquisition of Santillana
and strong organic growth particularly in the Netherlands and Poland. In Media Finland, net sales growth was mainly driven
by higher advertising sales. Group’s comparable net sales growth was 6% (2020: 1%).

Operational EBIT excl. PPA by SBU

EUR million                                                                         Q4 2021         Q4 2020          Change

Learning                                                                                -20.6           -17.8           -16%

Media Finland                                                                            19.1            17.3            11%

Other operations                                                                         -3.8            -1.0          -291%

Group total                                                                              -5.2            -1.5          -255%

Operational EBIT excl. PPA declined slightly and amounted to EUR -5 million (2020: -2). In Learning, earnings were negative
according to their typical quarterly pattern which is amplified as the business grows. Earnings improved in Media Finland in
relation to growth of the B2B sales in particular. In Other operations, personnel costs, in particular, increased compared to
lower bonus provisions and Finnish pension payments in the previous year.

IACs, PPAs and reconciliation of operational EBIT

EUR million                                                                                         Q4 2021          Q4 2020
EBIT                                                                                                    -18.5           -22.7
Items affecting comparability (IACs)
Restructuring expenses                                                                                   -3.8           -14.9
Impairments                                                                                              -1.8             -0.6
Capital gains/losses                                                                                      0.8             0.0
IACs total                                                                                               -4.9           -15.5
Purchase price allocation adjustments and amortisations (PPAs)                                           -8.4             -5.7
Operational EBIT excl. PPA                                                                               -5.2             -1.5
A detailed reconciliation on SBU level is presented on p. 19.

EBIT was EUR -19 million (2020: -23). The IACs totalled EUR -5 million (2020: -16) and consisted of costs related to strategic
business development, integration of recent acquisitions and impairments. The capital gain is related to selling of minor
properties and land in Finland. PPAs increased to EUR 8 million (2020: 6) mainly due to the acquisition of Santillana.

Net financial items were positive EUR 1 million (2020: -2) due to a change in fair value of a liability related to an earlier
acquisition in Learning.

Result before taxes grew to EUR -17 million (2020: -25). Income taxes were EUR 3 million (2020: 1). Result for the period
was EUR -14 million (2020: -24) and EUR -14 million (2020: -27) including discontinued operations.

Operational earnings per share were EUR -0.06 (2020: -0.06) and EUR -0.07 (2020: -0.07) including discontinued
operations. Earnings per share were EUR -0.09 (2020: -0.14) and EUR -0.09 (2020: -0.16) including discontinued
operations.
Full-Year Result 2021                                                                                                                 7

Financial review FY 2021
Net sales by SBU

EUR million                                                                             FY 2021         FY 2020          Change

Learning                                                                                   637.3            499.7            28%

Media Finland                                                                              615.3            562.6              9%

Other operations                                                                             -0.9            -0.5            -76%

Group total                                                                              1,251.6          1,061.7            18%

The Group’s net sales increased by 18% to EUR 1,252 million (2020: 1,062) driven by good growth in both businesses. In
Learning, growth resulting from the acquisition of Santillana was supported by strong comparable net sales growth of 7%
(2020: 5%). Net sales of Media Finland grew as a result of the acquisition of the regional news media business as well as
recovery of advertising sales, increase in subscription sales and partial recovery of the events business. Organic growth
was strong in both businesses and the Group’s comparable net sales growth was 7% (2020: -4%).

Operational EBIT excl. PPA by SBU

EUR million                                                                             FY 2021         FY 2020          Change

Learning                                                                                   133.9             95.9            40%

Media Finland                                                                               73.5             66.6            10%

Other operations                                                                           -10.2             -5.9            -73%

Group total                                                                                197.2            156.5            26%

Operational EBIT excl. PPA improved by 26% to EUR 197 million (2020: 157). The improvement was mainly driven by
acquisitions and solid organic net sales growth in both businesses. In Other operations, personnel costs, in particular,
increased compared to lower bonus provisions and Finnish pension payments in the previous year.

IACs, PPAs and reconciliation of operational EBIT

EUR million                                                                                              FY 2021         FY 2020
EBIT                                                                                                        142.4           270.1
Items affecting comparability (IACs)
Restructuring expenses                                                                                      -15.2            -28.5
Impairments                                                                                                   -4.3            -0.6
Capital gains/losses                                                                                          3.7           165.0
IACs total                                                                                                  -15.8           135.9
Purchase price allocation adjustments and amortisations (PPAs)                                              -39.0            -22.3
Operational EBIT excl. PPA                                                                                  197.2           156.5
A detailed reconciliation on SBU level is presented on p. 19.

EBIT was EUR 142 million (2020: 270). The IACs totalled EUR -16 million (2020: 136) and consisted largely of integration
costs related to recent acquisitions, strategic business development costs and impairments related to discontinuation of a
minor business line in Learning. In 2020, the EBIT and IACs included a capital gain of EUR 165 million related to the
divestment of Oikotie online classified business. PPAs increased to EUR 39 million (2020: 22) due to the acquisitions of
Santillana and the regional news media business.

Net financial items were stable at EUR -9 million (2020: -9). The impact of a somewhat higher average interest rate of 1.1%
(2020: 0.8%) and higher average external debt was offset by a change in fair value of a liability related to an earlier acquisition
in Learning, booked in the fourth quarter.
Full-Year Result 2021                                                                                                           8

Result before taxes was EUR 134 million (2020: 261). In the comparison period, the result included the capital gain of the
Oikotie divestment. Income taxes increased to EUR 32 million (2020: 23) as a result of higher earnings. Result for the period
was EUR 101 million (2020: 238) and EUR 101 million (2020: 247) including discontinued operations.

Operational earnings per share were EUR 0.69 (2020: 0.58) and EUR 0.69 (2020: 0.67) including discontinued operations.
Earnings per share were EUR 0.62 (2020: 1.46) and EUR 0.61 (2020: 1.51) including discontinued operations.

Financial position
At the end of December 2021, interest-bearing net debt was EUR 616 million (2020: 661) and net debt to adjusted EBITDA
ratio 2.4 (2020: 2.6). Both net debt and leverage decreased thanks to solid profitability and free cash flow development.
Equity ratio was 40.6% (2020: 37.4%).

At the end of December 2021, the Group’s equity totalled EUR 721 million (2020: 710) and the consolidated balance sheet
amounted to EUR 1,933 million (2020: 2,048).

Cash flow
In 2021, the Group’s free cash flow improved significantly to EUR 140 million (2020: 95) or EUR 0.86 per share (2020: 0.58).
The improvement was mainly driven by higher profitability both in Learning and Media Finland as well as solid contribution
of the recently acquired Santillana in Spain, while taxes paid somewhat increased. The divestment of Media Netherlands
had a positive impact on the Group’s free cash flow as in the comparison period, the seasonally negative January–April free
cash flow of Media Netherlands was included in the Group’s free cash flow. Prepayment of the VAT claim related to
magazine distribution (more information under Events during the reporting period) had a negative impact on free cash flow.
For dividend calculation purposes, the Group’s free cash flow will be adjusted for the net impact of the VAT prepayment
amounting to EUR 21 million.

In 2021, capital expenditure included in the Group’s free cash flow amounted to EUR 42 million (2020: 43) and mainly
consisted of investments in digital platforms and ICT development in Learning.

Acquisitions and divestments
On 1 June 2021, Sanoma announced that it had acquired remaining minority shares of its festival and events business, thus
increasing its ownership in the festival and events company Nelonen Media Live Ltd. from 60% to 100%. The seller was the
founder of N.C.D. Production Ltd. of which Sanoma acquired a majority stake in 2018.

Information on  acquisitions   and   divestments    conducted            in    2020     and    earlier   is   available    at
www.sanoma.com/en/investors/sanoma-as-an-investment/.

Events during the reporting period
On 8 June 2021, Sanoma announced it will commit to the Science Based Targets initiative (SBTi) by setting emission
reduction targets aligned with the SBTi’s criteria. The commitment reinforces Sanoma’s climate target to reach net-zero
emissions across its value chain by 2030 as defined in its Sustainability Strategy.

On 27 May 2021, Sanoma announced it will further strengthen its sustainability commitments by becoming a signatory of
the United Nation’s Global Compact. Sanoma’s Code of Conduct already encompasses the Ten Principles of the UN Global
Compact on human rights, labour, environment and anti-corruption and its recently updated Sustainability Strategy is aligned
to support nine out of seventeen UN Sustainable Development Goals.

On 29 April 2021, Sanoma announced it had received a decision from the Finnish Tax Adjustment Board that they had
accepted a claim made by the Finnish Tax Ombudsman related to tax audits at Sanoma Media Finland Oy. The claim
concerned the treatment of value added tax (VAT) of certain magazines that were printed in multiple locations in Europe
and distributed through a centralised logistics centre in Norway in 2015–2018. Sanoma considers the claims completely
unjustified and has appealed the decisions. On 1 July, Sanoma has paid the required VAT, the related penalty and interests
of EUR 25 million (gross amount) in order to avoid further interest accumulation. Sanoma considers this payment to be a
deposit with the tax authority while the dispute is ongoing and consequently has reported the amount paid as a receivable.
For dividend calculation purposes, the Group’s free cash flow will be adjusted for the net impact of the prepayment.

On 11 March 2021, Sanoma announced that it had issued a senior unsecured bond of EUR 200 million. The 3-year bond
matures on 18 March 2024. It carries a fixed annual interest of 0.625% and has an issue price of 99.625% and a yield of
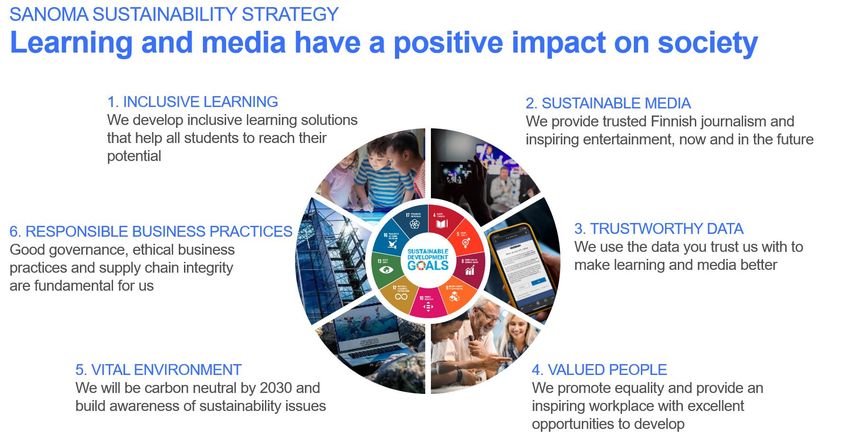
Full-Year Result 2021                                                                                                         9

0.752%. The offering was allocated to approx. 65 investors. The net proceeds from the issuance of the bond were used to
repay a EUR 200 million bridge loan drawn in connection with the acquisition of Santillana.

On 8 March 2021, Sanoma published its updated Sustainability Strategy to further strengthen sustainability in both the
learning and media businesses. The strategy focuses on six themes; Inclusive learning, Sustainable media, Trustworthy
data, Valued people, Vital environment and Responsible business practices; each having their own targets and KPIs. It is
designed to maximise Sanoma’s positive impacts on society and to minimise its environmental footprint. Sanoma has
integrated selected UN Sustainable Development Goals (SDGs) into the strategy. In 2021, sustainability targets will make
up 20% of Sanoma’s annual short-term management incentives on target level. The targets are related to achieving certain
data and privacy as well as employee engagement targets. Information on Sanoma’s performance in ESG ratings is available
on p. 14. Sanoma will publish a Sustainability Report 2021 as part of its Annual Report on week 9 (starting on 28 February
2022).

Events after the reporting period
On 3 January 2022, Sanoma Media Finland Oy sold its newspaper printing facility Savon Paino, located in Varkaus, Finland,
to media company Keskisuomalainen. 36 employees of Savon Paino were transferred to Keskisuomalainen with the
divestment. Printing of certain Sanoma products will continue at Savon Paino with long-term contracts. The transaction does
not have a material financial impact on the Group.
Full-Year Result 2021                                                                                                                        10

Learning
Sanoma Learning is the leading European learning company, serving over 20 million students in 11 countries. Our learning
products and services enable teachers to develop the talents of every child to reach their potential. We offer printed and
digital learning materials as well as digital learning and teaching platforms for K12, i.e. primary, secondary and vocational
education, and we aim to continue to grow our business. We develop our methodologies based on deep teacher and student
insight and truly understanding their individual needs. By combining our educational technologies and pedagogical
expertise, we create learning products and services with the highest learning impact.

Key indicators

 EUR million                                          Q4 2021       Q4 2020         Change         FY 2021        FY 2020         Change

 Net sales                                                88.5           66.6           33%           637.3           499.7           28%

 Operational EBITDA 1)                                      3.0           -1.0         412%           213.1           167.1           28%

 Operational EBIT excl. PPA 2)                            -20.6         -17.8          -16%           133.9            95.9           40%

      Margin 2)                                        -23.3%         -26.7%                          21.0%          19.2%

 EBIT                                                     -31.6         -32.2             2%            90.5           66.4           36%

 Capital expenditure                                        9.7            9.1            7%            33.7           32.6            3%
 Average number of employees (FTE)                                                                    2,599           1,987           31%
1)
 Excluding IACs
2)
 Excluding IACs of EUR -4.4 million in Q4 2021 (2020: -10.3) and EUR -11.1 million in FY 2021 (2020: -13.2) and PPA adjustments and
amortisations of EUR 6.6 million in Q4 2021 (2020: 4.0) and EUR 32.2 million in FY 2021 (2020: 16.2).
Full reconciliation of operational EBITDA and operational EBIT excl. PPA is presented in a separate table on p. 19.

Net sales by country

 EUR million                                          Q4 2021       Q4 2020         Change         FY 2021        FY 2020         Change

 The Netherlands                                          30.8           25.7           20%           210.9           199.8            6%

 Poland                                                   15.9           12.2           30%           127.6           112.5           13%

 Spain                                                    15.2             5.2         191%           119.0            17.1           594%

 Finland                                                    8.6            8.3            4%            57.5           52.9            9%

 Belgium                                                    8.0            4.9          64%             78.1           76.1            3%
                                        1)
 Other countries and eliminations                           9.9          10.3            -4%            44.1           41.2            7%

 Net sales total                                          88.5           66.6           33%           637.3           499.7           28%
1)   Other countries include Sweden, Norway, France, Germany, Denmark and the UK.

The learning business has, by its nature, an annual cycle with strong seasonality. Most net sales and earnings are accrued
during the second and third quarters, while the first and fourth quarters are typically smaller in net sales and loss-making.
The acquisition of Santillana will further increase the importance of the third quarter, when the new school year starts, for
the business. Shifts of single orders between quarters may have a material impact when comparing quarterly net sales and
earnings on a year-on-year basis, and therefore year-to-date figures typically provide a more comprehensive picture of
Learning’s business performance and development than quarterly figures. Review of FY 2021 is available on the next page.

Q4 2021
Net sales of Learning grew to EUR 89 million (2020: 67). Net sales of Santillana in Spain, acquired on 31 December 2020,
contributed EUR 12 million. Organic growth was strongest in the Netherlands and Poland.

According to its typical quarterly pattern which is amplified as the business grows, operational EBIT excl. PPA was negative
and declined slightly to EUR -21 million (2020: -18).

EBIT was EUR -32 million (2020: -32). IACs totalled EUR -4 million (2020: -10) and consisted of integration costs of the
Santillana acquisition and strategic business development costs. PPAs increased to EUR 7 million (2020: 4) as a result of
the acquisition of Santillana.
Full-Year Result 2021 11 Capital expenditure totalled EUR 10 million (2020: 9) and consisted of growth investments in digital platforms and ICT. FY 2021 Net sales of Learning grew by 28% and amounted to EUR 637 million (2020: 500). Net sales of Santillana contributed EUR 101 million. Learning material sales grew across all markets, growth being strongest in Poland and the Netherlands. In Poland, a curriculum renewal ending in the autumn 2021 amplified the sales and led to a further increase in market share. In the Netherlands, growth was driven by overall increased public spending on learning materials, and an increase in market share which was supported by shift to the subscription model. Sales of digital learning platforms also grew as a result of successful sales to new customers especially by itslearning in Germany. Learning’s comparable net sales growth was 7% (2020: 5%), well above the long-term target of 2–5%. Operational EBIT excl. PPA grew by 40% to EUR 134 million (2020: 96), corresponding to an improved margin of 21.0% (2020: 19.2%). Most of the earnings improvement resulted from the recently acquired Santillana business. Strong organic net sales complemented the positive impact on earnings. EBIT increased to EUR 91 million (2020: 66) as a result of the improved operational EBIT and lower IACs. IACs totalled EUR -11 million (2020: -13) and consisted of integration costs of the Santillana acquisition, impairments related to discontinuation of a minor business line and strategic business development costs. PPAs increased to EUR 32 million (2020: 16) as a result of the acquisition of Santillana. Capital expenditure totalled EUR 34 million (2020: 33) and consisted of growth investments in digital platforms and ICT.
Full-Year Result 2021                                                                                                                            12

Media Finland
Media Finland is the leading media company in Finland, reaching 97% of all Finns weekly. We provide information,
experiences, inspiration and entertainment through multiple media platforms: newspapers, TV, radio, events, magazines,
online and mobile channels. We have leading brands and services, like Helsingin Sanomat, Ilta-Sanomat, Aamulehti, Me
Naiset, Aku Ankka, Nelonen, Ruutu, Supla and Radio Suomipop. For advertisers, we are a trusted partner with insight,
impact and reach.

Key indicators

 EUR million                                           Q4 2021         Q4 2020          Change         FY 2021         FY 2020          Change

 Net sales                                                 164.1           160.8              2%           615.3           562.6           9%
                          1)
 Operational EBITDA                                         41.9            44.7             -6%           155.0           146.6           6%

 Operational EBIT excl. PPA 2)                              19.1            17.3            11%             73.5            66.6          10%

     Margin 2)                                            11.7%           10.7%                           11.9%           11.8%

 EBIT                                                       15.7            10.4            52%             60.6           209.6          -71%

 Capital expenditure                                          1.1             0.9           30%               4.9             5.1          -4%

 Average number of employees (FTE)                                                                         2,072           2,052           1%
1) Excluding  IACs
2)Excluding IACs of EUR -1.7 million in Q4 2021 (2020: -5.2) and EUR -6.1 million in FY 2021 (2020: 149.1) and PPA adjustments and
amortisations of EUR 1.7 million in Q4 2021 (2020: 1.7) and EUR 6.8 million in FY 2021 (2020: 6.1).
Full reconciliation of operational EBITDA and operational EBIT excl. PPA is presented in a separate table on p. 19.

Net sales by category

 EUR million                                           Q4 2021         Q4 2020          Change         FY 2021         FY 2020          Change

 Print                                                      79.7            81.8             -3%           311.0           291.4           7%

 Non-print                                                  84.4            79.0              7%           304.2           271.1          12%

 Net sales total                                           164.1           160.8              2%           615.3           562.6           9%

 EUR million                                           Q4 2021         Q4 2020          Change         FY 2021         FY 2020          Change

 Advertising sales                                          72.8            70.8              3%           245.8           231.6           6%

 Subscription sales                                         63.6            64.0             -1%           250.5           230.0           9%

 Single copy sales                                          10.1            10.6             -5%            41.1            42.8           -4%

 Other                                                      17.6            15.4            14%             77.9            58.1          34%

 Net sales total                                           164.1           160.8              2%           615.3           562.6           9%
Other sales mainly include festivals and events, marketing services, event marketing, custom publishing, books and printing services.

Q4 2021
Net sales of Media Finland grew slightly to EUR 164 million (2020: 161). Subscription sales were stable, while the number
of digital subscriptions continued to grow. Advertising sales grew driven by digital and radio advertising and was even above
the pre-coronavirus pandemic level of year 2019. Growth in other sales was driven especially by marketing and printing
service sales.

According to the Finnish Advertising Trends survey for December 2021 by Kantar TNS, the advertising market in Finland
grew by 7% year-on-year on a net basis in Q4 2021. Advertising grew by 13% in online (excluding search and social media)
and by 21% in radio. Advertising in TV and newspapers was stable, while advertising in magazines declined by 5%.

Operational EBIT excl. PPA grew to EUR 19 million (2020: 17). Growing advertising sales had a positive impact on earnings.

EBIT improved to EUR 16 million (2020: 10). IACs totalled EUR -2 million (2020: -5) and mainly consisted of costs related
to strategic business development, including acquisitions. PPAs were EUR 2 million (2020: 2).
Full-Year Result 2021 13 Capital expenditure totalled EUR 1 million (2020: 1) and consisted of maintenance investments. FY 2021 Net sales of Media Finland grew by 9% to EUR 615 million (2020: 563). Strong comparable growth of 7% (2020: -10%) was mainly driven by advertising and events sales. On a comparable basis, subscription sales grew with digital subscriptions of the daily newspaper Helsingin Sanomat and the subscriptions of the VOD service Ruutu+ growing steadily. Digital advertising sales grew strongly. Advertising grew also in radio and TV, but declined in printed newspapers and magazines. In total, comparable advertising sales were approx. 5% below the 2019 level. Other sales grew as about half of the festivals and events in the portfolio were organised during the high season of June–July, compared to no events in 2020. The acquisition of the regional news media business acquired in April 2020 accounted for the majority, EUR 25 million, of the net sales growth. The divestment of the online classified business Oikotie, completed in July 2020, had an adverse net sales impact of EUR 13 million. According to the Finnish Advertising Trends survey for December 2021 by Kantar TNS, the advertising market in Finland grew by 10% year-on-year on a net basis in 2021. In online, advertising grew by 18% excluding search and social media and by 21% including search and social media. Advertising grew by 9% in TV and by 18% in radio. Advertising in newspapers grew slightly, while advertising in magazines declined by 4%. Operational EBIT excl. PPA grew by 10% and amounted to EUR 74 million (2020: 67). The corresponding margin was stable at 11.9% (2020: 11.8%). Solid growth in B2B sales had a positive impact on earnings. Operating costs returned closer to normalised levels compared to the positive impact of corona-related cost mitigation actions in the previous year. This was visible particularly in personnel costs which increased due to lower bonus provisions and pension payments in the previous year. In 2020, profitability of the events business was positive due to insurance compensation received, while in 2021 it was around zero with approx. half of the festivals and events in the portfolio organised during the year. EBIT was EUR 61 million (2020: 210). IACs totalled EUR -6 million (2020: 149) and mainly consisted of costs related to strategic business development, including M&A. In 2020, the EBIT and IACs included a capital gain of EUR 165 million related to the divestment of Oikotie online classified business. PPAs were EUR 7 million (2020: 6). Capital expenditure totalled EUR 5 million (2020: 5) and consisted of maintenance investments.
Full-Year Result 2021                                                                                                               14

Personnel
In 2021, the average number of employees in full-time equivalents (FTE) in continuing operations was 4,885 (2020: 4,255).
The average number of employees (FTE) per SBU was as follows: Learning 2,599 (2020: 1,987), Media Finland 2,072
(2020: 2,052) and Other operations 214 (2020: 216). The number of employees increased mainly as a consequence of the
acquisition of Santillana in Spain in December 2020, but also as a result of the acquisition of the regional news media
business in Finland in April 2020.

At the end of December, the number of employees (FTE) of the Group was 4,822 (2020: 4,806) and there were no employees
in discontinued operations (2020: 19).

In 2021, employee benefit expenses increased to EUR 351 million (2020: 295). This was due to an increased number of
employees as a result of the acquisitions as well as normalising personnel cost levels compared to lower bonus provisions
and Finnish pension payments in the previous year.

Changes in management
On 21 December 2021, Alex Green was appointed Chief Financial Officer of Sanoma as of 1 March 2022. Alex Green will
be responsible for the Group’s Finance Functions and be a member of Sanoma’s Executive Management Team. He will
report to the President & CEO Susan Duinhoven. Sanoma’s current CFO & COO Markus Holm will continue working for
Sanoma until 1 July 2022 with focus on the hand-over and strategic development projects.

Executive Management Team
Sanoma’s Executive Management Team consists of the following members: Susan Duinhoven, President and CEO; Markus
Holm, CFO and COO (until 28 February 2022); Alex Green, CFO (as of 1 March 2022); Pia Kalsta, CEO of Sanoma Media
Finland and Rob Kolkman, CEO of Sanoma Learning.

Sustainability
As a result of the launch of its Sustainability Strategy in March 2021 and increased and more transparent sustainability
reporting, Sanoma’s scores in ESG ratings have improved. Sanoma participates in and has an active dialogue with the
following ESG rating companies:

Rating                                                                                   2021                             2020

MSCI                                                                                       AA                               AA

Sustainalytics (risk rating)                                                               9.8                             11.5

ISS                                                                                         C-                              D+

CDP (for climate change)                                                                     B                                D

The Taxonomy Regulation (2020/852) of the European Union (’Taxonomy’) entered into force in July 2020. For 2021, public
interest entities are, for the first time, required to report the proportion of the Taxonomy-eligible and non-eligible activities
under the Taxonomy objectives of climate change mitigation and climate change adaptation in their total turnover, capital
expenditure and operational expenditure. Under the Taxonomy, eligible activities currently focus on the most carbon-
intensive industries, green energy and innovations. As a leading European K12 learning company and the leading cross-
media company in Finland, Sanoma’s environmental footprint is not significant, and consequently only a few of its
businesses are defined as Taxonomy-eligible activities under the climate change adaptation objective, and none under the
climate change mitigation objective. Comprehensive disclosure under the Taxonomy will be included in the Report of the
Board of Directors, which will be published as part of Sanoma’s Annual Report 2021 during week 9 (starting on 28 February
2022).
Full-Year Result 2021                                                                                                           15

Share capital and shareholders
At the end of December 2021, Sanoma’s registered share capital was EUR 71 million (2020: 71), and the total number of
shares was 163,565,663 (2020: 163,565,663), including 679,614 (2020: 528,977) own shares. Own shares represented
0.4% (2020: 0.3%) of all shares and votes. The number of outstanding shares excluding Sanoma’s own shares was
162,886,049 (2020: 163,036,686).

In March 2021, Sanoma delivered a total of 210,363 (2020: 324,163) own shares (without consideration and after taxes) as
part of its long-term share-based incentive plans.

Sanoma had 23,308 (2020: 22,748) registered shareholders at the end of December 2021.

Acquisition of own shares
Sanoma repurchased own shares from 9 November until 16 December 2021. During that time, Sanoma acquired a total of
361,000 own shares for an average price of EUR 13.6919 per share. The shares were acquired in public trading on Nasdaq
Helsinki Ltd. at the market price prevailing at the time of purchase. The repurchased shares were acquired on the basis of
the authorisation given by the Annual General Meeting on 13 April 2021 to be used as part of the Company’s incentive
programme.

Share trading and performance
At the end of December 2021, Sanoma’s market capitalisation was EUR 2,219 million (2020: 2,240) with Sanoma’s share
closing at EUR 13.62 (2020: 13.74). In 2021, the volume-weighted average price of Sanoma’s share on Nasdaq Helsinki
Ltd. was EUR 14.54 (2020: 10.15), with a low of EUR 12.80 (2020: 6.84) and a high of EUR 17.12 (2020: 14.00).

In 2021, the cumulative value of Sanoma’s share turnover on Nasdaq Helsinki Ltd. was EUR 237 million (2020: 298). The
trading volume of 16 million shares (2020: 29) equalled an average daily turnover of 65k shares (2020: 116). The traded
shares accounted for some 10% (2020: 18%) of the average number of shares. Sanoma’s share turnover, including
alternative trading venues BATS and Chi-X, was 16 million shares (2020: 34). Nasdaq Helsinki represented 100%
(2020: 87%) of the share turnover. (Source: Euroland)

Decisions of the Annual General Meeting
Sanoma Corporation’s Annual General Meeting (AGM) was held on 13 April 2021 in Helsinki. The AGM was held based on
the so-called temporary act so that the shareholders of the Company and their proxy representatives participated in the
meeting and exercised the shareholder’s rights only by voting in advance as well as by submitting counterproposals and
asking questions in advance.

The meeting adopted the Financial Statements, the Board of Directors’ Report and the Auditor’s Report for the year
2020, discharged the members of the Board of Directors as well as the President and CEO from liability for the financial
year 2020, and made an advisory decision on the adoption of the Remuneration Report of the governing bodies.

The AGM resolved that a dividend of EUR 0.52 per share shall be paid and a sum of EUR 700,000 shall be transferred to
the donation reserve and used at the Board of Directors’ discretion. The dividend shall be paid in two instalments. The first
instalment of EUR 0.26 per share was paid to a shareholder who was registered in the shareholders’ register of the
Company maintained by Euroclear Finland Ltd on the dividend record date 15 April 2021. The payment date for this
instalment was 22 April 2021.

The second instalment of EUR 0.26 per share was paid in November 2021 to a shareholder who was registered in the
shareholders’ register of the Company on the dividend record date. In its meeting on 26 October 2021, the Board of Directors
decided that the dividend record date for the second instalment was 28 October 2021 and the payment date 4 November
2021.

The AGM resolved that the number of the members of the Board of Directors shall be set at nine. Pekka Ala-Pietilä, Julian
Drinkall, Rolf Grisebach, Mika Ihamuotila, Nils Ittonen, Denise Koopmans, Sebastian Langenskiöld and Rafaela Seppälä
were re-elected as members, and Anna Herlin was elected as a new member of the Board of Directors. Pekka Ala-Pietilä
was elected as the Chairman of the Board and Nils Ittonen as the Vice Chairman. The term of all Board members ends at
the end of the AGM 2022.

The AGM resolved that the monthly remuneration payable to the members of the Board of Directors remained
unchanged. The meeting fees of the Board of Directors also remained unchanged.
Full-Year Result 2021                                                                                                               16

The AGM appointed audit firm PricewaterhouseCoopers Oy as the auditor of the Company, with Samuli Perälä, Authorised
Public Accountant, as the auditor with principal responsibility. The Auditor shall be reimbursed against invoice approved by
the Company.

The AGM authorised the Board of Directors to decide on the repurchase of a maximum of 16,000,000 of the Company’s
own shares (approx. 9.8% of all shares of the Company) in one or several instalments. The shares shall be repurchased
with funds from the Company's unrestricted shareholders’ equity, and the repurchases shall reduce funds available for
distribution of profits. The authorisation will be valid until 30 June 2022, and it terminates the corresponding authorisation
granted by the AGM 2020.

The AGM authorised the Board of Directors to decide on issuance of new shares and the conveyance of the Company's
own shares held by the Company (treasury shares) and the issuance of option rights and other special rights entitling to
shares as specified in Chapter 10, Section 1 of the Finnish Companies Act. Option rights and other special rights entitling
to shares as specified in Chapter 10, Section 1 of the Finnish Companies Act may not be granted as part of the Company’s
incentive programme. The Board will be entitled to decide on the issuance of a maximum of 16,000,000 new shares (approx.
9.8% of all shares of the Company) as well as conveyance of a maximum of 5,000,000 treasury shares held by the Company
in one or several instalments. The issuance of shares, the conveyance of treasury shares and the granting of option rights
and other special rights entitling to shares may be done in deviation from the shareholders’ pre-emptive right (directed issue).
The authorisation will be valid until 30 June 2022 and it will replace the corresponding authorisation granted by the AGM
2020.

Seasonal fluctuation
The learning business has, by its nature, an annual cycle with strong seasonality. Most net sales and earnings are accrued
during the second and third quarters, while the first and fourth quarters are typically loss-making. The recent acquisition of
Santillana further increases the importance of the third quarter, when the new school year starts, for the business. Shifts of
single orders between quarters may have a material impact when comparing quarterly net sales and earnings on a year-on-
year basis, and thus year-to-date figures typically provide a more comprehensive picture of Learning’s business performance
and development.

In the media business, net sales and earnings are particularly affected by the development of advertising. Advertising sales
are influenced, for example, by the number of newspaper and magazine issues published each quarter, which varies
annually. TV advertising in Finland is usually strongest in the second and fourth quarters. The events business in Finland is
typically focused on the second and third quarters. In 2021, Sanoma organised 11 festivals during June–July, most of them
with restrictions related to the number of attendees. In 2020, no events were arranged due to the restrictions related to the
pandemic, but earnings of the business were somewhat positive due to insurance compensation received.

Seasonal business fluctuations influence the Group’s net sales and EBIT. Due to the seasonality in the learning business,
the first and fourth quarters are traditionally the smallest ones in terms of net sales, and loss-making. With the acquisition of
Santillana, the learning business is even more focused on the third quarter, when the new school year starts.

Significant near-term risks and uncertainties
Sanoma is exposed to numerous risks and opportunities, which may arise from its own operations or the changing operating
environment in the short-term or long-term. Sanoma divides its key risks into four main categories: strategic, operational,
non-financial and financial risks. The full review of the most significant risks that could have a negative impact on Sanoma’s
business, performance, or financial status, will be described in the Report of the Board of Directors, part of Annual Report
2021, which will be published on week 9.

The general economic conditions and trends in Sanoma’s operating countries could influence Sanoma’s near-term business,
performance or financial status. In general, demand development in learning markets is typically stable and well-predictable.
In the media markets, demand of advertising typically varies e.g. as a result of general economic activity. Sanoma estimates
that both in the learning and media markets, these conditions will not be significantly impacted by the coronavirus pandemic
and do not pose a significant risk for Sanoma’s business and financial performance in 2022. In Learning, there was no
significant impact on the business or financial performance due to school closures or other measures caused by the
coronavirus pandemic in 2021, and the conditions are expected to continue similarly stable in 2022. In Media Finland,
advertising demand was very volatile since the beginning of the coronavirus pandemic in March 2020, which is reflected to
year-on-year changes in Media Finland’s quarterly comparable advertising sales, as detailed in the table below. However,
in 2022 Sanoma expects the advertising market to be stable compared to the previous year. In addition, Sanoma expects
that the coronavirus pandemic does not have a significant effect on organising of live events during the high season of
summer 2022 in comparison to year 2021, when organising of live events was impacted by restrictions. In 2021, Sanoma
Full-Year Result 2021                                                                                                               17

organised 11 festivals, most of them with restrictions related to the number of attendees and corresponding to approximately
half of its full festival and events portfolio.

Comparable advertising sales development (excl. acquisitions and divestments)

                                    FY        Q4       Q3        Q2        Q1        FY        Q4        Q3        Q2       Q1
                                  2021      2021     2021      2021      2021      2020      2020      2020      2020     2020
Change, y-o-y                       8%       3%        3%       33%       -4%       -9%        3%       -5%     -30%       -1%

The general economic conditions may also be reflected in Sanoma’s operational and financial performance through increase
in the price of certain key supplies, raw materials or services material to Sanoma’s business, or their availability. Short-term
increases in paper, energy and transport prices, interest rates, overall inflation, or shortage e.g. in paper supply could have
a direct or in-direct adverse impact on the operational and financial performance of the Group’s businesses.

The Group’s operations are subject to various laws and regulations in the countries the Group operates in and changes in
such laws and regulations, or their interpretation, could have a material effect on Sanoma’s ability to conduct its business
effectively. In Learning, the introduction or delay, pace, scope and timing of changes of curriculum renewals in its operating
markets may influence its commercial propositions, content investment needs or financial performance as a whole.
Currently, this risk is mostly reflected in the Spanish markets, where the phasing and manner of implementation of the
educational reform in 2022−2023 is uncertain. Changes in taxation, as well as in the interpretation of tax laws and practices
applicable to Sanoma’s products and services or their distribution, e.g. VAT, may have an effect on the Group’s operations
or its financial performance. In April 2021, the Finnish Tax Adjustment Board accepted a claim based on tax audits at
Sanoma Media Finland in 2015–2018 about the treatment of VAT of certain magazines that were printed in multiple locations
in Europe and distributed through a centralised logistics centre in Norway. The same logistics practices continue to be in
use, while no tax audits have been conducted for years after 2018. More information is available on p. 8 and 38.

Sanoma’s well-balanced business portfolio mitigates the impacts of the key risks on the Group’s financial performance to a
certain extent: close to 70% of the Group’s operational earnings come from Learning. In addition, Sanoma takes active
actions to mitigate its costs and ensure supply of material goods and services, while there is no guarantee that these actions
will be sufficient to cover the potential impact on Sanoma.

Sanoma’s financial risks include interest rate, currency, liquidity and credit risks. Other risks include risks related to equity
and impairment of assets. As part of the quarterly reporting, Sanoma has reviewed the potential impact of the coronavirus
pandemic on the expected credit losses and adjusted provisions related to Media Finland accordingly. At the end of
December 2021, the Group has a solid financial position and a good ability to create a positive free cash flow.

Sanoma’s consolidated balance sheet included EUR 1,426 million (2020: 1,438) of goodwill, immaterial rights and other
intangible assets at the end of December 2021. After the acquisitions of Iddink and Santillana, most of this is related to the
learning business. In accordance with IFRS, instead of goodwill being amortised regularly, it is tested for impairment on an
annual basis, or whenever there is any indication of impairment. Changes in business fundamentals could lead to further
impairment, thus impacting Sanoma’s equity-related ratios. The company carefully monitored any impairment triggers
caused by the coronavirus pandemic during the year, and performed the annual impairment tests during the fourth quarter
according to the normal annual schedule. The impairment losses on goodwill, immaterial rights and other intangible assets
for continued and discontinued operations in 2021 totalled EUR 5 million (2020: 5).

Dividend proposal
On 31 December 2021, Sanoma Corporation’s distributable funds were EUR 417 million, of which profit for the year made
up EUR 191 million. Including the fund for non-restricted equity of EUR 210 million, the distributable funds amounted to
EUR 627 million. The Board of Directors proposes to the Annual General Meeting that:

 ◼    A dividend of EUR 0.54 per share shall be paid for the year 2021. The dividend shall be paid in two instalments. The
      first instalment of EUR 0.27 per share shall be paid to a shareholder who is registered in the shareholders’ register
      of the company maintained by Euroclear Finland Ltd on the dividend record date 11 April 2022. The payment date
      for this instalment is 20 April 2022. Record date for the second instalment of EUR 0.27 per share will be decided by
      the Board of Directors in October, and the estimated payment date will be in November 2022.
 ◼    The amount left in equity shall be EUR 539 million.
According to its dividend policy, Sanoma aims to pay an increasing dividend, equal to 40–60% of the annual free cash flow.
When proposing a dividend to the AGM, the Board of Directors looks at the general macro-economic environment, Sanoma’s
Full-Year Result 2021 18 current and target capital structure, Sanoma’s future business plans and investment needs, as well as both previous year’s cash flows and expected future cash flows affecting capital structure. Financial reporting and Annual General Meeting in 2022 Sanoma will publish the following financial report during 2022: Interim Report 1 January–31 March 2022 Friday, 29 April 2022 Half-Year Report 1 January–30 June 2022 Wednesday, 27 July 2022 Interim Report 1 January–30 September 2022 Thursday, 27 October 2022 Sanoma’s Annul Report, including the Financial Statements and Directors’ Report for 2021 as well as Sustainability Report, Remuneration Report and Corporate Governance Statement for 2021, will be published during week 9, which starts on 28 February 2022. The Annual General Meeting 2022 is planned to be held on Thursday, 7 April 2022 in Helsinki. Helsinki, 10 February 2022 Board of Directors Sanoma Corporation
Full-Year Result 2021                                                                                                                                 19

Reconciliation of operational EBIT excl. PPA

 EUR million                                                                             Q4 2021           Q4 2020          FY 2021         FY 2020
 EBIT                                                                                         -18.5            -22.7            142.4         270.1

 Items affecting comparability (IACs) and PPA adjustments
 and amortisations
 Learning
 Impairments                                                                                   -1.2              -0.6             -3.1         -0.6
 Restructuring expenses                                                                        -3.2              -9.8             -8.0        -12.7
 PPA adjustments and amortisations                                                             -6.6              -4.0            -32.2        -16.2
 Media Finland
 Impairments                                                                                   -0.6                               -0.6
 Capital gains/losses                                                                                            -0.2                         164.8
 Restructuring expenses                                                                        -1.1              -5.0             -5.5        -15.7
 PPA adjustments and amortisations                                                             -1.7              -1.7             -6.8         -6.1
 Other operations
 Impairments                                                                                                                      -0.6
 Capital gains/losses                                                                           0.8               0.2                 3.7       0.2
 Restructuring expenses                                                                         0.4              -0.1             -1.7         -0.2
 Items affecting comparability (IACs) and
 PPA adjustments and amortisations total                                                      -13.2            -21.2             -54.9        113.6

 Operational EBIT excl. PPA                                                                    -5.2              -1.5           197.2         156.5

 Depreciation of buildings and structures                                                      -5.8              -6.4            -24.9        -23.8
 Depreciation of rental books                                                                  -4.1              -1.9            -16.0        -13.2
 Amortisation of film and TV broadcasting rights                                              -14.9            -19.1             -54.0        -52.4
 Amortisation of prepublication rights                                                         -7.5              -5.6            -25.5        -20.7
 Other depreciations, amortisations and impairments                                           -16.9            -12.5             -47.3        -43.8
 Items affecting comparability in depreciation, amortisation and
 impairments                                                                                    1.8               0.6                 3.8       0.6
 Operational EBITDA                                                                            42.1             43.4            361.0         309.9

 Items affecting comparability (IACs) in financial
 income and expenses
 Financial items                                                                                                                                0.6

 Items affecting comparability (IACs) and PPA adjustments
 and amortisations in discontinued operations
 Capital gains/losses ¹)                                                                                         -0.1                          -1.8
 Impairments                                                                                                     -2.6                          -2.6
 Restructuring expenses                                                                                           0.1             -0.6         -0.6
 PPA adjustments and amortisations                                                                                                             -1.4
 Total                                                                                                           -2.6             -0.6         -6.4
¹)   In 2020, capital gains/losses include capital loss of EUR 1.6 million related to costs of the divestment of Media Netherlands.
Full-Year Result 2021                                                                                                                                  20

Reconciliation of operational EPS

EUR million                                                                          Q4 2021          Q4 2020          FY 2021           FY 2020
Result for the period attributable to the equity holders of
the Parent Company                                                                       -14.6            -25.9            100.2               246.7
Items affecting comparability                                                               4.9            18.3             16.4              -131.6
Tax effect of items affecting comparability                                                -1.1             -3.3             -3.6               -6.3
Non-controlling interests’ share of items affecting comparability                           0.1              0.0                                 0.0
Operational result for the period attributable to the equity
holders of the Parent Company                                                            -10.7            -10.8            113.0               108.8

Weighted average number of shares on the market                                 163,057,204 163,036,686 163,165,194 163,041,596
Operational EPS                                                                          -0.07            -0.07             0.69                0.67

Reconciliation of net debt

EUR million                                                                                                   31 Dec 2021           31 Dec 2020
Non-current financial liabilities                                                                                      432.2                  317.7
Current financial liabilities                                                                                            75.0                 265.0
Non-current lease liabilities                                                                                          133.5                  163.2
Current lease liabilities                                                                                                28.1                  29.5
Cash and cash equivalents                                                                                               -52.4                 -114.6
Net debt                                                                                                               616.4                  660.7
Net debt 31 December 2020 includes financial assets and liabilities of certain Learning operations that are presented as part of assets and
liabilities held for sale in the balance sheet. More details are presented on p. 38.

Reconciliation of adjusted EBITDA

EUR million                                                                                                         FY 2021             FY 2020
12-month rolling operational EBITDA                                                                                    360.5                  329.3
Impact of acquired and divested operations                                                                                0.0                  18.1
Impact of programming rights                                                                                            -57.1                  -52.7
Impact of prepublication rights                                                                                         -41.6                  -31.9
Impact of rental books                                                                                                   -6.3                  -10.7
Adjusted EBITDA                                                                                                        255.4                  252.1

Reconciliation of comparable net sales growth

EUR million                                                                          Q4 2021          Q4 2020          FY 2021           FY 2020
Net sales                                                                                252.4            227.3          1,251.6          1,061.7
Impact of acquired and divested operations                                               -11.7              -1.1          -126.1               -13.0
Comparable net sales                                                                     240.7            226.2          1,125.5          1,048.8
Full-Year Result 2021                                                                                                                                 21

Income statement by quarter

EUR million                                                 Q1          Q2         Q3          Q4          Q1          Q2         Q3          Q4
                                                          2021        2021       2021        2021        2020        2020       2020        2020
NET SALES                                                210.1       302.8       486.3      252.4       187.6       246.0       400.8      227.3
Other operating income                                      5.4         5.9         6.5         5.8        6.5       15.0       173.9        12.0
Materials and services                                    -64.5       -79.5     -194.4       -78.9       -55.2       -65.7     -160.9       -74.7
Employee benefit expenses                                 -87.6       -90.0      -81.6       -91.7       -71.6       -73.6      -66.7       -83.0
Other operating expenses                                  -37.3       -38.2      -34.6       -48.7       -40.7       -40.2      -37.8       -53.3
Share of results in joint ventures                          0.2         0.1         0.2         0.1        0.1         0.1         0.2        0.1
Depreciation, amortisation and impairment
losses                                                    -50.1       -49.6      -49.3       -57.6       -43.6       -38.8      -42.7       -51.1
EBIT                                                      -23.8        51.5      133.1       -18.5       -17.0       42.8       266.9       -22.7
Share of results in associated companies                   -0.1         0.0        -0.2         0.6       -0.1        -0.1         0.0       -0.1
Financial income                                            1.1         0.0         1.5         5.6        4.1        -0.3         1.5        1.7
Financial expenses                                         -4.8        -2.9        -4.6        -4.9       -4.8        -3.3        -3.8       -3.8
RESULT BEFORE TAXES                                       -27.6        48.7      129.9       -17.1       -17.7       39.1       264.6       -25.0
Income taxes                                                3.2       -11.6      -27.2          3.2        5.3        -9.5      -20.4         1.4
RESULT FOR THE PERIOD FROM
CONTINUING OPERATIONS                                     -24.4        37.0      102.7       -13.9       -12.4       29.5       244.2       -23.5
DISCONTINUED OPERATIONS
Result for the period from discontinued
operations                                                 -0.1        -0.1         0.1        -0.2        8.7         4.0         0.1       -3.4
RESULT FOR THE PERIOD                                     -24.5        36.9      102.8       -14.0        -3.8       33.5       244.3       -26.9
Result from continuing operations
attributable to:
Equity holders of the Parent Company                      -24.2        36.7      102.3       -14.4       -12.1       28.4       243.7       -22.5
Non-controlling interests                                  -0.3         0.3         0.4         0.5       -0.3         1.2         0.6       -1.1
Result from discontinued operations
attributable to:
Equity holders of the Parent Company                       -0.1        -0.1         0.1        -0.2        8.6         4.0         0.1       -3.4
Non-controlling interests                                      -           -           -          -        0.1         0.0            -           -
Result attributable to:
Equity holders of the Parent Company                      -24.3        36.6      102.4       -14.6        -3.6       32.3       243.7       -25.9
Non-controlling interests                                  -0.3         0.3         0.4         0.5       -0.2         1.2         0.6       -1.1
Earnings per share for result
attributable to the equity holders of the
Parent Company:
Earnings per share, EUR, continuing
operations                                                -0.15        0.22       0.63       -0.09       -0.07       0.17        1.49       -0.14
Diluted earnings per share, EUR,
continuing operations                                     -0.15        0.22       0.63       -0.09       -0.07       0.17        1.49       -0.14
Earnings per share, EUR, discontinued
operations                                                 0.00        0.00       0.00        0.00        0.05       0.02        0.00       -0.02
Diluted earnings per share, EUR,
discontinued operations                                    0.00        0.00       0.00        0.00        0.05       0.02        0.00       -0.02
Earnings per share, EUR                                   -0.15        0.22       0.63       -0.09       -0.02       0.20        1.50       -0.16
Diluted earnings per share, EUR                           -0.15        0.22       0.63       -0.09       -0.02       0.20        1.49       -0.16
In 2021, discontinued operations include certain Learning operations that are under strategic review. In 2020, discontinued operations included
also Sanoma Media Netherlands.
You can also read