Human Development Impacts of Migration: South Africa Case Study
←
→
Page content transcription
If your browser does not render page correctly, please read the page content below
Munich Personal RePEc Archive

Human Development Impacts of
Migration: South Africa Case Study

Landau, Loren B. and Segatti, Aurelia Wa Kabwe

Forced Migration Programme at University of Witwatersrand

1 April 2009

Online at https://mpra.ub.uni-muenchen.de/19182/
MPRA Paper No. 19182, posted 12 Dec 2009 07:20 UTC
Human Development
         Research Paper
                2009/ 05
  Human Development
  Impacts of Migration:
South Africa Case Study
             Loren B. Landau and
        Aurelia Wa Kabwe Segatti
United Nations Development Programme
Human Development Reports
Research Paper
April 2009
Human Development
Research Paper
2009/ 05
Human Development
Impacts of Migration:
South Africa Case Study
Loren B. Landau and
Aurelia Wa Kabwe SegattiUnited Nations Development Programme
Human Development Reports
Research Paper 2009/5
April 2009
Human Development Impacts of Migration:
South Africa Case Study
Loren B. Landau, PhD
and
Aurelia Kazadi Wa Kabwe-Segatti, PhD
Loren B. Landau is Director of the Forced Migration Programme at University of Witwatersrand.
E-mail: loren@migration.org.za.
Aurelia Kazadi Wa Kabwe-Segatti is a Research Fellow at the Forced Migration Programme at University of
Witwatersrand. E-mail: aurelia@migration.org.za.
Comments should be addressed by email to the author(s).Abstract Controls on human mobility and efforts to undermine them continue to shape South Africa’s politics, economy, and society. Despite the need for improved policy responses to human mobility, reform is hindered by lack of capacity, misinformation, and anti-migrant sentiments within and outside of government. This report outlines these trends and tensions by providing a broad overview of the limited demographic and socio-economic data available on migration to and within South Africa. Doing so highlights the spatialised aspects of human mobility, trends centred on and around the country’s towns and cities. It also finds significant development potential in international migrants’ skills and entrepreneurialism. By enhancing remittances and trade, non-nationals may also expand markets for South African products and services. Despite these potential benefits, there are severe obstacles to immigration reform. These include a renewed South African populism; the influence of a strong anti-trafficking lobby; a European Union (EU) agenda promoting stricter border controls; poor implementation capacity; and endemic corruption among police and immigration officials. There are different, but equally significant problems in reforming frameworks governing domestic mobility including perceptions that in-migration is an inherent drain on municipal budgets. Recognising these limitations, the report concludes with three recommendations. (1) A conceptual reconsideration of the divisions between documented and undocumented migrants; between voluntary and forced migrants; and between international and domestic migration. (2) An analytical respatialisation in future planning and management scenarios involving regional and local bodies in evaluating, designing and implementing policy. (3) To situate migration and its management within global debates over governance and development and for ‘migration mainstreaming’ into all aspects of governance. The success of any of these initiatives will require better data, the skills to analyse that data, and the integration of data into planning processes. Keywords: migration, urbanisation, governance, South Africa, policy reform, capabilities The Human Development Research Paper (HDRP) Series is a medium for sharing recent research commissioned to inform the global Human Development Report, which is published annually, and further research in the field of human development. The HDRP Series is a quick- disseminating, informal publication whose titles could subsequently be revised for publication as articles in professional journals or chapters in books. The authors include leading academics and practitioners from around the world, as well as UNDP researchers. The findings, interpretations and conclusions are strictly those of the authors and do not necessarily represent the views of UNDP or United Nations Member States. Moreover, the data may not be consistent with that presented in Human Development Reports.
The challenge for South Africa is to formulate policy that takes advantage of
         the positive aspects of globalization, including the unprecedented movement of
         people with skills, expertise, resources, entrepreneurship and capital, which
         will support the country’s efforts at reconstruction, development and nation-
         building.

               Republic of South Africa, White Paper on International Migration (1999)

Introduction

South Africa’s current politics, economy, social formations have been shaped by the elaborate
regulation of human mobility. From its foundation, the majority of its residents, citizens and non-
nationals, faced stark limitations on where they could live and own land and when and how they
could move. The system of control was never as absolute or incorruptible as many imagine, but
those who disobeyed state regulation did so at considerable risk. As the apartheid state’s power
waned in the late 1980s, so too did formal restrictions on movement into and within South
Africa. With the country’s first democratic elections in 1994, South Africa’s previously
forbidden cities became primary destinations for migrants from around the country. Over time,
they have become increasingly important nodes for migrants from around the continent and
beyond seeking profit, protection, and the possibility of onward passage. Human mobility in all
its forms continues to transform the country’s population and economy as never before.
       As the May 2008 violence against foreigners so starkly illustrates, domestic and
international mobility are not without significant risks to human security and the country’s
developmental trajectory. However, the country will not meet its short and long-term
development targets without significant migration of skilled and semi-skilled labour. Despite the
evident need to build an effective system to monitor and address human migration, the South
African government and civil society possess perilously limited capacity to improve migration
management and ensure the peaceful integration of migrants into development processes.
Moreover, the domestic and regional benefits of mobility are often hidden by concerns over
fears—of uncontrollable cities and citizens’ economic and physical security—and efforts to
protect the human rights of relatively small number of refugees, asylum seekers, and trafficking

                                                                                                 1
victims. Efforts to shift the terms of these discussions are further hindered by widespread anti-
immigration sentiment in and outside of government.
This report proceeds through three phases in exploring these trends and tensions. It
begins by providing a broad overview of the demographic and socio-economic data available,
appraising the quality of knowledge it offers on contemporary migration flows to and within
South Africa, and briefly assessing the limitations in methods and resources and identifying the
gaps to be filled. It then offers an overview of the main policy transformations at both national
and local levels, highlighting two sets of tensions: between the country’s immigration and
asylum regimes; and between regional integration and South Africa’s nationalistic self-interests.
The overview finishes by clarifying the main governance and human development challenges by
looking at two core issues: the integration of international migrants into local communities and
the local governance of migration in contexts of extreme vulnerability and resource competition.
The report ends by considering the viability of an approach to development drawn from
Amartya Sen’s pioneering work on capabilities and entitlements. Although convinced that South
and Southern Africa would benefit from expanding migrants’ choices and agency in the
development process as his framework suggests, there are severe limitations on implementing
such an approach. In the midst of global economic crisis and heightening domestic populism,
there are acute obstacles to reforming the country’s immigration system in ways that promote
long-term regional development outcomes. The challenges are heightened by the influence of a
strong anti-trafficking lobby and the European Union (EU). The anti-traffickers, led by the
International Organisation for Migration, continue to frame migration management as a concern
for law enforcement. Similarly, the recent EU-South Africa dialogue on migration is more likely
to entrench a border control approach than one informed by regional development priorities. One
must also recognise the limited influence of public policy on practice. With poor implementation
capacity and endemic corruption within the police and border officials, state policy of any kind is
unlikely to achieve its desired effects, whatever those may be.
Accepting these limitations, the report nevertheless makes three recommendations for
improving migration policy and management. First, it calls for a reconsideration of the divisions
between documented and undocumented migrants; between voluntary and forced migrants; and
between international and domestic migration. Such divides have produced policy silos with
little coordination among agencies charged with law enforcement, status determination,
2documentation, social assistance, or local development. With South Africa’s patterns of mixed
migration, there is a need to develop bureaucratic and planning mechanisms to address human
mobility more broadly.
Second, it calls for an analytical respatialisation in future planning and management
scenarios. While recognizing national government’s important role, there is a need to enhance
the role of local governments and regional bodies in evaluating, designing and implementing an
approach to human mobility. Migration and development vary across both space and time. Any
policy approach that fails to disaggregate migration according to these variables is unlikely to
fully realise its objectives.
Third, it argues that there is much to learn from situating discussion on migration and its
management within the broader global debate over governance and development. With a move
away from universally prescriptive approaches to governance, international actors like the UNDP
and its pioneering Human Development concept in 1997, the European Commission’s 2006
Strategic Paper on Governance and Development, the World Bank’s 2007 Paper on
Strengthening World Bank Group (WBG) Engagement on Governance and Anti-Corruption
(GAC) and bi-lateral approaches suggest the need to develop migration and development
frameworks based on a country’s specificities. As of yet, few international actors (let alone the
South African Government), have applied this approach to governance to migration, an area still
dominated by security concerns ill adapted to development challenges. If nothing else, the report
suggests that foreign assistance and domestic policy reforms push for ‘migration mainstreaming’
into all aspects of governance. In a country where international and domestic mobility remains so
demographically and politically important, the success of any development initiative must
overtly consider the country’s population dynamics. As part of this process, the government
should identify and understand the root causes of the negative by-products of human mobility–
corruption, human rights abuses, labour competition—and begin developing ways to help reduce
them rather than rely on the false premise that it can and should totally control mobility.
In concluding, the report notes that, should the political obstacles be removed, any effort
to incorporate migration into long-term policy and governance systems will require better data
and integration of data into planning processes. At present, there are few skills within or out of
government for collecting, monitoring, and analysing migration data. This gap becomes ever
more acute at the regional level. Without the ability to describe human mobility and evaluate
3policy’s current and potential impacts, policies are likely to fail in ways that help realise many
planners’ current fears about the effects of human mobility on prosperity, security, and
development.
Data Sources and Approach
In an effort to move beyond the demographic and quantitative fixations of much of the migration
and development literature, this study embeds demographic and economic trends within broader
socio-political formations. In doing so, it draws on an ecumenical set of data in illustrating the
intersections between human mobility and development in South Africa. This includes
considerable participant observation in national, local, and regional migration-related discussions
and new survey research together with formal and informal interviews with migrants, service
providers, advocates, and local and national government representatives in Johannesburg,
Pretoria, Cape Town and elsewhere. In a number of instances, it also calls on a survey the FMSP
conducted with 847 respondents in seven central Johannesburg neighbourhoods (Berea;
Bertrams, Bezuidenhout Valley, Fordsburg, Mayfair, Rosettenville, and Yeoville). Of these,
29.9% (253) were from the Democratic Republic of Congo (DRC); 24% (203) from
Mozambique; 22% (186) from Somali; and 22.4% from South Africa (190) (the remaining 1.8%
were from other countries mistakenly included in the sample.) The sample was 59.7% male,
generally reflecting official estimates of the inner-cities demographic composition (SACN 2006).
These data are by no means representative of South Africa’s ‘migrant stock’ or of the host
population. However, they do provide critical illustrations of trends and points where migration
and development intersect. In order to make broader claims, we also draw on the 2001 South
African Census and the 2007 National Community Survey, both conducted by Statistics South
Africa (StatsSA). The latter generated a nationally representative sample of all South African
residents but does not provide all of the spatial and demographic details afforded by the 2001
census.1 In all instances, we work from the position that social and political understandings of
human mobility are as important as actual movements in determining development outcomes.
1
More information on the 2001 census and the 2007 community survey are available from the Statistics South Africa
website (http://www.statssa.gov.za/publications/populationstats.asp). The authors are grateful to Veronique Gindrey
for her contributions to the statistical analysis included in this report.
4Contemporary Migration to South Africa: Numbers that Matter
Scholars often explain migration with reference to the three ‘D’s’: demography,
development, and disparities. Indeed, all available evidence suggests that the primary reason for
migration to and within South Africa is due to variations in economic opportunities within the
country and the region. A more nuanced analysis of migration motivations and trends also points
to the three ‘P’s. While the majority come seeking ‘Profit’, others come seeking ‘Protection’
from political or domestic persecution, natural disasters, or violence. A last group arrives in
South Africa seeking ‘Passage’: onward movement to a final destination elsewhere. In many
cases, their termini are outside Africa, typically Europe, North America, and Australia. A small
number also use South Africa to transit to Mozambique and Swaziland.
No one knows how many international migrants are in South Africa, how long they have
been there, how long they stay, or what they do while they are in the country. Despite rapid
changes in migration patterns, the South African government has largely failed to establish data
collection mechanisms that can inform pragmatic migration and development policies. Instead,
current policies continue to render most international migration bureaucratically invisible. Rather
than building mechanisms to plan for population movements, South African discussions around
migration policy during the 1990s and early 2000s have struggled over the evidence needed to
make sound choices and evaluate the impact of past decisions. In almost all instances, official
figures on both domestic and international migration and its effects raise significant questions of
data quality. Such weakness is tied to two factors: (1) the difficulty in accurately measuring
migration given the country’s extended borders, poor data on the South African population, and
mixed migrations within, into, and out of the country; and (2) migration’s association with highly
politicized issues surrounding nation-building, citizenship and belonging.2 Consequently, the
information presented below provides only rough quantitative estimates of who is coming and
where they are going. We complement these with a qualitative overview of migration patterns
into, within, and through the country.
2
For more on these connections, see Landau 2006.
5How Many Are Coming and Where Are They Going?
While cross border migration has undeniably increased over the last decade (see Figure 1),
overall figures are far lower than most South African officials and citizens presume. Moreover,
even in the most immigrant-rich parts of South Africa, the number of newly arrived non-
nationals is dwarfed by the number of recently arrived citizens. The most recent South African
census (2001) found only 477,201 foreign born residents out of a total of close to 45 million.
Due to sampling errors, the state statistics agency (Statistics South Africa or Stats SA) later
revised estimates to between 500,000 and 850,000. These numbers have climbed since the 2001
census because of relatively strong economic growth in South Africa, regional integration, and
the ongoing crisis in Zimbabwe. According to the 2007 Community Survey, a national
representative survey conducted by StatsSA, the total number of foreign-born residents is just
over 1.2 million or 2.79% of the total population. It is unclear how much of the increase since
2001 is due to improved sampling or an actual increase. Although there are suggestions that
StatsSA has again undercounted non-nationals—as they have undercounted the homeless and
other marginalised groups—there have been no serious or scholarly challenges to findings from
the Community Survey. Despite such evidence, there are regular claims by officials that 2-3
million Zimbabweans now live in South Africa. Empirical research in destination areas and
elsewhere in the country suggest that these numbers are ill-informed exaggerations (see Makina
2007: 5). Claims that there are 8-10 million ‘undocumented’ migrants in the country are equally
overstated.3
3
See Forced Migration Studies Programme and Musina Legal Advice Office (2007).
6Figure 1
Numbers of Arrivals of Temporary Residents between 1990 and 20054
10,000,000
9,000,000
8,000,000
7,000,000
6,000,000
5,000,000
4,000,000
3,000,000
2,000,000
1,000,000
0
1984 1985 1986 1987 1988 1989 1990 1991 1992 1993 1994 1995 1996 1997 1998 1999 2000 2001 2002 2003 2004 2005 2006 2007
Source: Statistics South Africa, Tourism and Migration, 1984-2007. (Statistics
unavailable for 1992-1994 and 1996-1997).
As in destination countries around the world, the total number of non-nationals living in South
Africa is a mix of documented and undocumented migrants along with refugees and asylum
seekers. As Figure 1 indicates, the number of temporary work, study, business, and tourist
permits granted annually has consistently increased since the end of apartheid. (The overall
number of temporary permits and visas thus went from 3.0 million to 9.9 million between 1992
and 1999.) During the same period, permanent immigration permits went from 14,000 a year in
1990, to 4,000 at the end of the 1990s. The number then rebounded to around 10,000 a year by
2004.5 Temporary permits and visas are also increasingly granted to Africans. There has been an
effort to increase the number of ‘exceptionally skilled’ migrants attracted to South Africa
through the general work permit, a (skills) quota work permit, an intra company transfer work
permit, treaty permits, as well as corporate permits. There are few statistics available on the
4
Temporary residents include entries for reasons of work, study, business, holiday, contract, border traffic, transit,
and other unspecified categories.
5
Department of Home Affairs, Annual Reports, 1990-2004.
7numbers of people recruited under these schemes although it is clear that the numbers fall short
of government set targets (see Table 12, far below).
There is also a relatively small, but expanding, number of refugees and asylum seekers
among the non-nationals living in South Africa. For reasons discussed further below, the number
of asylum seekers has grown far faster than that of refugees. According to the Department of
Home Affairs, there were 170,865 asylum seekers at the end of 2007 compared to 36,736 people
who had been recognised as refugees under the 1998 Refugees Act (implemented in 2001).
Many of this latter category may have now left South Africa or regularised their stay through
other means (including buying South African citizenship). Similarly, the number of asylum
seekers undoubtedly includes people who have filed multiple applications (often because the
DHA has misplaced their records) or who have left the country or applied for other permits.
Despite these qualifications, the global figures would likely be far higher if the South African
government had not effectively prohibited Zimbabweans from making asylum applications
before 2006 or had provided a mechanism for Zimbabweans to apply for asylum without first
travelling to Pretoria or Johannesburg. (Following the recognition that Zimbabweans had every
right to apply for asylum, Zimbabweans immediately topped the asylum seeker table.) Many
Zimbabweans continue to seek protection although the South African government has recognised
few—including victims of torture—as refugees. Compared to 33,351 pending applications at the
end of 2007, only 477 Zimbabweans were granted refugee status (see Tables 1-3).
Table 1
Cumulative Numbers of Numbers of Refugees and Asylum Seekers6
2001 2002 2003 2004 2005 2006 2007
Refugees 18,605 23,344 26,558 27,683 29,714 35,086 36,736
Asylum 4,860 52,451 84,085 115,224 140,095 131,107 170,865
Seekers
Total 23,465 75,795 110,643 142,907 169,809 167,193 207,601
6
Before the 2001 implementation of the Refugees Act (passed in 1998), there were officially no refugees or asylum
seekers in South Africa.
8Table 2
Asylum Numbers at a Glance (2007)
New Asylum Applications in 2007 45,673
Number of New Asylum Applications Decided in 5,879
2007
Percentage of Applicants Given Refugee Status 29%
New Backlog in Asylum Cases in 2007 39,758
Pre-2007 Backlog in Asylum Cases 49,275
Total Asylum Case Backlog +89,000
Table 3
Asylum Applications from Selected Countries (2007)
Zimbabwe 17,667
Democratic Republic of the Congo 5,582
Ethiopia 3,413
Malawi 3,341
Somalia 2,041
Bangladesh 1,982
Pakistan 918
While smuggling remains an important, if exploitative and occasionally dangerous, part of the
border economy, there is little evidence of widespread human trafficking into South Africa.
Indeed, an in-depth two-year study by the Institute of Security Studies in Pretoria has found few
non-nationals in precisely those sectors identified by the International Organisation for Migration
(IOM) and others as primary destinations for victims of trafficking (Gould 2008). IOM’s multi-
million dollar, multi-year regional counter-trafficking programme has identified few victims
(Private Communication with IOM employees 2007 and 2008). However, this has not stopped
9the IOM from publicly claiming that there are thousands of people being trafficked into South
Africa by organised crime (IRIN 2008b).7
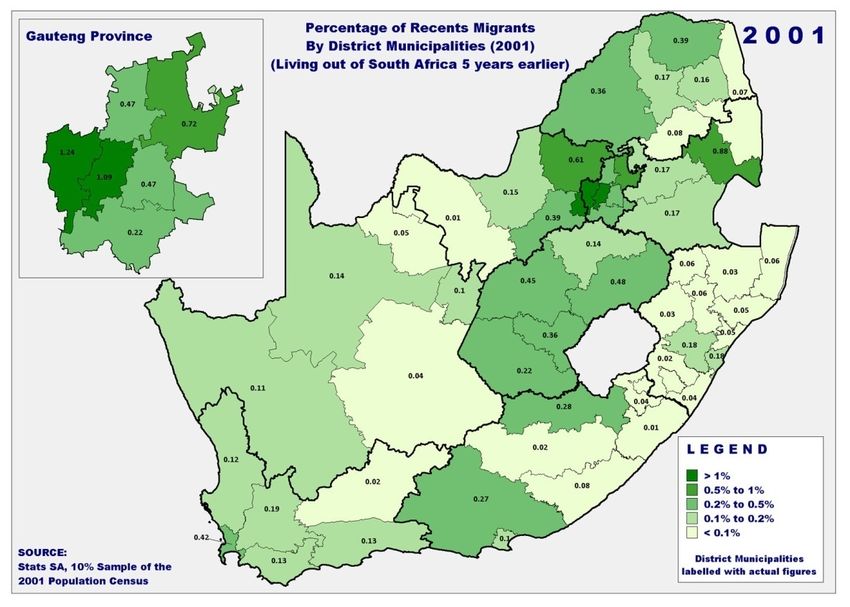
Removals and Deportation
Understanding migration dynamics in South Africa also draws attention to the long-standing and
elaborate (if expensive and ineffective) system of arrests and deportations. Under the 2002
Immigration Act, police or immigration officers may remand people to custody without a
warrant if they have reasonable grounds to believe they are not entitled to be in the Republic of
South Africa. Immigration officers are also empowered to arrest illegal foreigners and deport
them. In theory, the Immigration Act provides a range of procedural limitations on enforcement
activities. These include provision of adequate opportunity for suspects to claim asylum, rights to
appeal administrative actions, and time limits on detention for the purposes of deportation.
Research by Wits University and Lawyers for Human Rights has found that in many—if not
most—cases, police detain and deport people without full respect for the rule of law. In some
instances, this includes arresting people waiting to apply for asylum, who have recently crossed
the border into South Africa from Zimbabwe, and, in at least one instance, who are seeking
shelter in a police station after fleeing xenophobic violence. Consequently, the past years have
seen a significant increase in the number of deportations from South Africa.
7
In preparing this report, the authors discovered that IOM has removed most of the documents ostensibly
substantiating claims of widespread trafficking within the region from its South African website.
10Figure 2:
Deportations from South Africa 1990-2006
Source: Department of Home Affairs Data Reproduced in CORMSA 2008
The main reason for the rise in the number of deportations has been the heightened activity of the
police in immigration enforcement. The majority of those deported in most recent years are
people arrested soon after crossing the Zimbabwe-South Africa. These regularly include would-
be asylum seekers and unaccompanied minors. Some are returned to an International
Organisation for Migration centre in Musina, Zimbabwe. The majority are simply left on the
Zimbabwean side of the border. The other primary groups being deported include those from
Mozambique (the majority until 2004) and Lesotho.
11Spatial Distribution
As discussed briefly earlier, there are distinct spatial dynamics to both international and domestic
migration in South Africa. In previous decades, much of the international migration concentrated
in agricultural and mining areas. Since the early 1990s, both international and domestic migrants
are increasingly concentrated in the country’s urban centres (see Figure 3 and Table 4).
Figure 3
Note: Map developed by Forced Migration Studies at Wits with UNOCHA (Pretoria)
12Percentage Percentage
Foreign- Non-
Province Population of foreign- of non-
born Nationals
born Nationals
Western Cape 5,278,585 170,019 3.22 40,835 0.90
Eastern Cape 6,527,747 40,182 0.62 14,620 0.23
Northern Cape 1,058,060 19,406 1.83 1,895 0.23
Free State 2,773,059 83,088 3.00 27,995 1.03
KwaZulu-Natal 10,259,230 98,237 0.96 38,717 0.41
North West 3,271,948 116,929 3.57 50,773 1.39
Gauteng 10,451,713 578,387 5.53 212,715 2.41
Mpumalanga 3,643,435 101,534 2.79 35,822 1.15
Limpopo 5,238,286 60,541 1.16 41,074 0.78
South Africa 48,502,063 1,268,324 2.61 464,446 1.04
Source: StatsSA (2007) Community Survey
13Table 4
The Matrix of Origin of Migrants between Provinces 2001-2007
Percent from Province of Origin
Destination
N KZ M All Regions
Province WC EC FS NW GP LP
C N P
Western Cape 100
0 54 5 3 7 1 25 2 3
(WC) (N=197,212)
Eastern Cape 100
29 0 5 8 19 2 31 3 3
(EC) (N=85,392)
Northern Cape 100
20 6 0 10 3 43 17 1 1
(NC) (N=46,054)
100
Free State (FS) 6 18 10 0 8 14 34 4 4
(N=67,832)
KwaZulu-Natal 100
6 45 2 4 0 3 29 8 3
(KZN) (N=124,276)
100
Northwest (NW) 3 16 4 15 4 0 40 6 12
(N=152,933)
100
Gauteng (GP) 6 11 2 7 17 16 0 15 27
(N=609,169)
Mpumalanga 100
2 7 1 6 13 5 27 0 39
(MP) (N=128,903)
100
Limpopo (LP) 3 5 1 5 3 11 45 26 0
(N=7,1269)
Source: Stats SA, Community Survey 2007
This is most evident in Gauteng Province. Although the smallest of South Africa’s nine
provinces (less than 2% of the landmass), it contributes close to 34% of its gross domestic
product. This represents close to 10% of the GDP for sub-Saharan Africa.8 By far the most
urbanised population, it is also the most cosmopolitan. In Statistics South Africa’s 2007
Community Survey, 5.6% of its population born was born outside South Africa, almost double
the national average. In 2007, Gauteng Province hosted 46% of South Africa’s population born
outside South Africa. This is up from 42% in 2001 and is expected to increase in the years ahead.
This is not surprising when one considers the net migration gain in the province, (i.e., the
8
Figures from the Gauteng Development Agency (http://www.geda.co.za/live/content.php?Category_ID=30).
14difference between the arrivals and departures from the province): 418,000 between October
2001 and February 2007. Most of these are domestic migrants, but a significant proportion is
from outside the country. Even within the Province, non-nationals are concentrated in certain
cities (7.9% of Johannesburg is foreign born) and particular neighbourhoods. Whereas inner-city
areas like Yeoville, Berea, and Hillbrow now are close to or above 50% foreign-born, the
number of non-nationals is negligible elsewhere in the city.
It is also worth noting that international migrants’ origins differ significantly among
Provinces and cities. While Mpumalanga and Limpopo Provinces primarily host Mozambicans
and Zimbabweans, there is a far greater diversity of foreigners living in Durban and Cape Town
including many more Zimbabweans, Mozambicans, Congolese and Angolans. Somalians are
also present in all major cities and smaller towns, but in much smaller numbers. As each of these
groups is likely to have come to South Africa for different reasons, the social protection and
developmental impacts also significantly differ.
Even if international migration attracts the most political attention and popular
opprobrium, domestic mobility is far more significant in numeric terms. Fully explaining the
dynamics of inter-community and inter-provincial migration would require another report far
longer than this. Suffice it to raise a number of critical points. First, research by the South
African Cities Network (2006:16) and others clearly illustrates the spatial dynamics of migration
to particular urban centres. In Metsweding, a smaller municipality in Gauteng Province, more
than 10% of the total population has recently moved there. In Durban, the figure is less than 1%.
And while discussions of urbanisation typically focus on primary cities, the fastest growing parts
of Gauteng are not Johannesburg and Pretoria but rather smaller communities beyond the ‘urban
edge’ (See Table 5). The most notable and controversial effect of this growth has been the
expansion of poorly serviced informal settlements (i.e., shantytowns) ringing more established
and well-serviced formal settlements.
15Table 5
Migration Figures for Selected Municipalities 2001-2006
In-Migration as
Municipality Percentage of Total
Population (2006)
Metsweding (Gauteng) 10.13
Overberg (KwaZulu-Natal) 8.18
Tshwane (Pretoria) 7.15
West Coast (Western Cape) 6.71
Ekurhuleni (Johannesburg Suburb) 5.88
West Rand (Johannesburg Suburb) 5.82
Johannesburg (Gauteng) 4.38
Cape Town (Western Cape) 4.38
eThekwini (KwaZulu-Natal) 0.92
Nelson Mandela (Eastern Cape) 0.63
Source: Data produced by Statistics South Africa. Table
reproduced from South African Cities Network 2006 p. 2.189
As a result of these internal movements, out migration is also significantly shifting
population profiles of a number of the country’s smaller and less prosperous communities. For
example, Chris Hani municipality in the Eastern Cape has lost more than 8.5% of its population
over the past decade (Cities Network 2006:18). Many of those who left are young men heading
for the Western Cape (Dorrington 2005). Consequently, there are significant distortions in
population pyramids in both sending and receiving communities (see Collinson, et al, 2006).
In addition to sheer numbers—far outweighing the number of international migrants—
shifts within and among Provinces are resulting in significant changes in skills level and social
composition. In the Western Cape, the arrival of people from the Eastern Cape, traditionally an
ANC stronghold, is not only transforming the Province’s racial composition, but also threatens
the viability of the Province’s powerful opposition parties. In Gauteng, the enormous diversity
9
The municipalities represented in these tables were selected by the South African Cities Network, the organisation
that originally published these data, to illustrate national trends. They are not necessarily representative of all South
African cities.
16fostered by migration has proven to be a politically exploitable resource in the past, particularly
during the violence preceding the 1994 general elections. As South African politics again
become more competitive, there are hints that ethnicity may re-emerge as a dangerous political
divide.
South Africa is also seeing a great diversification in its population’s migration
trajectories. Whereas Apartheid-era South African migration policy promoted permanent White
immigration and temporary Black migration, the post-apartheid period is characterised by a mix
of circular, permanent, and transit migration. Indeed, such impermanence is encouraged by the
current policy frameworks, the difficulties migrants have in accessing secure accommodation,
and the rapid rate of deportations (see above).
As with many of the characteristics of migration, these trends are most visible in Gauteng
Province. For reasons of location, infrastructure, intention and experience, the Province is as
much a place of transit as destination. This transit takes multiple forms. The first is the
continuation of long-standing patterns of circular migration from rural South Africa and
elsewhere in the region, albeit now focused more around townships and urban centres. The
second form of transit rests with traders and refugees who come to Gauteng seeking
opportunities for profit or temporary protection. While often remaining for extended periods in
the Province, their lives and interactions are typically conditioned by their interest in onward
movement. The third type of transit migration is driven by those who see Gauteng as a stepping-
stone or trampoline. The Province’s wealth often attracts those who expect to accumulate the
money needed for onward journeys. Many come hoping for contacts and social networks that
will facilitate movement to other cities or countries. Still others hope to capitalise on the
country’s corrupt immigration regime that allows almost anyone with money to secure South
African citizenship and documentation. With these documents in hand, travel to Europe and
elsewhere becomes far easier.
The trend above is illustrated by FMSP research: in the 2006 Wits University survey in
Johannesburg, 59% of migrants considered Johannesburg as their final destination. This
proportion is higher for Mozambicans (78%) and for the internal migrants (84%). In many
regards, the migrants born in Mozambique have the same migratory behaviour as the internal
migrants in South Africa. When the Mozambicans had considered other destinations, it was
essentially Swaziland or a European country. South Africans who migrated to Johannesburg also
17considered other destinations in South Africa. People born in the DRC or in Somalia often
considered South Africa a second choice and had considered moving to North America or
Europe before coming. Interestingly, migrants born in the DRC tend to see Johannesburg as a
point of transit more often than the other groups. Of those surveyed, 30% expected to live in a
third country in two years time. By comparison, 11% of the migrants born in Somalia expected
to be elsewhere. Again comparing those two groups, 32% of migrants from DRC and 22% of the
migrants from Somalia consider that their children should grow up in a third country. Table 6
captures these figures.
Table 6
Expectations of the Migrants after Migrating to Inner City Johannesburg
Where respondent Place of birth (%)
expects to live in two South Africa outside
years DRC Somalia Mozambique
Johannesburg
South Africa 44 68 60
81
Country of origin 13 8 20
Third country 30 11 4 5
Don’t know 13 12 15 13
Total 100 100 100 100
Source: Wits University, African Cities Survey 2006
Linked to these trajectories and other factors, people regularly move within South Africa as well
as into and out of it. According to the 2007 Community Survey, 18% of Gauteng’s inhabitants
had moved within the Province since 2001. According to FMSP data for the inner city of
Johannesburg, the South African born population has, on average, moved twice since coming to
the city, usually within the last decade. For foreigners, typically in the city for a shorter period,
the average is slightly above three times.
18Who Are They and What Do They Do?
Post-apartheid international migration movements towards South Africa have been characterised
by three major demographic features that distinguish them from the situation in the late 1980s:
the diversification of migrants’ origins, younger migrants and feminisation. The great post-
apartheid change is the massive influx of both permanent and temporary African and Asian
migrants. Among these are significant numbers of refugees and asylum seekers. Although
European permanent immigrants continued to dominate in absolute terms until 1998, since 2000,
most migrants have come from Africa and Asian.
Qualitative studies confirm this tendency. Robert Mattes, et al. have demonstrated in a
1999 study that the profile of qualified migrants and immigrants is revealing of a divide between
those who settled in South Africa before 1991 and those who arrived since. This study indicates
that out of a sample of 400 people interviewed, 73% of qualified European migrants arrived
before 1991 whereas 87% of qualified African migrants outside SADC countries had arrived
after that, with SADC migrants equally distributed in the two groups. The study confirms this
dichotomy in status and skills between migrants arrived before and after 1991. Thus, three
quarters of the qualified migrants who entered South Africa before 1991 were permanent
residents whereas a very large proportion of those arrived after 1991, essentially Africans, only
held temporary permits (Mattes, et al, 2000). Tables 7-10 provide additional detail on the
educational levels and professions of the country’s migrants and their employment status.
19Table 7
Levels of Education by South African or Foreign Citizenship (2001)
Percent Percent Non-
Nationals Nationals
No schooling 15.9 16.0
Some primary 30.0 18.9
Complete primary 7.0 7.0
Some secondary 28.0 26.1
Grade 10/ Std 10 13.9 16.9
Tertiary 5.3 15.2
Total 100 100
Source: Stats SA, Population Census, 2001
Table 8
Professions of 16-65 Year Olds by Citizenship (2001)
Percent Percent
Nationals Non-
Nationals
Legislators; senior officials and managers 5.3 6.3
Professionals 6.9 8.7
Technicians and associate professionals 9.6 5.0
Clerks 11.1 4.6
Service workers; shop & market sales 10.2 9.1
workers
Skilled agricultural & fishery workers 2.8 3.5
Craft and related trades workers 11.8 20.8
Plant and machine operators & assemblers 8.7 10.7
Elementary occupations 33.6 31.4
Total 100 100
Source: Stats SA, Population Census, 2001
20Table 9
Employment Status of 16-65 Year Olds by Citizenship (2001)
Percent Percent
Nationals Non-
Nationals
Employed 33.4 60.1
Unemployed 24.1 14.9
Not economically 42.5 25.0
active
Source: Stats SA, Population Census, 2001
Table 10
Work Status of 16-65 Year Olds by Citizenship (2001)
Percent Percent
Nationals Non-
nationals
Paid employee 89.1 82.0
Paid family worker 1.4 1.1
Self-employed 7.6 14.8
Employer 1.5 1.7
Unpaid family 0.5 0.4
worker
Total 100 100
Source: Stats SA, Population Census, 2001
Apart from broadly outlining the economic behaviour of South Africa’s international migrants,
there are few existing data on their remittance or investment patterns. To some extent this
reflects broader limits on knowledge about the poor, marginalised, and others who depend
heavily on the informal sector/second economy for income. Piecing together data collected from
a variety of sources, Table 11 nevertheless demonstrates that South Africa is at the centre of a
Southern African remittance network. The Southern African Migration Project goes so far as to
argue that for most migrant-sending households, migrant remittances form the main source of
household income, although male migrants’ remittances are more likely to be the primary or sole
21source of income for their households. It is also worth noting that the women remit significantly
lower amounts of money than male migrants (Dodson, et al, 2008).
Table 11
Estimated Intra-Regional Remittance Flows (ZAR)
Receiving Country (ZAR Million)
Sending Botswan Malaw Swazilan Other
Lesotho Moz. RSA Total
country a i d SADC
Botswana __ 2.59 3.65 29.6 0.55 51.42 87.87
4
Lesotho 0.61 __ 0.61
Malawi 0.18 __ 0.18
Mozambiqu __
e
RSA 133.28 1,675.8 57.19 2,241.7 __ 432.29 1,531.8 6,072.1
4 1 5 5
Swaziland 0.39 __ 0.39
Total 134.46 1,678.4 60.84 2,241.7 29.6 432.84 1,583.2
3 1 4 7
Source: Genesis Calculations from Various Sources. Table Reproduced from Pendelton, et al,
2006.
Although SAMP research confirms the importance of remittances, FMSP research provides
additional dimensions to migrants’ remitting behaviour. While remittances remain important, the
2006 survey in central Johannesburg found that just over 45% of international migrants sent
money or goods to people outside the city. This compares broadly with the percentage of South
Africans who also report regularly sending resources to friends and family elsewhere. However,
this figure ranged widely among national groups. Among the Congolese, only 33% reported
sending money, usually to parents (63% of those who send) or other close relatives (38%).The
percentage rises to 56% among Somalis who send primarily to parents (89%) and siblings (24%).
In almost all cases, the Somalis relied on community-based remittances systems; those from the
22DRC depended most frequently on MoneyGram, while Mozambicans typically rely on friends of
family members to transport remittances. There seems to be little evidence to suggest that legal
status or income is closely connected to remittance rates. Given the short term many migrants
remain in Johannesburg, the FMSP data are also inconclusive on whether time in the country is
connected to increased or decreased remittances. However, the study did find that over a third of
Congolese in the FMSP sample and almost a fifth of Somalis and South Africans report regularly
receiving money from outside of the city. In the case of the Congolese, most of these transfers
originated outside of Africa, suggesting a complex web of multi-sited families and livelihood
strategies. Qualitative research suggests that these transnational or translocal transfers are often
related to establishing or support migrants in the city in order to invest, get education, or take
care of the financial and administrative needs in order to move elsewhere.
In addition to adult migration, FMSP research finds that children as young as seven are
migrating alone form neighbouring countries due to the death of their parents, lack of money, or
not being in school. There are no reliable estimates on the total numbers although an FMSP
study planned for 2009 may provide some estimates. Even without a global figure, it is clear that
the number of children migrating alone is significant and is almost certainly growing. Once in
the country, children face exploitation by police who illegally send them back over the border
and detain them in illegal conditions—such as with adults and for extended periods. Although
many children in border towns may have legitimate asylum claims, they lack the resources
needed to reach the urban centres where they could apply for asylum. Children as young as seven
years old work in exploitative conditions. In a 2007 study by Save The Children near the
Zimbabwean border, almost a quarter of those interviewed had no income, while a similar
number made money by collecting items for recycling. Farm work (for boys) and domestic work
(for girls) were common forms of work. Children who are living in urban centres, however, are
more likely than those on the borders to be in school and have access to accommodation and
limited NGO support that prevents them entering this kind of work. Although there has been a
response from some non-governmental organisations, there has been little effort on the part of
the Department of Social Development or other government agencies to address the concerns of
unaccompanied minors.
23Migration and Skills
A discussion of immigration and development in South Africa would be incomplete without
some mention of ‘brain drain’ and efforts to recruit the skills needed to grow the South African
economy. In this regard, South Africa’s distinction lies in its specific position in African
migratory systems. Unlike countries in the Maghreb or West Africa, South Africa is neither a
major source nor transit country for low-skilled labour en route to the European Union or North
America. However, it has increasingly become a source country for highly skilled professionals,
most notably in the medical professions, mine and mechanical engineering, and information and
communication technology. The initial flight of skilled professionals began in the 1980s, often
for a mix of economic and political reasons. Today out-migration continues for an array of
reasons including job opportunities, wage differentials, working conditions, crime, and as a side-
effect of affirmative action policies that are perceived as limiting career prospects for the
country’s White minority.
The main difficulty of estimating the skills loss is linked to poor measures of the volume
and nature of departures. Recent studies have shown an important gap between recorded
departures and legal settlements of South Africans in the five first countries of immigration.
Some have argued that figures provided by Statistics South Africa (relying on Home Affairs
data) of people recorded as having left the country since 1994, represent less than half the
number of South African immigrants legally recorded in host countries (mainly the United
Kingdom, Australia, New Zealand, and the United States). The immigration policies of countries
such as the UK or Canada have attracted many qualified South Africans, particularly those
skilled in the medical professions. In 2003-2004, South Africa acknowledged a deficit of 57,574
nurses, 200 of them leaving the country every month. Since 2004, no figures are available for
South African citizens’ whereabouts. However, comparing stocks of South African migrants in
receiving countries and self-declared emigrants, Statistics South Africa came to the conclusion
that approximately 322,499 South Africans had emigrated between 1970 and 2001 (StatsSA,
2003; See also Southern African Migration Project Policy Brief 8). In addition to brain drain,
South Africa suffers from an acute lack of skills due to a history of poor education under
apartheid.
24In 2006, the Mbeki government ended its long denial of the widespread loss of skills by
publicly acknowledging the effects of brain drain and poor education on the South African
economy. Foreseeing a 1.2 million person skills-gap by 2014, his administration gave birth to the
Accelerated and Shared Growth Initiative for South Africa (ASGISA) and, subsequently, to the
Joint Initiative on Priority Skills Acquisition (JIPSA). The latter initiative identified five areas
where skills were in particularly short supply: engineering; city, urban, and regional planning;
artisan and technical skills; management and planning skills in education and health; and math,
science, and language teachers. A more recent survey by the Harvard Centre for International
Development (Levinsohn 2008), advocates a proactive high-skill immigration policy as a remedy
to high unemployment rate. Although one can question the empirics behind the assertion, the
Harvard study suggests that South African economic growth is capped at far below the desired
target by the lack of skills.
Recognising the need to attract skills back to South Africa, First National Bank has
sponsored an initiative they call the ‘Homecoming Revolution’, an effort premised on South
African patriotism. Although undoubtedly appealing to some, neither the Homecoming
Revolution nor JIPSA have made much progress in addressing South Africa’s skills gap. JIPSA
reports from 2007, for example, suggests that there will continue to be severe skills shortfalls in
all five of the high profile areas identified when JIPSA was founded in 2006. JIPSA’s 2007
report predicted that by 2012, the country would be short of approximately 30,000 or more
artisans, 22,000 engineers, and significant (but unspecified) numbers of town and regional
planners (JIPSA Task team 2007).
To further address these gaps, the Department of Home Affairs has identified a number
of ‘Scarce and Critical’ skills that, if possessed, should enable people to immigrate easily to
South Africa (see Table 12). However, businesses regularly complain that inefficiencies within
the Department of Home Affairs and the inflexibility and under capacity of a number of South
African accreditation bodies (notably the South African Qualifications Authority) have limited
the number of people they have been able to recruit. That employing non-nationals—even
African non-nationals—does not help companies achieve Government-set Black Economic
Empowerment targets further discourages the use of these options. Nonetheless, South Africa is
today in a rather schizophrenic position in which it is one of the strongest voices against the
25plundering of highly sought after skilled by developed countries while it stands accused of the
very same sins by other African countries.
Table 12
List of ‘Scarce and Critical’ Skills Published by the
Department of Home Affairs and Number of Individuals Required in Each Occupation
(2006)
Science and Engineering. Professionals and Associate Professionals
Aeronautical Engineers: 500
Aircraft maintenance Engineers: 500
Autotronics: Vehicle diagnostic technicians 500
Avionic Engineers 250
Chemical Engineers including Rubber & Plastic 100
Construction/ Civil Engineers 5,000
Design and Engineering: Piping and pipe laying 500
Electronic Radio Frequency and Signal Engineers Microwave and Satellite 500
engineers
Geologists 100
Astronomers 200
Astrophysicists 200
Atmospheric physicist 200
Surface physicist 200
Space Scientist 200
Geophysicists 150
Industrial Engineers 5,000
Jewellery Designers 250
Mechanical Engineers including pressure vessel and stress analysis 1,000
Metallurgical Engineers including material processes and development; 250
Metallurgists
Mining: Rock and Colliery Engineers 100
Aircraft maintenance technicians 1,000
Architectural Technicians 1,000
Aviations technicians (Aviation specific design and machining technologies) 1,000
26Dimensional Controllers 100
Earth Sciences Technicians 250
Electrical Mechanical including instrumentation 1,000
Electronic technicians: Silicon and Microchip developers 1,000
Foundry metallurgists 500
Hydraulics and Pneumatics Technicians 1,000
Industrial/ Product development technologists 1,000
NDE Technicians 500
Tool designers including Millwrights, Melters, Coded Welders and Moulders. 3,000
Education Professionals
Maths and Science Teachers 1,000
Information Technology Professionals
Software Developers 1,500
Software Engineers 1,500
ICT Security Specialists including Dimensional Controllers 1,000
Health and Medical Sciences Professions
Biological Science Technician 3,000
Bio-informatics 1,000
Biomedical Engineers 1,000
Combinatorial and Computational Chemistry 150
Research and Development: Pharmacologists 300
Agricultural Sciences
Agricultural Economist (Econometrics) 500
Agricultural Engineers including Farm Irrigation System Engineers 1,000
Agricultural Extension Officers: Technology focused 1,000
Agricultural Statistics: Biometrician, Crop Modeller 1,000
Agricultural Biotechnologists, Genetic Markers and Promoters 1,000
Virologists 250
Oenologist/ Viticulture 350
Geneticist plant breeders 1,000
Pasture Scientists 500
Plant Pathologists 1,000
Food Safety Quality Assurance Specialists 500
27Veterinarians 500
Management and Commerce Professions
Actuaries 500
Financial Market Analysts 500
Risk Managers 500
Source: Department of Home Affairs (Government Gazette, 08 February 2006) in Daniels 2007
While South Africa struggles to fill its skills gaps through an approach reminiscent of (largely
discredited) 1970s era ‘manpower planning,’ it has increasing numbers of semi to highly skilled
immigrants moving spontaneously to the country from the rest of the continent (in particular
from Zimbabwe, the Democratic Republic of Congo, Kenya, Uganda, Nigeria, Ghana). The first
wave of these came early and was composed of intermediate or highly skilled professionals from
highly unstable countries (such as Zairian / Congolese doctors or mine engineers, or Rhodesian /
Zimbabwean teachers) who found employment in the former homelands. In the mid 1990s, the
globalised African elites (academics, bankers, consultants, journalists, etc) also began applying
for positions in South African firms or for postings in South Africa from within their
organisations/firms. Many of these were absorbed but many others experienced severe
downgrading in their skills when coming to South Africa. SADC prohibitions on recruiting
medical professionals from within the region have further limited the number of professionals in
South Africa who are able to work in their desired position. A 2008 effort to regularise
Zimbabwean teachers may help to address part of the gap in the education sector, but there are
thousands of other skilled professionals who have arrived in the country who are unable to work
or are underemployed due to lack of documents or certification.
National Policy Frameworks
Beginning in 1990, South Africa has gone through a period of unprecedented political changes.
Foremost among these are constitutional reforms and an opening of space for political debate.
This has helped generate a paradox regarding the position of migrants in South African society:
despite a legal framework guaranteeing international migrants more rights than ever before,
28migrants remain remarkably vulnerable to socio-economic exclusion, harassment from police,
and violence at the hands of state agents and citizens. In official and public deliberation,
migration often seems caught between complaints about the state’s inability to control the border
and protect South African job and its incapacity to attract and retain foreign skilled labour and
investors.
These tensions in migration policy are rooted in the striking historical absence of
immigration on the ruling African National Congress’ policy platform. Whether it was the
party’s initial social-democratic framework with the Redistribution and Development
Programme (RDP) or the pro-market Growth, Employment and Redistribution plan in 1996,
politicians have rarely seen migration as a political or economic tool or linked it to the country’s
socio-economic transformation. Instead, migration policy is the product of a triple process: the
legacy of apartheid administrations, the constraints created by transition rules (the famous Sunset
Clauses) and the introduction into the game of new actors and groups carrying with them new
and often competing models of migration management. Only with the creation of JIPSA
(described above) has the government explicitly begun linking migration to broader development
concerns. However, this has taken place without a full review of the country’s migration policies
that are only likely to be reconsidered by a new post-election government in 2009 or 2010.
The immigration policy inherited by the de Klerk administration in 1989 bore three
characteristics. It was initially based on a classical colonial settlement policy focusing on the
almost exclusive development of the needs of the European minority and its corollary, a cheap
African labour maintained in a precarious position. Secondly, the management of migration and
foreigners was discretionary by nature and often based on opaque practices. Finally, the
development mode through which this policy was meant to evolve was incremental, very rarely
providing enough space for assessment or even public debate. It was thus largely disconnected
from ongoing migration trends and dynamics as well as from actual assessments of skills’ needs
in the various sectors of the South African economy.
The 1991 Aliens Control Act, nicknamed ‘Apartheid’s last act’, became the cornerstone
of South African immigration policy throughout the 1990s. Drafted in order to unify and
simplify all previous immigration laws since 1937, the Act generated fundamental tensions from
the advent of the 1994 democratic regime. In contradiction with the 1993 Interim Constitution
and the 1996 Constitution, the 1991 Aliens Control Act was ultimately declared unconstitutional.
29You can also read