Hydrological Modeling for Climate Adaptation - CITY OF CRANBROOK - Columbia ...
←
→
Page content transcription
If your browser does not render page correctly, please read the page content below
CITY OF CRANBROOK

Hydrological Modeling for
Climate Adaptation
CONTENTS
Introduction ...................................................................................................................................................................1
    Purpose .....................................................................................................................................................................1
    Study Area .................................................................................................................................................................1
    Methods ....................................................................................................................................................................3
        Hydrological Modeling ..........................................................................................................................................3
        Climate Change Modeling .....................................................................................................................................7
        Forest Disturbance ................................................................................................................................................8
        Hydrological Modeling Parameterization and Performance ................................................................................9
Outcomes ....................................................................................................................................................................10
    Effects of Land Cover change scenarios (forest fire) on stream flow ......................................................................10
        Peak Flows ..........................................................................................................................................................10
        Flow Timing .........................................................................................................................................................11
    Effects of Climate Change Scenarios .......................................................................................................................12
        Peak Flows ..........................................................................................................................................................12
        Flow Timing .........................................................................................................................................................12
Discussion ....................................................................................................................................................................13
References ...................................................................................................................................................................14

Publication Details
Project Team: Selkirk College Department of Applied Research and Innovation (Kim Green, Ian Dennis, Ines
Schrottenbaum, Lauren Rethoret); City of Cranbrook (Katelyn Pocha)
Publication Date: May 25, 2021
The preparation of this study was carried out with assistance from the Government of Canada, the Federation of
Canadian Municipalities, and the Natural Sciences and Engineering Research Council. Notwithstanding this support,
the views expressed are the personal views of the author(s)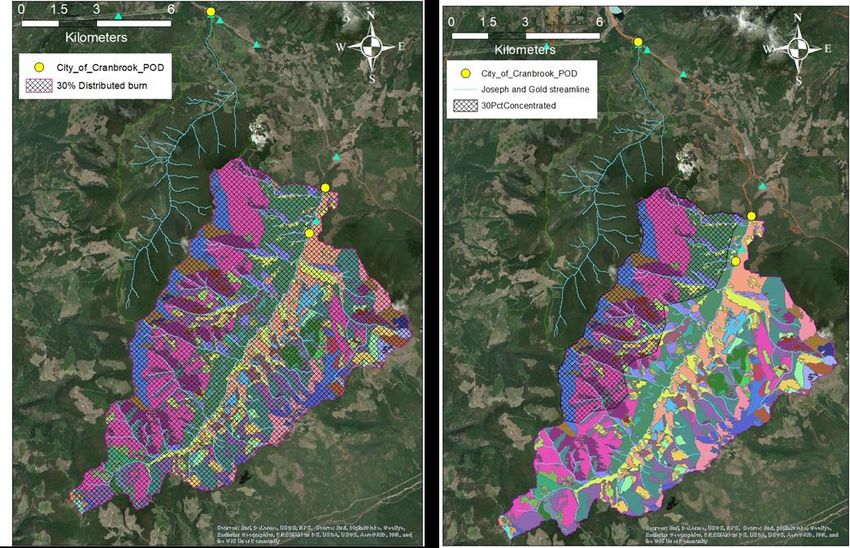
INTRODUCTION
PURPOSE
This report summarizes the results of a hydrological modeling investigation undertaken for the City of Cranbrook to
investigate the potential for the impact of climate change and wildfire on the volume and timing of flows and the
frequency of floods in Gold Creek and Joseph Creek.
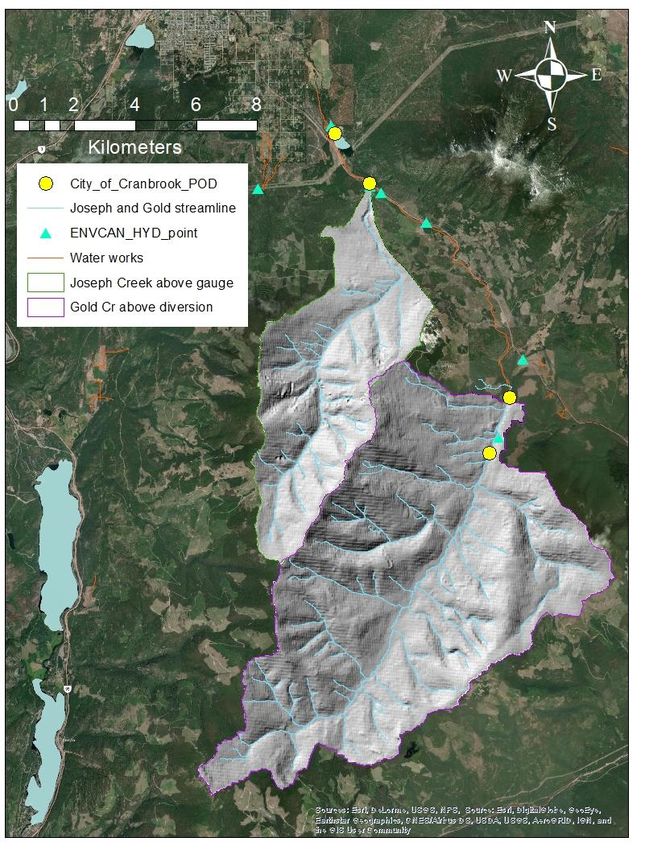
The City of Cranbrook relies on Joseph and Gold creeks for its main water supply and supplements from three
groundwater wells to meet higher summer water demand. Surface runoff from Joseph Creek and the upper portion
of Gold Creek are captured by the City’s
water works and fed into a storage
reservoir (northernmost POD, Figure 1).
Below this point the overflow continues
through the City of Cranbrook in the Joseph
Creek channel.
Climate-related events like flooding,
drought and high temperatures can be
critical events for communities and are
examples of events that are projected to
occur with greater frequency and/or
intensity as the climate gets warmer.
Flooding poses a risk to water
infrastructure, public safety, and
contributes to turbidity in surface sources.
Drought has implications for water supply,
local food production and increasing
wildfire risk. Higher temperatures can
impact vulnerable populations, including
the elderly, socially isolated, chronically ill
and infants.
The information presented in this report is
intended to investigate potential trends
and impacts related to the scenario of a
changing climate and wildfire on flooding,
flow volume and timing in order to inform
local planning and decision-making.
Figure 1: Joseph Creek and Gold Creek catchment areas that
contribute to the City of Cranbrook water supply. STUDY AREA
Gold and Joseph creeks are located
roughly 10 kilometers south of the City of Cranbrook. For this study the physical attributes of these watersheds are
defined on the basis of the location of the City of Cranbrook’s water discharge gauging sites. Joseph Creek has a
catchment area of 50.7 Km2 and an elevation range between 1116 meters and 2137 meters while Gold has a
catchment area of 94.1Km2 and ranges in elevation from 1300 to 2166 meters (Figure 2).
A comparison of the hypsometric curves for these watersheds in Figure 2 shows that Joseph Creek has a broader
elevation range but overall, the contributing area is substantially lower in elevation than Gold Creek.
1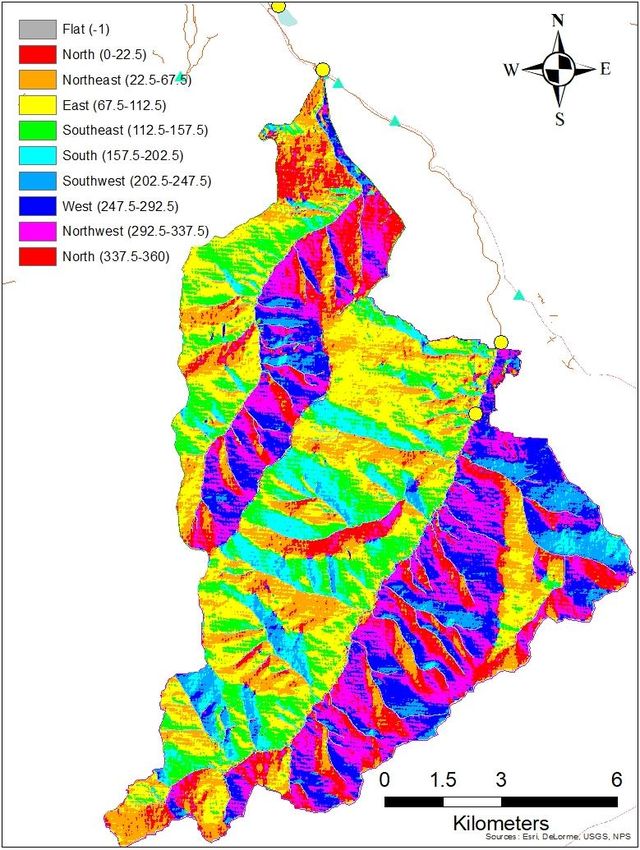
Figure 2: Hypsometric curves for Joseph Creek and Gold Creek showing the distribution of watershed area in
percent by elevation

Both watersheds flow northeastward and the aspect distribution of slopes is predominantly northwest to west and
southeast to east (Figure 3).

Figure 3: Aspect distribution of Joseph and Gold Creek shows that slopes are predominantly northwest to west (pink
to blue) and southeast to east (green/yellow)

                                                                                                                  2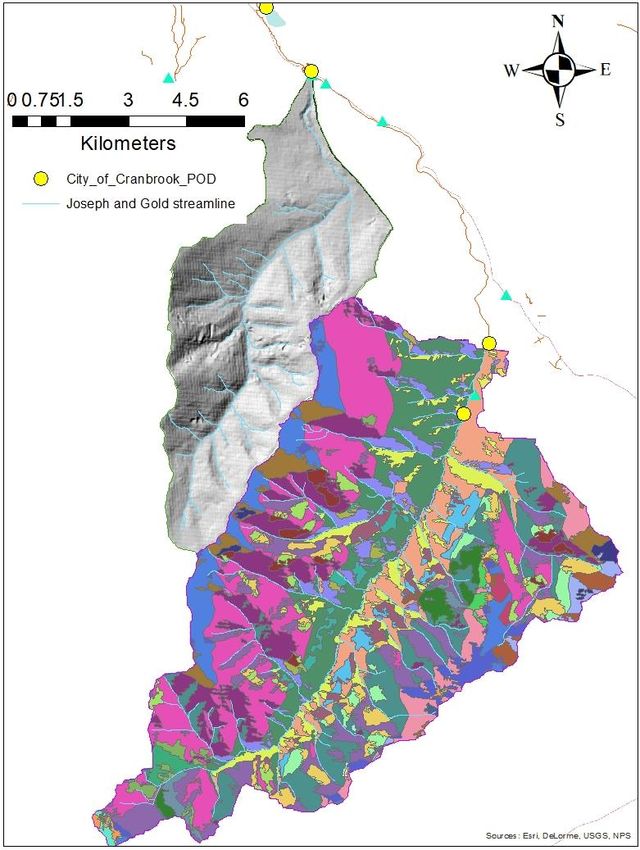
Annual precipitation in Joseph and Gold creeks estimated from climate normal (1981 – 2010) ranges from just over
600mm at the lower elevations of Joseph Creek to just over 1000mm at the upper elevations of Gold Creeki.
According to long term meteorological data from the Cranbrook Airport weather stationii, the wettest months of the
year are May and June when the majority of precipitation falls as rain while the driest months are February and
October (Figure 4).

Figure 4. Temperature and precipitation normal for 1981 to 2010 for Cranbrook Airport weather station
(https://climate.weather.gc.ca/climate_normals/)

METHODS
Hydrological Modeling
The hydrological model used in this study is referred to as a lumped hydrological model and is an adapted version of
the HBV-EC model, emulated within the Raven Hydrological Modelling Framework version 3.0 (Craig et al., 2020).
The HBV-EC model simulates streamflow and other hydro-climatic variables (i.e. snowmelt, evaporation, etc.) at a
daily timestep from 2001-2020. The model creates a virtual watershed and spatially distributes daily minimum and
maximum air temperature and precipitation from the nearby Environment Canada Cranbrook Airport weather
station (Station 1152105, Latitude 49.61° N | Longitude 115.78° W). The model accounts for water storage in the
form of snow or rain, and simulates major hydrological processes including canopy interception, snow accumulation
and melt, evaporation, soil infiltration, percolation, interflow, baseflow, as well as runoff (see Craig et al., 2020).

Data
We delineated the Gold Creek and Joseph Creek watersheds upstream from the City of Cranbrook’s hydrometric
station locations (Figure 1) using a digital elevation model. For input to the hydrological model, the two watersheds
were discretized into hydrological response units (HRUs) based on overlaying elevation bands, aspect, and land
cover (Figure 5). Specifically, the watersheds were divided into three elevation bands (1879m) using the 20-meter BC provincial digital elevation model (DEM). Land cover information was obtained from
the B.C. provincial Vegetation Resource Inventory (VRI) database and reclassified into 3 classes based on years since
harvest which included clearcut (60 years).

i    https://data.pacificclimate.org/portal/bc_prism/map/
ii   https://climate.weather.gc.ca/climate_normals/
                                                                                                                      3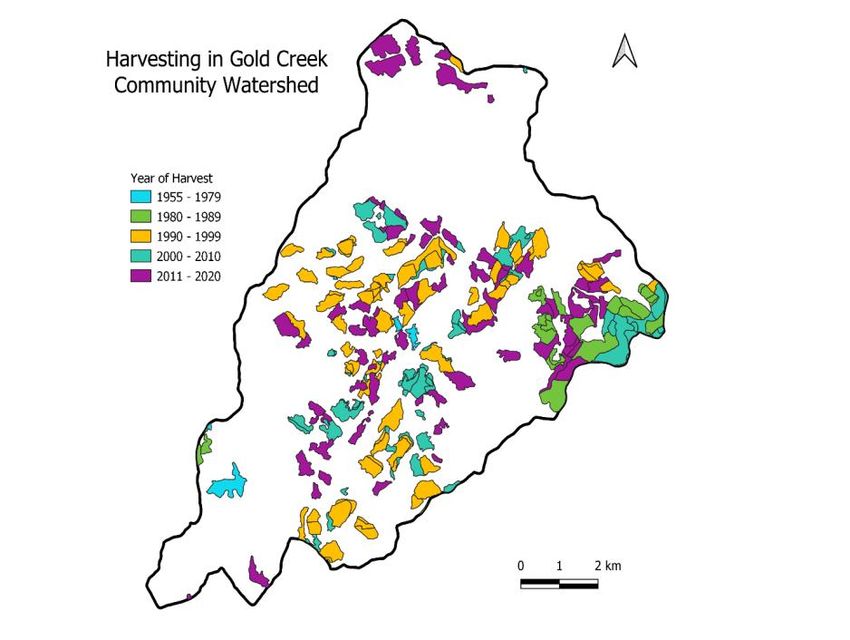
Figure 5: Gold Creek showing delineation of hydrological response units (HRUs)

Daily mean streamflow (m3/s) data from 2001 to 2020 for both Joseph Creek and Gold Creek were obtained from
the City of Cranbrook hydrometric stations. The model was calibrated and verified using daily air temperature and
precipitation observations from the Cranbrook Airport weather station and snow water equivalent observations
were obtained from the Moyie Mountain snow pillow site. The climate data from several nearby stations were also
used to improve temperature and precipitation lapse rate estimates.

Model Formulation
The model spatially distributed daily minimum and maximum air temperature and precipitation across the
catchment using inverse-distance weighting. Water, delivered as precipitation is intercepted by and/or passed
through the forest canopy to the soil surface as rain or snow depending on the temperature.
Snow accumulated in the HRUs during the winter months and then melted according to a spatially corrected
temperature index model, which has been shown to perform well over a variety of regions and environments at a
daily time step (Hock, 2003; Jost et al., 2012). Rain and snowmelt then infiltrated into the three-layer soil model,
where it was able to move upward by capillary rise and downward by percolation. Water returned to the surface (in
the stream channel) via interflow from the middle soil layer which had a faster response and from the deepest soil
layer, which had much slower baseflow response. The model algorithms are listed in Table 1.

                                                                                                                   4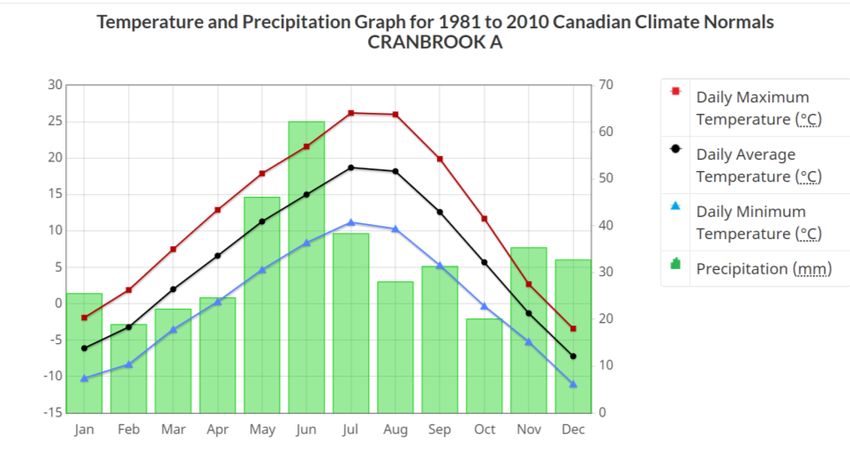
Table 1: Algorithms used to represent hydrologic processes in the model. All algorithms are documented in the
Raven User’s Manual (Craig et al., 2020)

 Process                                                    Model Algorithm
 Potential Melt                                             HBV
 Rain-Snow Partitioning                                     HBV
 Evaporation                                                Priestley-Taylor
 Orographic Corrections                                     HBV, Simple Lapse
 Snow and Rain Interception                                 Hedstrom and Pomeroy (1998), Exponential LAI
 Canopy Evaporation                                         Maximum
 Snow Refreeze                                              Degree Day
 Snow Balance                                               HBV (Snowbal Simple Melt)
 Infiltration                                               HBV
 Soil Evaporation                                           HBV
 Capillary Rise                                             HBV
 Percolation                                                Constant
 Interflow (Soil Layer 1)                                   Power Law
 Baseflow (Soil Layer 2)                                    Variable Infiltration Capacity

Model Calibration
To best represent key hydrologic processes and streamflow, model parameters were calibrated in a stepwise
manner following Chernos et al. (2017). First, air temperature and precipitation lapse rates were calibrated to
regional weather stations, and further fine tuned to balance the water output from the system. Then snow melt
parameters are modified to follow empirical values obtained from regional snow survey and pillow observations.
Finally, vegetation interception and soil routing parameters are calibrated to streamflow observations. Calibrations
were completed by a combination of manual methods and automated calibration. Automated calibration of
parameters was completed using OSTRICH calibration software (Matott, 2005), using the Dynamically Dimensioned
Search (DDS) algorithm. Model parameters were calibrated to the 2001-2010 period. Model performance was
verified over the remaining record (2001-2020) for the Gold Creek hydrometric station.

Model Scenarios
The calibrated hydrological model was used to investigate the relative impact and sensitivity of watershed hydrology
to forest disturbance compared to the 2001 - 2010 ‘baseline’ condition. The calibrated hydrological model was used
to run two scenarios with fire related forest disturbance and one scenario with the ‘worst-case’ climate change
scenario. The forest disturbance scenarios were run over the 20-year (2001 -2020) simulation period while the
climate change scenario was run using 80-year of simulated climate data with temperature and precipitation
projected for RCP 4.5 and RCP 8.5.
These scenarios are meant to inform the City of Cranbrook regarding potential changes in flooding and water yield
and timing of runoff associated with possible future landcover and climate change. The two landcover disturbance
scenarios included the 30% disbursed burn where forest cover was removed across the full range of elevations and
aspects and the 30% concentrated burn where a large patch of forest in a potentially hydrologically sensitive area
was burned off (Figure 6). These burned scenarios also included conversion of the soil surface to impermeable
which is consistent with the hydrophobic soil conditions that occur for several years following a forest fire.

                                                                                                                       5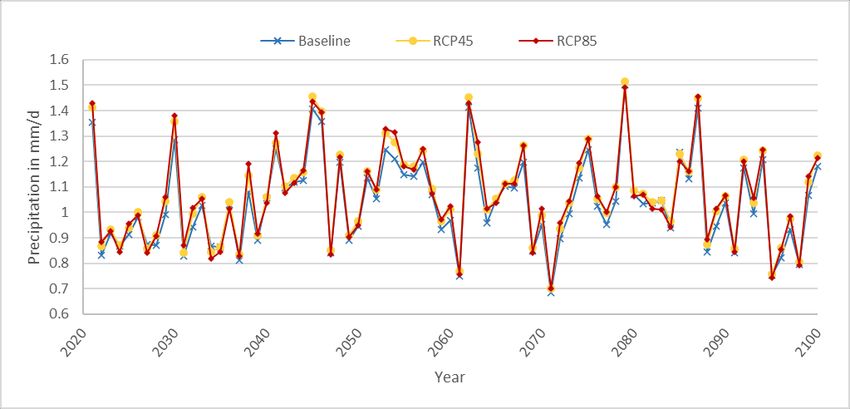
Figure 6: Land cover disturbance scenarios from forest fire with HRU base

Data Issues
As a result of initial difficulties with model calibration for Joseph Creek, a comparison of annual water yield per unit
area (i.e., normalized by watershed area) with Gold Creek and other nearby watersheds revealed substantially
lower-than-expected water yields in Joseph Creek (Figure 7).

Figure 7. Annual runoff (per km2) for Joseph Creek and nearby watersheds.
The comparison of annual unit water yield (mm3/km2 or mm) reveals that Joseph Creek discharge (orange bars,
Figure 7) is a fraction of the volume ( ~ ½ to ¼ the volume) of water per unit area compare to nearby watersheds
                                                                                                                           6
including Gold Creek and Mather Creek. It is not clear whether there is an error in the stage to discharge
relationship being used to convert water depth to discharge or, if a large volume of water is being lost from the
channel – possibly disappearing into a karsted limestone within the Kitchener Formation upstream from the
discharge gauging site. Regardless of the cause of the water loss, it is not possible to accurately model the flows in
Joseph Creek without manually adjusting inputs to reflect physically impossible conditions.
Lower-than-predicted discharges were not encountered in Gold Creek and good agreement between modeled and
observed discharge was achieved during model calibration. Consequently, this project has focussed on model
development and calibration in Gold Creek to provide information on likely watershed response for land cover and
climate change scenarios.
Climate Change Modeling
The impact of climate change is assessed by feeding the HBV-EC model climate data including precipitation and
temperature (maximum and minimum) projected to account for climate change scenarios. The projected climate
data were generated with LARS_WG6, a stochastic Climate generator. The LARS_WG6, climate model was calibrated
to the 2001-2020 baseline period using data from the Environment Canada Cranbrook Airport weather station. In
addition to the 80-year baseline climate, the climate emission scenarios RCP45 and RCP85 are generated using the
CNRM-CM5 Climate model. The stochastic model produced climate data with adjusted statistics resulting in
increasing average of the maximum and minimum temperature (Figure 8) from baseline to high emission scenario,
but with no change in standard deviation, which is probably not a realistic scenario but was the only option for the
LARS_WG6 climate generator.
Figure 8: Maximum temperature timeseries generated for the baseline, RCP45 and RCP85 climate change scenarios
The RCP 8.5 Precipitation data (Figure 9) show an increase in precipitation for portions of the year compared to the
baseline data as well as a 3% decrease in variability compared to the baseline. The RCP 4.5 scenario shows similar
increases in precipitation but marks a 1% decrease in variability. Again, the minimal change in variability for daily
precipitation data given the RCP 4.5 and RCP 8.5 climate change scenarios is probably unlikely but it is a limitation of
the projection tool.
7Figure 9: Climate scenarios for precipitation
Forest Disturbance
Both Joseph Creek and Gold Creek are forested watersheds on crown land and lie within the harvestable land base
of the Province of BC under forest license #847632 currently held by Galloway Lumber Company Ltd. (Tenure license
A19042). The Provincial VRI database indicates that harvesting has occurred in both watersheds dating back to the
1980s.
Harvesting began in the southern region of Gold Creek in 1992 and continued through to 2005. Additional
harvesting was undertaken in 2011 and has been occurring every year since to 2020. During the period of model
calibration (2001 to 2010) the area of forest disturbance associated with past logging totalled 1245 hectares or 13%
of the 9410ha watershed (all colours except purple in Figure 10). The 1992 to 2010 logging is distributed across
aspects and elevations and is unlikely to have had a measurable effect on the discharge of Gold Creek.
Figure 10: Age and extent of forest disturbance in Gold Creek to 2020
8The current level of forest disturbance in Gold Creek is 2154.3 ha or 23% of the watershed area. Some of the older
harvested stands will have some level of forest recovery so are likely no longer acting as clearcuts.
Hydrological Modeling Parameterization and Performance
Parameterization of the HBV-EC Model is provided in Table 2.
Table 2: Final model parameters used in the hydrological model.
Process Description Parameter Value Units
o
Orographic Corrections Adiabatic Lapse Rate Alapse 7.0 C/km
Precipitation Lapse Rate Plapse 2.4 mm/day/km
o
Rain-Snow Partitioning Transition Temperature Snw1 2.0 C
o
Mixed-Range Snw2 2.0 C
Snowmelt Global Snowmelt Factor K_factor 3.5 mm/ oC /day
Forest correction Forest_corr 0.75 fraction
Young_Forest correction ForestY_corr 0.85 fraction
Aspect/Slope correction Acor 0.2 fraction
Minimum Melt (winter) Min_melt 0.0 mm/ oC/day
Refreeze factor Refreeze 1.0 mm/ oC/day
Leaf Area Index* Cutblock Cut_LAI 2.5 unitless
Young_Forest ForestY_LAI 3.5 unitless
Forest Forest_LAI 3.5 unitless
Vegetation/Canopy Cutblock Cut_Cov 0.50 fraction
Coverage Young Forest ForestY_Cov 0.60 fraction
Forest Forest_Cov 0.75 fraction
Infiltration HBV Beta HBV_B0 0.025 unitless
Percolation Soil Layer 1 Perc1 4.0 mm/day
Capillary Rise Surface Soil Cap0 2.0 mm/day
Baseflow Soil 1 K Base_K1 0.33 unitless
Soil 1 N Base_N1 0.66 unitless
Soil 2 N Base_N2 2.0 unitless
Soil 2 Max Rate Base_MAX2 22 mm/day
*Indicates maximum annual LAI value; Cutblock values vary seasonally with lower values during the winter.
Simulated snow water equivalent showed relatively good performance when compared to observations at the
Moyie Mounatain snow pillow. Snow water equivalent is under-estimated at all three survey/pillow sites, with bias
ranging from -10 to - 21%, but displays a good correlation with observations (r2 = 0.81 to 0.0.9, Table 3). These
meteorological verification statistics suggest that snow accumulation is well represented by the model.
Table 3: Meteorological verification statistics for the full simulation period (1990-2019).
Site Period Years N PBIAS r2
Gold Calibration 2001-2010 2648 -21 0.9
Gold Verififcation 2011-2020 3500 -11.9 0.81
Gold All 2001_2020 6148 -15.8 0.84
Note: N is the number of observations evaluated, PBIAS is the percent bias, and r2 is the Pearson correlation coefficient
The model displays good performance at reproducing daily streamflow for hydrometric gauge used in this study
(Table 4, Figure 11). Performance is best for the calibration period with daily Nash Sutcliffe Efficiency (NSE) and Kling
Gupta Efficiency (KGE) values in the range of 0.73 to 0.84, performance is marginally worse over the verification
period with NSE and KGE values in the range 0.56 – 0.78. In all sites, simulated streamflow displayed a minimal bias,
ranging from 0.5 to 7.5%.
9Table 4: Daily streamflow performance statistics for the calibration period (2001-2010)
Site Period Years NSE KGE PBIAS
Gold Calibration 2001-2010 0.73 0.84 7.5
Gold Verififcation 2011-2020 0.56 0.78 0.45
Gold All 2001_2020 0.67 0.82 6.2
Note: NSE is the Nash-Sutcliffe Efficiency, KGE is the Kling-Gupta Efficiency, and PBIAS is the percent bias
Figure 11: Average daily streamflow for Gold Creek used in model evaluation over the study period (2001-2020). The
solid line corresponds to the average streamflow, while the shaded areas correspond to the 10 and 90% quantiles.
Qualitatively, the model does a reasonable job at reproducing the timing and magnitude of spring runoff. Although
snowmelt timing is slightly advanced the rate of runoff is generally well reproduced. In addition, low streamflow is
well reproduced. Streamflow during the late summer and fall period (August – October) is somewhat over-
estimated while winter streamflow (November -March) is somewhat under-estimated. Overall, the inter-annual and
daily variability in flow is well reproduced, following the character of the observed hydrographs.
OUTCOMES
EFFECTS OF LAND COVER CHANGE SCENARIOS (FOREST FIRE) ON STREAM
FLOW
Peak Flows
A dispersed 30% burn disturbance causes the average annual peak flow in Gold Creek to increase by 16%. In
addition, the variability of the time series of annual peak flows changes (5%) so that lower than average peaks
decrease slightly while larger than annual peak flows increase (Figure 12). In the scenario where a concentrated 30%
of the watershed area (2890 ha) burn is situated at the upper elevations in a portion of the watershed there is a
substantially larger change in both the mean and variability of annual maximum peak flows. In this scenario the
model suggests an increase of 13% in the mean annual peak flow and an increase of 4% in the standard deviation.
This change in the frequency distribution of floods results in a shift of the 4-year return period flood becoming the 2-
year return period flood.
102.6
2.4
2.2
Discharge (cms)
2
1.8
1.6
Baseline Forest Disturbance
1.4
Burn 30 %
1.2 Burn 30% Disburst
1
1 10 100
Return Period (Years)
Figure 12: Cumulative frequency distribution of annual peak flows given the baseline, 30% concentrated and 30%
dispersed forest disturbance scenarios.
Flow Timing
In the 30% disbursed burn scenario, the model predicts an average shift to 4 days earlier in the timing of peak flows
and a return to base flows 1.5 days later than the 2010 baseline condition (Figure 13). Interestingly, according to the
model output this shift is not observed every year but only for 2 of the 20-year time series. For the 30%
concentrated burn the model predicts a shift to 1 day earlier in the timing of peak flows. Similar trends are also
observed in the shift in the timing of half flow volume.
Baseline Forest Disturbance Burn 30% Burn 30% Dispersed
180
170
160
Day in Year
150
140
130
120
110
Year
Figure 13: Change in the timing of annual maximum peak flow for the forest burn scenarios.
11EFFECTS OF CLIMATE CHANGE SCENARIOS
Peak Flows
The RCP 4.5 Scenario causes the average annual peak flow in Gold Creek to decrease by 5%. In addition, the
variability of the time series of annual peak flows increases slightly (7 %) (Figure 14). For the RCP 8.5 Climate
scenario there is an even larger decrease in the mean (10%) with no difference in the variability of annual maximum
peak flows. These changes in the frequency distribution of floods results in larger floods becoming less frequent
than currently.
2.1
1.9
1.7
Discharge (cms)
1.5
1.3
Baseline
1.1
RCP45
0.9 RCP85
0.7
1 10 100
Return Period
Figure 14: Cumulative frequency distributions for Gold Creek for the RCP45 and RCP85 as well as baseline climate
scenarios
Flow Timing
Of all the metrics investigated changes in flow timing associated with climate changes scenarios yield the greatest
changes. For the RCP 4.5 Climate Scenario the model predicts a shift to 7 days earlier in the timing of peak flows and
a return to base flows 8 days later than the 2010 baseline condition (Figure 15). For the RCP 8.5 climate scenario the
model predicts a shift of 12 days earlier in the timing of peak flows with some years up to 52 days earlier than the
climate baseline scenario (with a range of 94 days, at a 34% range increase from the baseline) and a return to base
flows 23 days later than baseline conditions (Figure 15). This trend is considered statistically significant at the 95%
confidence limit. Similar trends are also observed in the shift in the timing of half flow volume – annual half flow is
reached 7 days earlier for RCP 4.5 and for RCP 8.5 eleven days earlier compared to the baseline climate scenario.
12Baseline RCP45 RCP85
200
180
160
DAY IN YEAR
140
120
100
80
YEAR
Figure 15: Change in the timing of peak flows – relative to the baseline conditions for climate scenarios RCP 4.5 and
RCP 8.5.
DISCUSSION
The outputs of the HBV-EC model indicate that landcover disturbance from wildfire could have an immediate
increase on the magnitude of peak flows from Gold Creek but that the timing of flows is unlikely to change
substantially. Given changes in temperature and precipitation as projected with climate change within
approximately the next 60 years, it is possible that there will be a decrease in the magnitude of floods across the full
range of frequencies. In addition, the timing of peak flows and return to low flows is projected to occur substantially
earlier in the year.
The modeled and projected changes in the timing and magnitude of flows from Gold Creek have uncertainties
associated with both the HBV-EC model and the LARS_WG6 climate generator. Some of these uncertainties could be
addressed give additional time to better calibrate the model. In addition, it is recommended to investigate the use
of other climate generators that better model changes both the mean and the variability of daily temperature and
precipitation time series given RCP 4.5 and RCP 8.5 climate projections.
13REFERENCES
Chernos, M., MacDonald, R., & Craig, J. (2017). Efficient Semi-Distributed Hydrological Modelling
Workflow for Simulating Streamflow and Characterizing Hydrologic Processes. Confluence:
Journal of Watershed Science and Management, 1(3).
Craig, J. R., Brown, G., Chlumsky, R., Jenkinson, R. W., Jost, G., Lee, K., ... & Tolson, B. A. (2020). Flexible
watershed simulation with the Raven hydrological modelling framework. Environmental
Modelling & Software, 129, 104728.
Hock, R.: Temperature index melt modelling in mountain areas, J. Hydrol., 282, 104–115, 2003.
Jost, G., Moore, R. D., Menounos, B., and Wheate, R.: Quantifying the contribution of glacier runoff to
streamflow in the upper Columbia River Basin, Canada, Hydrol. Earth Syst. Sci., 16, 849–860,
https://doi.org/10.5194/hess-16-849-2012, 2012.
Matott, L. S. (2005). OSTRICH: An Optimization Software Tool; Documentation and User‘s Guide. Version
1.8, http://www.civil.uwaterloo.ca/lsmatott/Ostrich/OstrichMain.html.
14You can also read


