IBM ILOG Transport Analyst (TA) - Mozafar Hajian, Ph.D, CITP Client Technical Professional, ILOG Optimization and Supply Chain
←
→
Page content transcription
If your browser does not render page correctly, please read the page content below

IBM ILOG Transport Analyst (TA)

Mozafar Hajian, Ph.D, CITP
Client Technical Professional,
ILOG Optimization and Supply Chain

                                     © 2013 IBM Corporation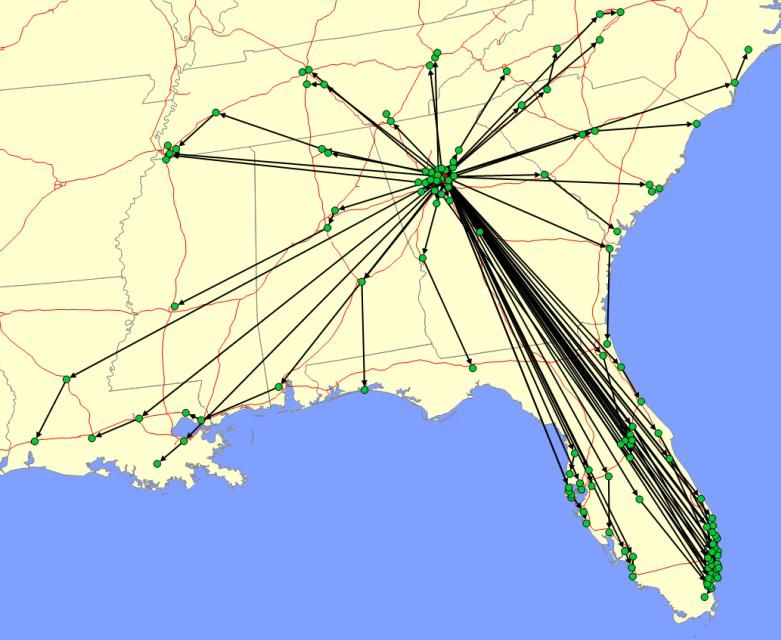
Importance of Supply Chain Planning
The majority of a supply chain’s
lifecycle costs are locked-in at
Strategic Strategic the start
Supply Chain
Planning
Such “up-front” decisions
80% include:
Tactical
Advanced Distribution network
Planning and
Scheduling Inventory Locations
MRP/ERP Supplier network
Operational
20% Inventory Levels
Execution
Logistics suppliers
Decisions Solutions Value
Source: AMR Research, BCI
2 © 2013 IBM Corporation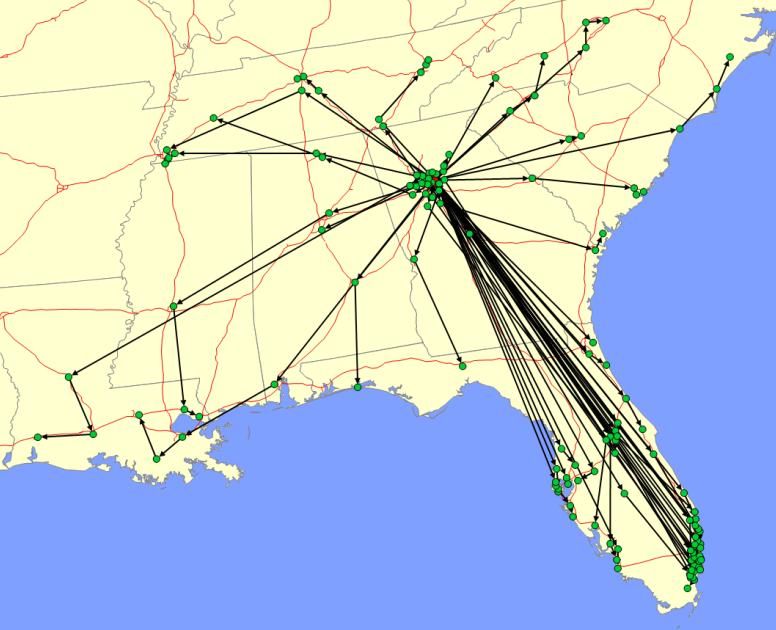
Strategic Transportation Questions
For a given set of shipments, what are the best routes?
– Can be used to set budgets and fixed routes
– To analyze different business rules– time windows, rules for service times
What are the opportunities for combining shipments and finding continuous moves?
Which shipments should use private fleet? Commercial truckload? LTL?
What should the fleet size be?
What is the impact of backhauls? How can running inbound and
outbound transportation together save additional money?
How should hubs be used?
After the re-design of a supply chain, how are the routes,
multi-stops, and transportation operations impacted?
What is the carbon footprint of the transportation?
3 © 2013 IBM Corporation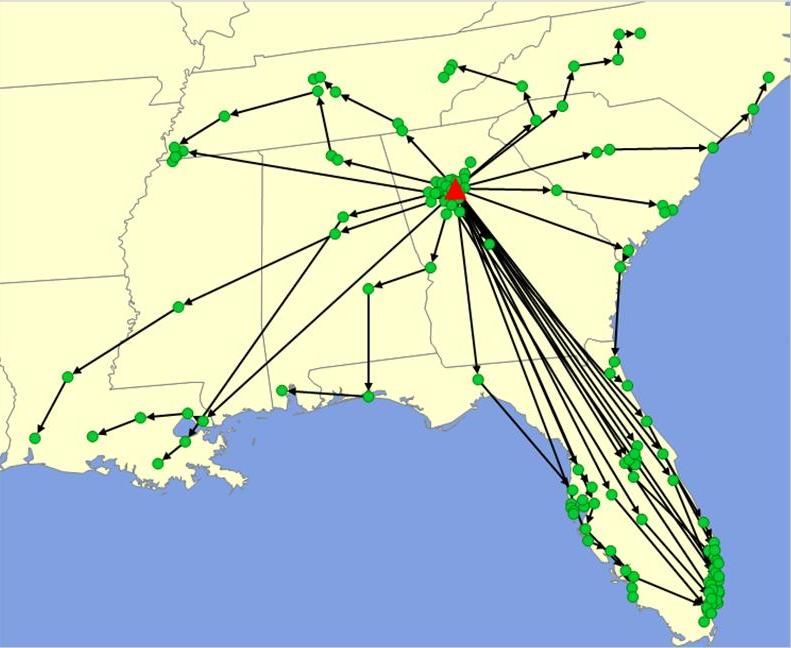
What Transportation Analyst CAN do...
Create Optimal Fixed Routes
– Optimal Delivery Routes for a set of repeatable outbound shipments
– Optimal Inbound Supply Routes to Plants on a continuous basis
– Optimal Frequency of Routes
Estimate Transportation Budget for Actual or Forecasted Set of Shipments
– Cost to Service a Potential New Client’s Business - Quote(3PL)
– Increased Cost to Add Service to a New Customer to an Existing Network
– Transportation Costs for Company’s Ongoing Budgeting Process (By division or overall)
Find Opportunities to Maximize use of Available Assets (Vehicles – Tractor and Trailer
Together)
– Continuous moves (LTL to Multi-stop Truckloads, or better Utilization of Multi-Stop
Truckloads in General)
– Backhaul /Roundtrip Opportunities
– Best Assignment of Fleet Assets across Multiple Base Locations
Determine Best Mode to Deliver Shipments (LTL, Commercial TL, Private Fleet)
Find Opportunities for Savings from the use of Consolidation/Deconsolidation Locations
– Pinpoint Shipments which Benefit from These Opportunities
– Selects best Hub Location per Shipment
Efficiently simulate What If Scenarios for Key Routing Network Variable Changes
– Widening/Tightening of Availability Calendars and/or Delivery Appointments
– Differing Rules of Service (Drive vs Rest Time)
– Changes in Fuel Surcharges
4
© 2013 IBM Corporation
What Transportation Analyst DOESN’T do…
Street Level Routing
– No Left Turn Studies
– Driving Directions as part of solution
– Milk Truck runs strictly within one city limit
Fleet Management
– Track Tractors and/or Trailers separately from each other in scheduling
– Specifically scheduling each vehicle by plate number within the model
Intermodal Routing System
– Routes truck to Ocean/Air back to truck
– Selects Appropriate Ports of Entry and Exit (This can be done in LNP XE)
Real Time Dynamic Routing
– Systems used to Create Feasible New Routes Every Day for Orders Loaded in Real Time
Load Building
– Visual on Order of Loading and Position of each Order within the Four Walls of a Trailer
Transportation Management System
– Freight Payment System
– Booking Document/BOL Creation and Customs Clearance Paperwork System
– GPS Real Time Tracking of Assets and Transport Alerts
– Day to Day Transactional Data Store and Carryover
5
© 2013 IBM Corporation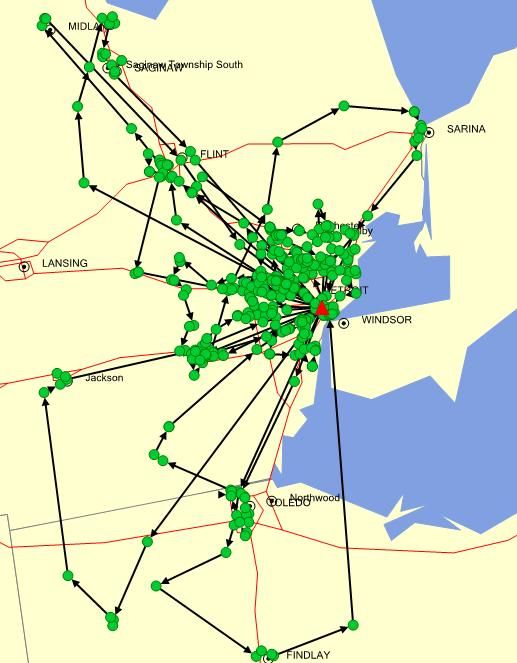
IBM Sterling and ILOG combined for Transportation Excellence
Sterling TMS and Supply Chain Visibility
- Provides daily management of transportation planning,
load building, and tracking of shipments at the tactical level
- Provides ongoing/real time tracking of orders, shipments,
and inventory across your global trading partner networks
ILOG Transportation Analyst
- Provides robust optimization of strategic transportation
questions surrounding optimal route design, fleet sizes,
backhaul opportunities, time windows and much more
- The results from these studies may then be fed back into
the TMS applications to be used as guidance/constraints in
daily transportation management
Using IBM Sterling TMS in conjunction with IBM ILOG
Transportation Analyst enables transportation providers
and shippers to make both long-term (strategic) and short-
term (tactical) decisions while continuously improving
operational efficiency, reducing costs and ultimately
enhancing the overall customer order fulfillment
experience.
© 2013 IBM Corporation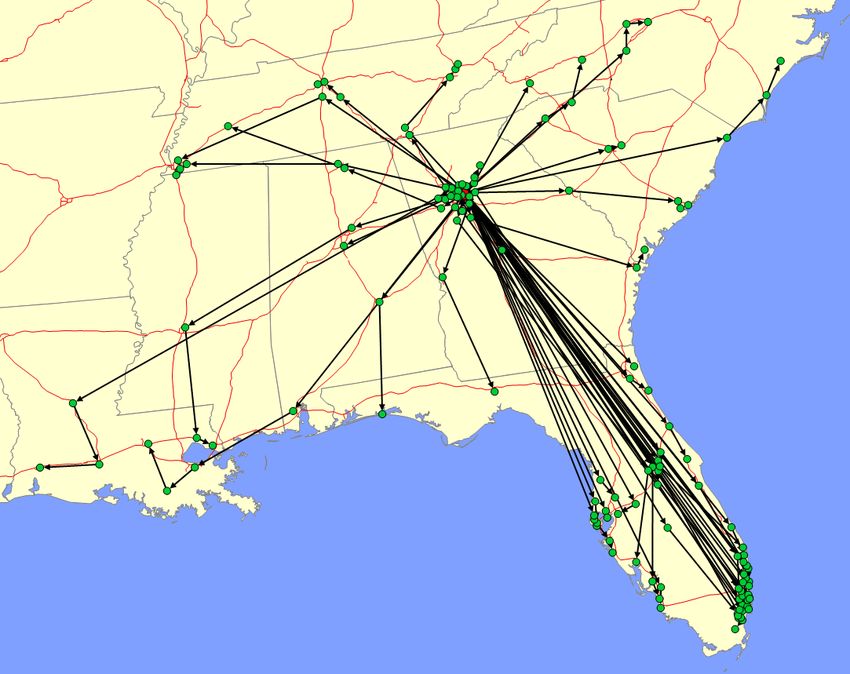
Transportation Analyst Optimization Types: Use Cases

1. Route Optimisation

2. Transportation Mode Selection

3. Backhaul Analysis

4. Hub Analysis

                                                       © 2013 IBM Corporation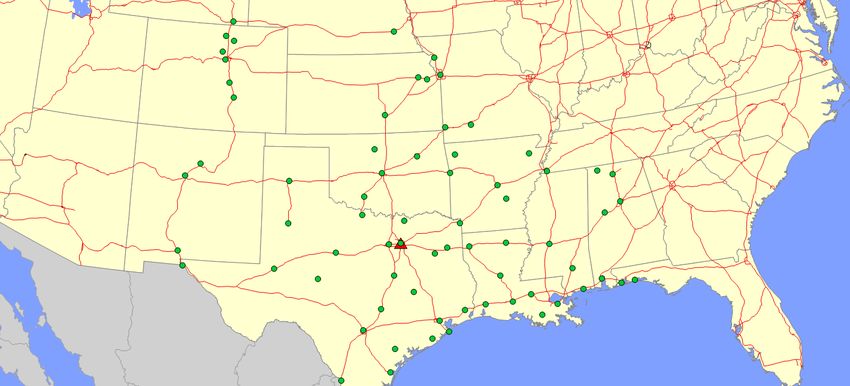
1. TJX Transportation Analyst for Route Optimization
A retailer was manually planning their current fixed routes outbound
from their Depots to Store locations handled by commercial TL
Carriers
Management was interested in determining whether planning this
with Transportation Analyst could produce more optimal routing
operations
Other Considerations Included:
– What is the affect of the frequency of running these routes and what
frequency is optimal?
8 © 2013 IBM Corporation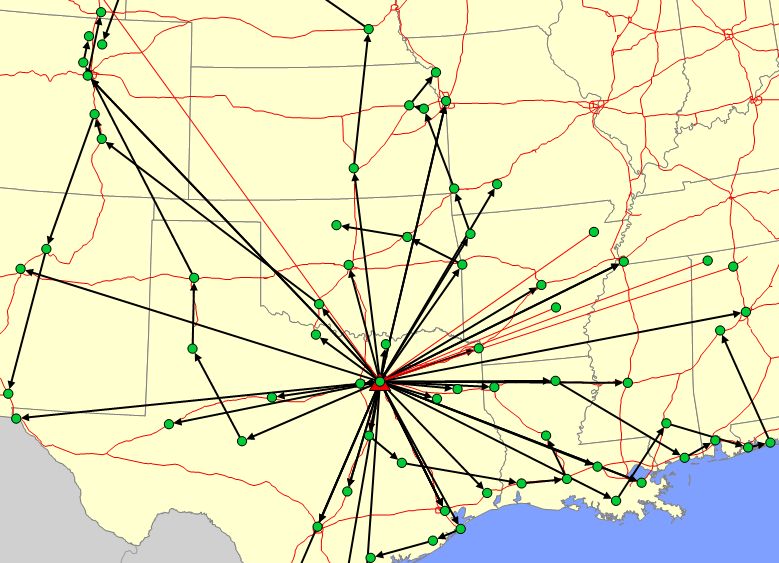
1. Transportation Analyst for Route Optimization
    Baseline

               Total Cost: $170,374
               Total Miles Travelled: 63,448
               Number of Trucks Utilized: 135

9                                                  © 2013 IBM Corporation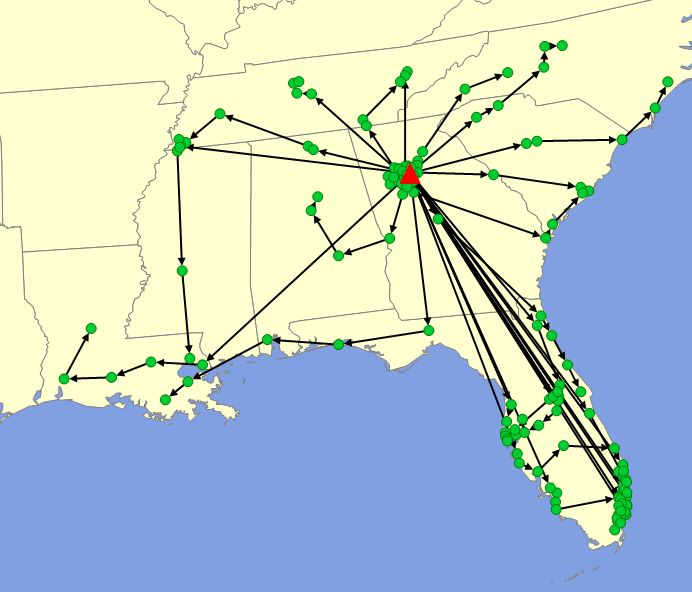
1. Transportation Analyst for Route Optimization
 Optimized Baseline
                                        Although more Min Charges are
                                        assessed significant savings in
                                         Mileage and Drop-off Charges
                                          creates this optimal solution

       Baseline Routes

                                                               11%
                                                             Weekly
                                                             Savings

       Optimized Routes

10                                                                © 2013 IBM Corporation
1. Transportation Analyst for Route Optimization
Results: Frequency Assignments
The solver determines that running
more efficient (less miles) routes
less times per week is a more cost
optimal solution than their baseline
route structures...
Optimal Frequency Results
Follow-up Analysis: This
company then evaluated the trade-
offs between this new structure
and additional inventory and
service concerns
11 © 2013 IBM Corporation2. Transportation Analyst for Mode Selection
Many companies ship via one mode at all times
– All LTL or FTL normally
Considerable savings may be found by determining whether these
companies can save money by doing a mix of LTL, FTL and Multi-
stops
Other Considerations Included:
– Many what if scenarios are run surrounding these types of studies as
well, such as what if we expand time windows, what if we have different
constraints surrounding max stops for a vehicle, etc?
12 © 2013 IBM Corporation2. Transportation Analyst for Mode Selection
Mode Selection
© 2013 IBM Corporation2. Transportation Analyst for Mode Selection
Max Stops Results
No Max Stops Max Stops = 5
Costs go up to $22,578 and we now use 19 vehicles
© 2013 IBM Corporation3. Backhaul Analysis: Current Situation
Outbound Shipments
Inbound Shipments
Currently they route both of these
networks separately, therefore
encountering some empty backhaul
(deadhead distance) which is costly to a
company
© 2013 IBM Corporation3. Backhaul Analysis: Current Situation
Current Costs of Two Separate Networks
Total $27,449
© 2013 IBM Corporation3. Backhaul Analysis
Run Together
© 2013 IBM Corporation3. Scenario Analysis and Savings
Solution Costs
15%
Shipped separately Combined Savings
Total $27,449
© 2013 IBM CorporationBasic Case Study - Network Design Solution
Opens four additional
distribution locations:
• Sacramento
• Phoenix
• Houston
• Orlando
Total Cost: $63,000,000 9% Reduction
Average Distance to Customers: 330 miles 56% Reduction
ILOG, All rights reserved 19
© 2013 IBM Corporation4. . Retail Store Delivery Routing by Pool Point Location
Project Background
A retail company set out to model optimal routing from each pool
point within their network on a weekly basis
Management was also interested in determining the optimal
frequency of running each of these routes
– They further examined how operations may need to be altered during peak vs off
peak seasons of demand
They were using all commercial truckload transportation
– For retailers with a dedicated fleet, backhaul becomes much more important
and studies such as this can force the return of all vehicles to the origin
20 © 2013 IBM Corporation4. Retail Store Delivery Routing by Pool Point Location:
Optimal Static Routes
Off Peak Season Peak Season
Total Miles Travelled: 13,749 Total Miles Travelled: 14,521
Number of Trucks Utilized: 29 Number of Trucks Utilized: 29
Although the same number of vehicles are used in optimal routes
during peak season, vehicle capacity is more fully utilized and the
number of stops each vehicle makes increases
21 © 2013 IBM Corporation4. Retail Store Delivery Routing by Pool Point Location:
Optimal Frequency of Routes
Gantt Charts also display
the optimal route along with
the optimal frequency per
week they should deliver to
the stores on that route
This study found that most
routes to stores should make
deliveries twice a week
22 © 2013 IBM CorporationYou can also read