IEB Report 4/2020 Poverty in Spain and Europe. Effects of COVID-19 . 4
←
→
Page content transcription
If your browser does not render page correctly, please read the page content below

IEB Report 4/2020
Poverty in Spain and Europe. Effects of COVID-19 ............ 4
Poverty in Spain and Europe. Effects of COVID-19 Núria Bosch
The Potential Consequences of COVID-19 on Poverty Luis Ayala Cañón
Income Mobility and Economic Wellbeing Elena Bárcena and Olga Cantó Sánchez
Poverty in Europe: A Hard-to-Measure Phenomenon Conchita D’Ambrosio and Vincent Vergnat

La pobreza en España y Europa. Efectos de la COVID-19....... 18
La pobreza en España y Europa. Efectos de la COVID-19 Núria Bosch
Las posibles consecuencias de la covid-19 sobre la pobreza Luis Ayala Cañón
Movilidad de ingresos y bienestar económico Elena Bárcena y Olga Cantó Sánchez
La pobreza en Europa: un fenómeno difícil de medir Conchita D’Ambrosio y Vincent Vergnat

La pobresa a Espanya i Europa. Efectes de la COVID-19 ..... 32
La pobresa a Espanya i Europa. Efectes de la COVID-19 Núria Bosch
Les possibles conseqüències de la covid-19 sobre la pobresa Luis Ayala Cañón
Mobilitat d’ingressos i benestar econòmic Elena Bárcena i Olga Cantó Sánchez
La pobresa a Europa: un fenomen difícil de mesurar Conchita D’Ambrosio i Vincent Vergnat
Editorial Board: Núria Bosch (Director), Alejandro Esteller-Moré, Pilar Sorribas-Navarro
Coordination and Supervision: Institut d’Economia de Barcelona (IEB)
Design and graphic production: Digital Dosis and EPA Disseny S.L.
Translation: Language Services of the University of Barcelona / Anna Arnall
Legal deposit number: B.- 24280-2013
ISSN: 2339-7292

Consejo de redacción: Núria Bosch (Directora), Alejandro Esteller-Moré, Pilar Sorribas-Navarro
Coordinación y Supervisión: Institut d’Economia de Barcelona (IEB)
Diseño y producción gráfica: Digital Dosis y EPA Disseny S.L.
Traducción: Servicios Lingüísticos de la Universidad de Barcelona / Anna Arnall
Depósito legal: B.- 24280-2013
ISSN: 2339-7292

Consell de redacció: Núria Bosch (Directora), Alejandro Esteller-Moré, Pilar Sorribas-Navarro
Coordinació i Supervisió: Institut d’Economia de Barcelona (IEB)
Disseny i producció gràfica: Digital Dosis i EPA Disseny S.L.
Traducció: Serveis Lingüístics de la Universitat de Barcelona / Anna Arnall
Dipòsit legal: B.- 24280-2013
ISSN: 2339-7292

Institut d’Economia de Barcelona (IEB)
Universitat de Barcelona
Facultat d’Economia i Empresa c/ John M. Keynes, 1-11
08034 Barcelona, Spain
www.ieb.ub.edu

© Institut d’Economia de Barcelona (IEB) / Instituto de Estudios Fiscales (IEF)
IEB Report 4/2020
IEB Report 4/2020

Poverty in Spain and Europe. Effects of
COVID-19
The Barcelona Economics Institute (IEB) is a research centre    Sustainability) and the UB’s Chair on Urban Economics
whose goals are to promote and disseminate work in              City of Barcelona.
economics and to contribute to the debate on economic
policy decision-making.                                         In addition to undertaking academic research, the IEB aims
                                                                to bring the findings of its work to a wider audience by
The members’ research is conducted primarily in the fields      organizing symposiums and workshops, and by publishing
of fiscal federalism; urban economics; transport economics      a variety of documents, including an annual Report on
and infrastructure; tax system analysis; public policies; and   Fiscal Federalism and Public Finance. The IEB Report that
energy sustainability.                                          the reader has in their hands represents a recent initiative
                                                                to increase the frequency of publication of this Report so
Founded in 2001 within the University of Barcelona (UB),        that the IEB can respond better to changing economic
and recognised by the Catalan Government, the IEB               circumstances.
received a major boost in 2008 with the creation of the IEB
Foundation (in which Abertis, la Caixa, Naturgy Energy,
Saba, the Barcelona City Hall, the Barcelona Metropolitan
Area, the University of Barcelona, the Autonomous
University of Barcelona, the Barcelona Provincial Council,      The opinions expressed in the Report do not
Agbar and Cuatrecasas are all active participants). The         reflect the views of the IEB.
IEB also hosts the Chair of Energy Sustainability at the UB
(funded by the Foundation for Energy and Environmental          For more information www.ieb.ub.edu
Poverty in Spain and Europe. Effects of COVID-19
Núria Bosch
Institut d’Economia de Barcelona (IEB)
Universitat de Barcelona
Poverty in Spain and Europe. Effects of
COVID-19
Unfortunately, we can find pockets of poverty, inequality most commonly used to measure poverty and inequality, as
and social exclusion even in the midst of the most developed well as their results in European countries.
countries; those that have the most consolidated level of
wellbeing. This IEB Report analyses the current situation The first contribution is by Luis Ayala. He reports that the
of poverty in Spain and Europe. Although the differences percentage of households without income rose suddenly
between countries are notable, poverty is a plague that in the first one hundred days of the pandemic. He also
affects all of them. indicates that the pandemic halted the poverty reduction
process before we could reach the levels that existed prior
Many societies had not yet recovered from the 2008 reces- to the recession in 2008. The main danger of the incidence
sion when the COVID-19 pandemic had another negative of the pandemic on poverty is that it leads to structures of
impact on poverty and inequality. The FOESSA 2020 re- risk, that is, lasting poverty. Therefore, we can predict that
port warns that the pandemic has wiped out the effect of the exit from the crisis will not be in the form of a V.
the recovery in just a few months, and figures are back to
the level of the worst point in the last recession. According Through a dynamic analysis of family income, the contri-
to the report, today three out of every ten people in severe bution by Elena Bárcena-Martín and Olga Cantó identi-
exclusion lack any form of income. fies the individuals who experience greater changes and
their demographic and socioeconomic characteristics. The
However, it is important to highlight the role of current social youngest individuals are the most vulnerable to the impact
protection systems in the fight against poverty. As Aspachs of the economic crisis, due to the lack of public policies that
et al. (2020) stated, “the social protection systems of the ensure a minimum income. In addition, individuals with a
past were a far cry from the mechanisms provided by the higher education level have greater income stability. Con-
modern welfare state”. The decisive response in terms of sequently, more should be spent on public education. They
public policies to reduce poverty and inequality should be conclude that the COVID-19 crisis probably has a greater
considered. Aspachs et al. (2020) found that in Spain the impact on young people and on many families with young
percentage of people with no income increased 15 per- children that are already vulnerable.
centage points between February and April 2020, before
considering transfers from the public sector. However, when The third contribution by Conchita D’Ambrosio and Vincent
public transfers are considered, the percentage of people Vergnat measures the poverty in European countries using a
with no income increased only 7 percentage points. series of indicators. The definition and measurement of pov-
erty is a complex issue, which varies over time and between
In this IEB Report, we first analyse the effects of COVID-19 geographic areas. The most commonly used indicator in the
on poverty in Spain. Second, we examine how income EU is the at-risk of poverty rate (AROP), which is the percent-
mobility affects economic wellbeing, in reference to Spain. age of individuals with an equivalised household income
Finally, the third contribution describes the indicators that are that is below 60% of the median equivalised income in the
IEB Report 4/2020 5country. In 2018, this rate in the EU was 17.1%. This mone- tary indicator must be complemented by other non-monetary indicators such as that of severely materially deprived peo- ple, which indicates the proportion of the population that cannot afford at least four of the services and goods that are considered essential from a list of nine. At European scale, this indicator was 5.9% in 2018. D’Ambrosio and Vergnat conclude that, although Europeans have increasing access to goods and services that enable more adequate living conditions, the percentage of individuals with low income is tending to increase. In conclusion, the studies presented in this report indicate that, despite our countries’ social protection systems, broad- er, more generous public policies are still required to reduce the impact of the economic cycle on the most vulnerable families. References Aspachs, O.; Durante, R.; Graziano, A.; Mestres, J.; Mon- talvo, J.G. and Reynal-Querol, M. (2020): “L’impacte de la COVID-19 sobre la desigualtat a Espanya”. Informe Mensual de CaixaBank Research, 450, 29–40. Fundación FOESSA (2020): Distancia social y derecho al cuidado. Fundación FOESSA, Madrid. 6 IEB Report 4/2020
Poverty in Spain and Europe. Effects of COVID-19

                                                            Luis Ayala Cañón
                                                            UNED
                                                            EQUALITAS

                                     The Potential Consequences of
                                     COVID-19 on Poverty
                                     Without a doubt, one of the most significant of the imme-             increasing evidence of the impoverishment of large parts
                                     diate social effects of Covid-19 is the increase in social            of the population can also be seen, as this profound shock
                                     needs, and specifically situations of a lack of income in             has revealed the reality of the labour market, with a high
                                     households. Information is not yet available from the main            number of employees on very short contracts, low salaries
                                     official surveys for the first quarter of 2020. However, the          and limited access to the social benefit system.
                                     extent of the decline in economic activity and the known re-
                                     sponse of inequality and poverty indicators when unemploy-            Given the known evolution in income distribution in the long
                                     ment rises (Ayala et al., 2017; Bárcena-Martín and Cantó,             term, one of the main causes of concern about the conse-
                                     2020) make it possible to predict an impact of great mag-             quences of the pandemic is that the temporary increase in
                                     nitude. As some studies have begun to show, the widening              the incidence and intensity of poverty could have lasting
                                     of income differences between households seems inevita-               effects. However, it is not easy to predict the potential be-
                                     ble (Palomino et al., 2020). This is mainly due to a very             haviour of poverty in response to changes in the econom-
                                     unequal distribution in the loss of hours worked. Indirect,           ic cycle using the normal indicators of relative poverty, in

                                     Graph 1. Evolution in the percentage of households in which all members of the active population are unemployed
                                     and the percentage of households with no income
HHs, active members are unemployed

                                                                                                                                                                     HHs, without income

                                                                           HHs, active members are unemployed         HHs, without income

                                      Source: Compiled by author using the Economically Active Population Survey (Spanish National Statistics Institute [INE])

                                     IEB Report 4/2020                                                                                                                            7
which the threshold changes when income changes. One increase in unemployment was ten times greater in the most
possible approach that avoids the sensitivity of the thresh- vulnerable families, with a very negative impact on those
old to changes in cycle is to take as a reference the per- that depended on informal employment.
centage of households without income. This percentage is
reported by the Survey of the Active Population (EPA) and In any case, the pandemic halted the poverty reduction pro-
could be interpreted as an indicator of severe poverty. The cess before it could reach the levels that existed prior to the
EPA can also be used to calculate the percentage of house- 2008 recession. Graph 2 shows the most common indica-
holds in which all active members are unemployed, which tor of (relative) poverty. As can be seen, in 2019, when
is one of the variables that best predicts monetary poverty. the number of years of recession was equal to the number
As shown in Graph 1, the percentage of homes without of years of recovery, the rate of monetary poverty was one
income increased suddenly in the first one hundred days of point higher than it had been prior to the recession. The halt
the pandemic, which include the last two weeks of the first in the poverty reduction process after the increase in poverty
quarter of 2020 and the entire second quarter. In contrast, caused by the 2008 recession is clearest in the indicator of
the recovery of activity in the summer led to a rapid drop in households without income. In the quarter before the pan-
the volume of households in this situation, although this was demic, this value was still 80% higher than in 2007.
insufficient to compensate for the previous growth.
One of the risks of the pandemic is therefore that the in-
This reduction was not observed in households in which all crease in poverty will lead to structural forms of this risk. In
active members were unemployed, whose volume contin- this regard, the experience of previous recessions could be
ued to increase in the third quarter of 2020, although at a illustrative. Between 1992 and 1994, the unemployment
more moderate pace than in the first months of the pandem- rate rose from 14.4% to 22.0%, which caused a rapid in-
ic. The long-term evolution of this variable seems to suggest crease in the percentage of households without income (from
a delay between its growth and severe poverty. Therefore, 1.7% to 2.3%). When unemployment began to increase at
it can be expected that without a rapid change in the rising the close of 2007, ending a long process of continuous,
trend, drops in poverty would be unlikely. This seems to be intense growth in employment (the unemployment rate had
confirmed by the data of some social organisations based dropped from the aforementioned 22% to 8%), the levels of
on the profiles and volume of households requesting services severe poverty prior to the recession of 1992–1994 had
and benefits. In June, Cáritas (2020) published a first report not yet been recovered. The asymmetrical nature of the ef-
on the impact of the COVID-19 crisis on families supported fects of the economic cycle on inequality and poverty, with
by this organisation. The report shows that the impact of an rapid growth in recessions and much more gradual drops in
Graph 2. Evolution in the relative poverty rate (threshold: 60% of the median income per adult equivalent)
23
22
21
20
19
18
17
16
15
04 05 06 07 08 09 10 11 12 13 14 15 16 17 18 19
Source: Compiled by author using the Economically Active Population Survey (Spanish National Statistics Institute [INE]).
8 IEB Report 4/2020expansions, means that we can predict that for a significant Palomino, J.C.; Rodríguez, J.G. and Sebastián, R. (2020):
proportion of the population the exit from this crisis will not “Wage inequality and poverty effects of lockdown and
be in the form of a V. social distancing in Europe”. European Economic Re-
view, 129, 1-25.
Furthermore, the evolution of poverty has two worrying char-
acteristics that the pandemic could worsen and that require Vaalavuo, M. (2015): “Poverty Dynamics in Europe:
the establishment of more ambitious poverty reduction mea- From What to Why”. Social Europe Working Paper
sures. One is the growth in the persistent nature of poverty – 03/2015, European Commission.
being under the threshold in the current year and in at least
two of the three previous years – in many Spanish homes.
In 2019, the problem affected over 15% of the population,
which is almost 40% more than the average of the UE-28.
Homes that experience situations of poverty in consecutive
years find it extremely difficult to get out of this state. Several
studies show that the probability of being poor today is
practically double if the person was poor the previous year
(Vaalavuo, 2015). The consequences are more serious than
those of temporary poverty, especially for minors, whose fu-
ture possibilities in terms of job opportunities, salaries, social
relations and even state of health are severely limited if they
have experienced these situations during their childhood.
The second reality is that it is precisely households with chil-
dren that have been most affected by the pandemic. The
aforementioned survey by Cáritas (2020) reports that the
pandemic has represented an additional burden for vulner-
able families with minors. From the EPA, it can also be seen
that while the percentage of households without income in-
creased 20% between the last quarter of 2019 and the
second quarter of 2020, in households with children the in-
crease was practically double. It is worrying that the impact
of the economic shock of Covid-19 has been particularly
negative in homes with children, due to the aforementioned
mid- to long-term consequences. The experience of poverty
in this early and crucial stage of child development may
constitute a limiting factor in their future wellbeing.
References
Ayala, L.; Cantó, O. and Rodríguez, J.G. (2017): “Poverty
and the business cycle: The role of intra-household distri-
bution of unemployment”. Journal of Economic Inequal-
ity, 15, 47-73.
Bárcena-Martín, E. and Cantó, O. (2020): “Movilidad de
ingresos y bienestar económico”. IEB Report 4/2020.
Cáritas (2020): La crisis de la COVID-19: el primer im-
pacto en las familias acompañadas por Cáritas. Ob-
servatorio de la Realidad Social, 1, June 2020.
IEB Report 4/2020 9Poverty in Spain and Europe. Effects of COVID-19
Elena Bárcena Olga Cantó Sánchez
Universidad de Málaga Universidad de Alcalá
EQUALITAS EQUALITAS
Income Mobility
and Economic Wellbeing
The impact of economic fluctuations on the wellbeing of mobility is hard to interpret in terms of wellbeing unless we
individuals tends to be evaluated by analysing the evolution determine the direction of the movement. To assess the
of economic inequality and monetary poverty. This analysis, social benefit of mobility it is crucial to consider that, in
which is very relevant, has some limitations because it an aggregate measure, one citizen’s experience of loss of
does not provide in-depth understanding of the individual income should not be compensated by an identical gain
experience of an increase or decrease in wellbeing, or experienced by another.
clearly identify the paths of entry and exit from situations of
economic necessity. Evidence from the United States shows that the prevalence
of income losses increased significantly even before the
A dynamic analysis of income facilitates understanding of financial crisis of 2008 (Dynan et al., 2012; Hacker et
the evolution of individual wellbeing and helps us to identify al., 2014). In Europe, Ayala and Sastre (2008), Van Kerm
which individuals experience greater changes and what and Pi Alperin (2013) and Cantó and Ruiz (2015) found
their demographic and socioeconomic characteristics are. that available income is particularly vulnerable in some
A detailed, longitudinal microanalysis that goes beyond countries of the European Union (UE). Until the first decade
aggregate figures of losses and gains can measure their of this century, Spain was one of these countries. Ayala and
social relevance and identify those who live in persistent Sastre (2008) concluded that variation in labour income is
instability. Sound knowledge of the nature of income the main source of mobility in Spain, due to the singularity of
mobility is therefore fundamental to design mechanisms of its job market. In contrast, in Germany, France, Italy and the
public action. As an example, if the incidence of poverty United Kingdom the greatest variation in income is mainly
(the percentage of people with income below a certain due to property income.
threshold) were the same at two points in time, the economic
and social policies to try to reduce it would differ depending The study by Bárcena-Martín and Moro-Egido (2013)
on its persistence. That is, we would not implement the same shows that the Great Recession had a clear impact on family
policies when individuals under the poverty threshold remain income in Spain. It considerably limited the opportunities to
the same (and their income has not changed) as when all prosper and increased those of losing income in relation
the population that is under the poverty threshold in the first to previous years. Although limited gains in income were
year is no longer in this position in the second year. widespread, the effect on losses was greater for individuals
who initially had low or middle income, and then spread to
Due mainly to the availability of longitudinal microeconomic the rest of the distribution.
databases, the study of income mobility has been extended
in recent years. Fields (2008) and Jäntti and Jenkins (2015) In the 2008 recession, much of the Spanish population lost
are two excellent reviews of the most relevant literature. A over 25% of their income from one year to the next; more
recent study by Bárcena-Martín and Cantó (2018) proposes than in any other EU country in the same period. The effects
a measure of directional mobility to identify individuals who of these changes were subsequently translated into the
experience losses and gains separately, because aggregate greatest level of inequality in income in the last half century
10 IEB Report 4/2020and a clear worsening in the monetary poverty rate. The Ayala, L. and Sastre, M. (2008): “The structure of income
results of Bárcena-Martín and Marfil-Cotilla (2017) showed mobility: empirical evidence from five UE countries”. Em-
that during the financial crisis of 2008, the individuals who pirical Economics, 35, 451-473.
suffered the greatest losses were those who lived in homes
with a high proportion of freelancers and in single-parent Ayala, L.; Cantó, O. and Rodríguez, J.G. (2017): “Poverty
households, single-person households or large families. and the business cycle: The role of intra-household distri-
bution of unemployment”. Journal of Economic Inequali-
In any case, one recurrent result is that the youngest ty, 15, 47-73.
families have been much more vulnerable to the
economic impact of the recession since 2008 and have Bárcena-Martín, E. and Cantó, O. (2018): “A simple sub-
experienced income losses more frequently than other group decomposable measure of downward (and up-
social groups (Aristei and Perugini, 2015; Bárcena- ward) income mobility”. ECINEQ WP 2018-472.
Martín and Moro-Egido, 2013). These losses tend to be
associated with their increasing difficulties in accessing Bárcena-Martín, E. and Marfil-Cotilla, M. (2017): “Movili-
stable work with employment protection, and the lack of dad de la renta en España: 2009-2013”. Mimeo, Uni-
public policies that guarantee minimum income. Another versidad de Málaga.
key result is that individuals with a higher education level
have greater income stability. Therefore, it is essential Bárcena-Martín, E. and Moro-Egido, A.I. (2013): “Movili-
to develop policies that promote education inclusion dad de los ingresos en España: el efecto de la crisis”.
to socially integrate minors from low social origins, as Papeles de Economía Española, 135, 201-216.
children of families with more resources cope better with
financial setbacks. So, it is vital to improve our system Cantó, O. and Ruiz, D. (2015): “The Contribution of In-
of assuring against the changes in economic cycle and come Mobility to Economic Insecurity in the US and Spain
to spend more and better on public education. These during the Great Recession”, in Garner, T.I. and Short,
reforms will enable us to address the duality of the labour K.S. (ed.), Measurement of Poverty, Deprivation, and Eco-
market and the proliferation of low salaries among young nomic Mobility (Research on Economic Inequality, Volume
people from humble environments. 23). Emerald Group Publishing Limited,109-152.
As noted by Ayala (2020), the profound shock of the Dynan, K.; Elmendorf, D. and Sichel, D. (2012): “The evo-
pandemic has led to an increase in the percentage of lution of household income volatility”. The B.E. Journal
households without income. The pandemic has particularly of Economic Analysis and Policy, 12(2), 1935-1682.
affected young people who have very short contracts and
low salaries. Given the considerable loss of jobs and the high Fields, G. (2008): “Income mobility”, The New Palgrave
number of employees affected by labour force adjustment Dictionary of Economics, McMillan Publishers, New
plans (ERTEs) due to the COVID-19 crisis, it is highly likely York.
that it will again be young people – many in families with
dependent children who are already very vulnerable – that Hacker, J.; Huber, G.; Nichols, A.; Rehm, P.; Schlesinger,
suffer from the greatest income losses and increase the number M.; Valletta, R. and Craig, S. (2014): “The economic
of people in poverty. Broader, more generous networks security index: a new measure for research and policy
of social protection for families are essential to reduce the analysis”. The Review of Income and Wealth, 60 (sup-
adverse effects of the economic cycle and minimise its impact plement issue), S5-S32.
on the most vulnerable population groups.
Jäntti, M. and Jenkins, S.P. (2015): “Income mobility”, en:
Atkinson, A.B. and Bourguignon, F. (Eds.), Handbook of
References Income Distribution, Volume 2. North Holland Publishing
Co., 807-935.
Aristei, D. and Perugini, C. (2015): “The Drivers of Income
Mobility in Europe”. Economic Systems, 39(2), 197-224. Van Kerm, P. and Pi Alperin, M.N. (2013): “Inequality,
growth and mobility: The intertemporal distribution of
Ayala, L. (2020): “Las posibles consecuencias de la CO- income in European countries 2003-2007”. Economic
VID-19 sobre la pobreza”. IEB Report 4/2020. Modelling, 35(C), 931-939.
IEB Report 4/2020 11Poverty in Spain and Europe. Effects of COVID-19
Conchita D’Ambrosio Vincent Vergnat
Université du Luxembourg Université du Luxembourg
Luxembourg Institute of Socio-Economic
Research (LISER)
Poverty in Europe: A Hard-to-Measure
Phenomenon
In order to have a good overview of poverty in Europe, Many researchers, such as Townsend (1979) and Sen
we need both a clear definition and an appropriate mea- (1992), have highlighted that the well-being of an individ-
surement of poverty. Defining and measuring poverty is ual, and hence the inequality and poverty within a popu-
important for different reasons, such as the identification lation, depends on many dimensions of human life, such
of the poor, understanding the magnitude of poverty, and as housing, education and life expectancy, and income is
the proper targeting and evaluation of anti-poverty policies only one of these dimensions. The relative and monetary ap-
(United Nations Economic Commission for Europe, 2017). proach to poverty is therefore only partial, and can be com-
The definition and measurement of poverty is however com- pleted by non-monetary indicators (Atkinson et al., 2004;
plex, and varies over time and across geographical areas. Nolan and Whelan, 2010). Being poor does not only
mean having a lower income than other people in the coun-
The European Council, in 1975, defined the poor as “in- try, but also not being able to afford essential goods and
dividuals or families whose resources are so small as to services. Non-monetary measures can thus better capture
exclude them from the minimum acceptable way of life of the multidimensional nature of poverty and better reflect cer-
the Member State in which they live”.1 tain aspects of living conditions. Absolute and non-monetary
indicators are also considered in the EU in the evaluation
The most widely-used poverty measure in the EU is monetary, of poverty, as a complement to the monetary measure de-
and is based on the comparison of a household’s equivalised scribed above. One of these former measures is the (severe)
disposable income to that of other households. As such, this material deprivation rate, which indicates the proportion of
is a relative measure that depends on comparisons to others. the population who cannot afford at least (four) three items
Equivalent income is household disposable income (i.e. out of the list of nine-below (Social Protection Committee –
income after taxes and transfers) divided by an equivalence Indicators Sub-Group, 2015):
scale to take into account the economies of scale from
cohabitation.2 The European poverty measure, the at risk 1. to pay rent or utility bills,
of poverty rate (AROP), is the share of individuals with an 2. to keep home adequately warm,
equivalised household income that is below 60% of the median 3. to face unexpected expenses,
equivalised income observed in the country: this latter figure is 4. to eat meat, fish or a protein equivalent every second day,
also called the poverty line. As such, the poverty line varies 5. to have a week’s holiday away from home, or could not
from one country to another. The poverty rate in the European afford (if wanted to),
Union in 2018 was 17.1% according to this definition. 6. having a car,
7. having a washing machine,
8. having a colour TV,
1
Council Decision of 22 July 1975 concerning a programme of pilot schemes
9. having a telephone
and studies to combat poverty (75/458/EEC). https://eur-lex.europa.
eu/legal-content/EN/TXT/PDF/?uri=CELEX:31975D0458&from=EN
2
The equivalence scale used by Eurostat is the modified OECD equivalence
According to this indicator, 5.9% of the European popula-
scale. This scale gives a weight of 1 to the first adult, 0.5 to each additional tion is severely materially deprived.
adult (14 years old or over) and 0.3 to each child (less than 14 years old).
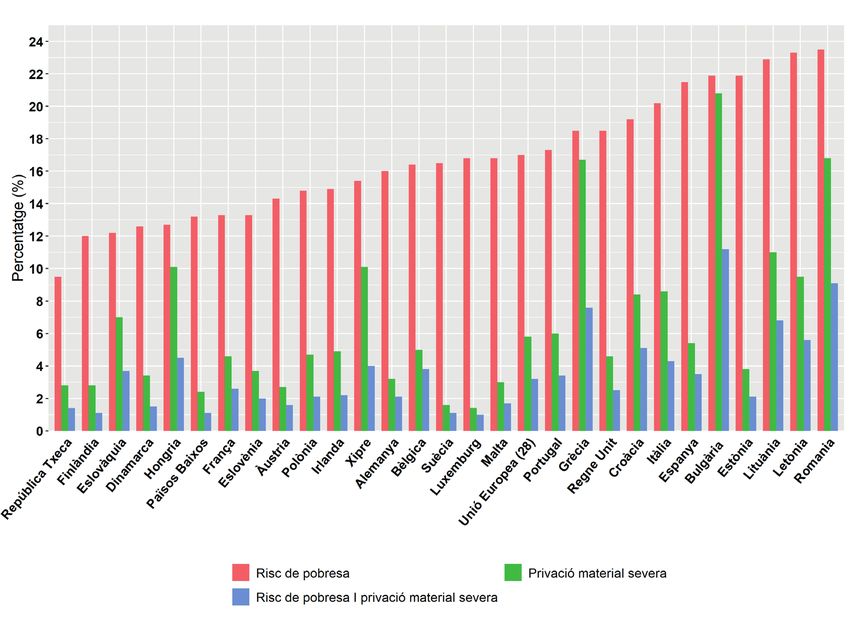
12 IEB Report 4/2020Figure 1 compares the at risk of poverty rate and the severe may have saved or invested in durable goods in the past,
material deprivation rate in the EU28 in 2018. It can be thereby enabling them to have a decent material standard
seen that the two definitions give different pictures of pover- of living even if they have low income. Conversely, some
ty, so that both are needed in order to better understand the households may have a monetary income above the poverty
extent of poverty in Europe (see Fusco et al., 2010, and Se- line but that does not allow them to meet all of the household
rafino and Tolkin, 2017, among many others). The at risk of needs. In total, about 1% of the population is both at risk of
poverty rate ranges from 9.6% in the Czech Republic to over poverty and in a situation of severe material deprivation in
22% in Lithuania, Latvia and Romania. These latter countries Luxembourg, Finland, the Netherlands and Sweden; on the
are not necessarily those with the highest rates of material contrary, the analogous figures in Romania and Bulgaria are
deprivation, which are seen to be Romania, Greece and 9.1% and 11.2% respectively. Over the whole of the EU
Bulgaria (with figures of over 15%). The difference between 28, 3.2% of the population is both at risk of poverty and in
the two rates is sometimes considerable, as in Estonia (with severe material deprivation.
a severe material deprivation rate -18pp lower than the at
risk of poverty rate), while in Bulgaria and Greece the diffe- Both indicators are therefore important for the assessment
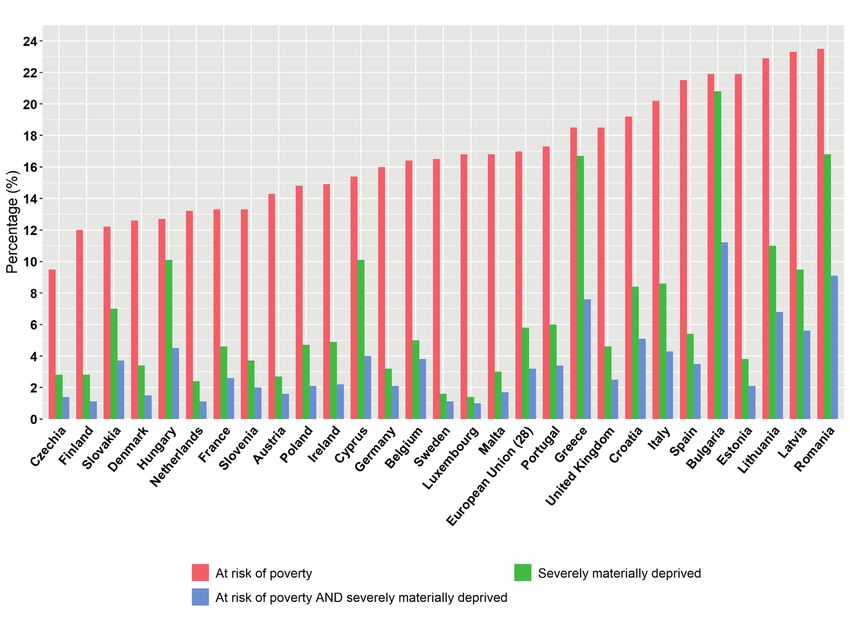
rence is only very small (at under 2 pp). of poverty and its evolution over time (Figure 2). Over the
2005-2018 period, poverty rose by 3% at the European
In 2018, while more than 70% of severely deprived people level, while severe material deprivation fell by 45%. There
were also at risk of poverty in Luxembourg and Belgium, the is considerable heterogeneity among countries, with a sig-
corresponding figure was only around 40% in Finland and nificant rise in the poverty rate over this period in Sweden
Cyprus. This can be explained, for example, by the fact that (+73%) and sharp falls in Poland and Ireland (between -24%
income poverty reflects current income, whereas households and -28%). Severe material deprivation also fell sharply in
Figure 1: The At risk of poverty and Severe material deprivation rates in Europe, 2018
Source: Eurostat.
IEB Report 4/2020 13Figure 2: Evolution of the At risk of poverty and Severe material deprivation rates in Europe, 2005-2018
Source: Eurostat.
Poland (-86%) but increased in Greece and Spain (around other aspects of living conditions. It is therefore often neces-
+30%, even though this figure has been falling again since sary to use different indicators to have a more comprehen-
2014 in Spain and 2016 in Greece). sive view of the phenomenon of poverty and give a better
understanding of what is behind the word “poor”. We have
The two indicators discussed above capture the population illustrated this with two indicators and more are needed to get
shares of the deprived, but are silent on the intensity of this an even more complete picture. We have shown that that al-
phenomenon, that is on how poor the poor are. To this end though Europeans increasingly have access to goods and ser-
Eurostat also uses the relative-median-poverty-risk gap and vices that enable them to achieve more adequate living con-
the depth of material deprivation. The first figure measures ditions, the share of individuals with low income compared to
the distance between the poverty line and the median equiv- other members of the country’s population tends to increase.
alised disposable income of the poor. The closer is the index These results are not contradictory but illustrate different sides
to 100, the deeper is monetary poverty. The poverty gap of the same coin and raise other questions. For example, do
was 24.3% in 2018 in EU28 (ranging from 14.2% in Fin- households emerging from severe material deprivation have
land to 35.2% in Romania). The second index measures access to goods and services of the same quality than others?
the mean number of items that households lack (among the
nine that were used to construct the material deprivation rate
above) amongst those who are materially-deprived. This in- References
tensity of deprivation was 3.7 in 2018 in EU28 (with figures
from 3.4 in Cyprus and Luxembourg to 4.3 in Bulgaria). Atkinson, A.B.; Marlier, E. and Nolan, B. (2004): “Indi-
cators and Targets for Social Inclusion in the European
Because of its multidimensional nature, the measurement of Union”. JCMS: Journal of Common Market Studies, 42,
poverty is complex and involves not only monetary but also 47-75.
14 IEB Report 4/2020Fusco A.; Guio A-C and Marlier, E. (2010): “Characteris- ing the income poor and the materially deprived in Eu- ropean countries”, in Atkinson, A. and Marlier, E. (ed.), Income and living conditions in Europe. Luxembourg: Office for Official Publications of the European Commu- nities, 307-328. Serafino, P. and Tonkin, R. (2017): “Comparing poverty estimates using income, expenditure and material depri- vation”, in Atkinson, A.; Guio, A-C. and Marlier E. (ed.), Monitoring social inclusion in Europe. Luxembourg: Pub- lications office of the European Union, 241-258. Nolan, B. and Whelan, C.T. (2010): “Using Non-Mone- tary Indicators to Analyze Poverty and Social Exclusion: Lessons from Europe”. Journal of Policy Analysis and Management, 29(2), 305-325. United Nations Economic Commission for Europe (2017): Guide on Poverty Measurement. Geneva: United Na- tions. Sen, A. (1992): Inequality Re-examined. Harvard University Press, Cambridge, MA. Social Protection Committee – Indicators Sub-Group (2015): Portfolio of EU social indicators for the monitor- ing of progress towards the EU objectives for social pro- tection and social inclusion: 2015 update. Luxembourg: Publications Office of the European Union. Townsend, P. (1979): Poverty in the United Kingdom. Pen- guin, Harmondsworth. IEB Report 4/2020 15
Authors

Ayala Cañón, Luis

Luis Ayala Cañón graduated in Economic and Business Sciences at the Universidad Complutense in Madrid, where he also
completed his doctorate. He is currently Full Professor of Economics at the UNED. Previously he was Subdirector-General of
the Institute of Fiscal Studies, and he was a founder member of the EQUALITAS group (Economics of Inequality and Poverty
Analysis). His research work has focused on income distribution, social policy and the labour market. He has written several
books and has published articles in journals in Spain and abroad.

Bárcena, Elena

Elena Bárcena is Full Professor of Economics at the Department of Applied Economics (Statistics and Econometrics) of the
Universidad de Málaga and a member of EQUALITAS. She graduated in Economic and Business Sciences at the Univer-
sidad de Málaga (where she was awarded the Second National Prize), and completed her doctorate in Economic and
Business Sciences (obtaining the Institute of Fiscal Studies Prize) at the same university. She also obtained a master’s degree
in Econometrics and Mathematical Economics at the London School of Economics. Her research centres on the measure-
ment and analysis of economic inequality, deprivation and poverty, income mobility, childhood, public policies and social
welfare. Her results have generated a wide range of publications, including books and chapters published by leading
publishing-houses and a series of articles in high-impact journals such as Socio-Economic Review, Economics and Human
Biology, Fuzzy Sets and Systems, Journal of Social Policy, Review of Income and Wealth, Journal of Economic Inequality,
Review of Economics of the Household, Social Indicators Research, Social Choice and Welfare, etc. She is Treasurer of the
Society for Economic Inequality and associate editor of the journal Hacienda Pública Española.

Bosch, Núria

Núria Bosch is currently Professor in Economics at the Universitat of Barcelona and holds an undergraduate degree and a
PhD in Economics and Business Science from that university. She is also researcher and board member at the Barcelona
Institute of Economics (IEB). She specialises in fiscal federalism, local and regional public finance, territorial fiscal flows
and public sector efficiency analysis. Her work has been published in national and international specialist journals such
as Environment and Planning C: Government and Policy, International Tax and Public Finance, Local Government Studies,
Public Finance, Public Finance Review, Hacienda Pública Española/Review of Public Economics and Revista de Economía
Aplicada, amongst others.

Cantó Sánchez, Olga

Olga Cantó Sánchez is Full Professor of the Foundations of Economic Analysis at the Universidad de Alcalá, a member of
EQUALITAS and WEIPO, and a contributor to ECOSOT. She obtained her doctorate in Economics at the European Univer-
sity Institute in Florence. She was lecturer in Public Economics at the Universidad de Vigo and head of research studies at
the Institute of Fiscal Studies. Her main lines of research are the measurement of welfare, income dynamics, inequality and
poverty in rich countries, the intergenerational transmission of opportunities and the redistributive effects of public policies.
She has published her work in journals in Spain and also in foreign journals of acknowledged prestige such as Economic
Systems, Review of Income and Wealth, Journal of Economic Inequality, Feminist Economics and Review of Economics of
the Household and also in a multitude of reports and book chapters published by Oxford and Cambridge University Press,
Edward Elgar, and Ashgate. Recently she authored a chapter in the Handbook of Research in Economic and Social Well-
being, and since 2017 she has been associate editor of Applied Economics Analysis.

16                                                                                                            IEB Report 4/2020
Authors

D’Ambrosio, Conchita

Conchita D’Ambrosio is Professor of Economics, FNR PEARL Chair, at Université du Luxembourg. She is an economist, with a
Ph.D. from New York University (2000). Her research interests have revolved around the study of individual and social well-
being, its determinants, and the proposal of various measures that are able to capture its different aspects. Before joining
the University of Luxembourg in 2013, she was Associate Professor of Economics at the Università di Milano-Bicocca. She
has published in several academic journals, such as Economica, Economics Letters, International Economic Review, Review
of Economics and Statistics, Social Choice and Welfare, Review of Income and Wealth, the Journal of Economic Theory.
She has been member of the editorial board of the Review of Income and Wealth since 2001 and chief editor of the same
journal since 2007. She joined the editorial board of the Journal of Economic Inequality in 2013. She is the editor of the
Handbook of Research on Economic and Social Well-Being published by Edward Elgar in 2018.

Vergnat, Vincent

Vincent Vergnat holds a PhD in Economics from Université de Strasbourg and is, since 2018, a Research Associate at
the Economic and Social Well-being research group of the Université du Luxembourg and at the Luxembourg Institute of
Socio-Economic Research (LISER). Very interested in multidisciplinarity, his research interests focus on poverty, inequality and
labor supply. More particularly on the effect of tax-benefits systems on living conditions and on the labor supply behavior
of households. He has a particular interest in life events characterizing the transition to adulthood. His investigations are
essentially based on empirical data (survey or administrative data) and on microsimulation and econometric technics. He
participates in various European projects as well as in analyzes carried out for national institutions. He recently integrated
the multidisciplinary Working, Yet Poor project which focuses on the phenomenon of in-work poverty in Europe. His papers
have been published in French speaking and in international academic journals (Review of Economics of the Household,
Economie et Statistique/Economics and Statistics and in Revue Économique).

IEB Report 4/2020                                                                                                            17
IEB Report 4/2020

La pobreza en España y Europa. Efectos de la
COVID-19
El Institut d’Economia de Barcelona (IEB) es un centro           Energética y Ambiental) y la Cátedra UB en Economía
de investigación en Economía que tiene como objetivos            Urbana Ciudad de Barcelona.
fomentar y divulgar la investigación en economía, así
como contribuir al debate y a la toma de las decisiones de       Además de realizar actividades relacionadas con la
política económica.                                              investigación académica, el IEB pretende dar a conocer y
                                                                 difundir la investigación realizada mediante la organización
La investigación de sus miembros se centra principalmente        de simposios y jornadas, así como de diversas publicaciones
en las áreas del federalismo fiscal; la economía urbana;         entre las que cabe destacar cada año el Informe IEB sobre
la economía de las infraestructuras y el transporte; el          Federalismo Fiscal y Finanzas Públicas. El IEB Report que el
análisis de sistemas impositivos; las políticas públicas; y la   lector tiene en sus manos, forma parte de dicho informe, si
sostenibilidad energética.                                       bien con una periodicidad mayor y un contenido más ágil
                                                                 para poder adaptarse mejor a la cambiante actualidad.
Creado en 2001 en el seno de la Universitat de Barcelona
y reconocido por la Generalitat de Cataluña, el IEB recibió
un importante impulso en 2008 con la constitución de la
Fundación IEB (en la que colaboran Abertis, la Caixa,
Naturgy Energy, Saba, el Ayuntamiento de Barcelona,
el Área Metropolitana de Barcelona, la Universitat de
Barcelona, la Universitat Autònoma de Barcelona, la              Las opiniones expresadas en el Informe no
Diputación de Barcelona, Agbar y Cuatrecasas). También           reflejan las opiniones del IEB.
acoge la Cátedra de Sostenibilidad Energética de la
UB (financiada por la Fundación para la Sostenibilidad           Más información www.ieb.ub.edu
La pobreza en España y Europa. Efectos de la COVID-19
Núria Bosch
Institut d’Economia de Barcelona (IEB)
Universitat de Barcelona
La pobreza en España y Europa. Efectos
de la COVID-19
Desgraciadamente en los países más desarrollados, los za en España. En segundo lugar, examina cómo la movili-
países que tienen un estado del bienestar más consolida- dad de ingresos afecta al bienestar económico, haciendo
do, se pueden encontrar bolsas de pobreza, desigualdad referencia también al caso español. Finalmente, la tercera
y exclusión social. El presente IEB Report pretende analizar contribución describe los indicadores más utilizados para
la situación actual de la pobreza en España y Europa. Si medir la pobreza y la desigualdad, así como sus resultados
bien las diferencias entre países son notables, la pobreza en los países europeos.
es una plaga que afecta a todos.
La primera contribución corresponde a Luis Ayala. Constata
Por otro lado, todavía muchas sociedades no se habían que el porcentaje de hogares sin ingresos aumentó repen-
recuperado de la crisis de 2008 cuando la pandemia de tinamente los primeros cien días de la pandemia. También
la COVID-19 ha vuelto a incidir negativamente sobre la señala que la pandemia ha supuesto un freno al proceso
pobreza y la desigualdad. El Informe FOESSA 2020 alerta de reducción de la pobreza cuando aún no se había cer-
de que la pandemia ha anulado en solo unos meses el rado el gap respecto a los niveles anteriores a la crisis de
efecto de la recuperación y han vuelto las cifras del peor 2008. El principal peligro de la incidencia de la pandemia
momento de la última crisis. Según el Informe, en la actual- sobre la pobreza es que dé origen a formas estructurales
idad a tres de cada diez personas en exclusión grave les de riesgo, es decir, de pobreza duradera, lo que permite
falta cualquier tipo de ingreso. adelantar que la salida de la crisis no tendrá forma de V.
Con todo, hay que destacar el papel que juegan en la La contribución de Elena Bárcena-Martín y Olga Cantó,
lucha contra la pobreza los sistemas de protección social mediante un análisis dinámico de los ingresos de las fa-
actuales. Como afirman Aspachs et al. (2020), “los siste- milias, identifica los individuos que experimentan mayores
mas de protección social del pasado no tienen nada que cambios y qué características demográficas y socioeco-
ver con los mecanismos que provee el estado del bienestar nómicas tienen. Los individuos más jóvenes son los más
moderno”. Hay que tener en cuenta la contundente respues- vulnerables al impacto de la crisis económica, debido a la
ta en términos de políticas públicas que se lleva a cabo falta de políticas públicas que les aseguren un mínimo de
para paliar la pobreza y la desigualdad. Así, Aspachs et ingresos. También los individuos con mayor nivel educativo
al. (2020) constatan que en España entre los meses de tienen una mayor estabilidad de ingresos, lo que conduce
febrero y abril de 2020, y antes de tener en cuenta las a que se debe gastar más en educación pública. Concluy-
transferencias del sector público, el porcentaje de personas en que la crisis de la COVID-19 probablemente afecte más
sin ingresos aumentó en 15 puntos porcentuales. En cam- a los jóvenes y a muchas familias con hijos pequeños ya
bio, una vez se tienen en cuenta las transferencias públicas vulnerables.
el porcentaje de personas sin ingresos se incrementó en
solo 7 puntos porcentuales. La tercera contribución de Conchita D’Ambrosio y Vincent
Vergnat mide a través de una serie de indicadores la po-
Así pues, y en cuanto al presente IEB Report, en primer breza en los países europeos. La definición y medición de
lugar, analiza los efectos de la COVID-19 sobre la pobre- la pobreza es una cuestión compleja, que varía con el ti-
IEB Report 4/2020 19empo y entre zonas geográficas. El indicador más utilizado en la UE es la tasa de riesgo de pobreza (AROP), siendo el porcentaje de individuos con una renta familiar equiv- alente que está por debajo del 60% de la renta media equivalente en el país. Esta tasa en la UE en 2018 era del 17,1%. Este indicador monetario debe completarse con indicadores no monetarios como el de la población con privación material severa, que indica la proporción de la población que no puede afrontar al menos cuatro de los servicios y bienes considerados esenciales de una lista de nueve. A escala europea, este indicador era del 5,9% en 2018. D’Ambrosio y Vergnat concluyen que, a pesar de que los europeos tienen cada vez más acceso a bienes y servicios que les permiten unas condiciones de vida más adecuadas, el porcentaje de individuos con rentas bajas tiende a incrementarse. En conclusión, los trabajos presentados en este informe nos indican que, a pesar de los sistemas de protección social de nuestros países, son aún necesarias políticas públicas más amplias y generosas para reducir los efectos del ciclo económico sobre las familias más vulnerables. Referencias bibliográficas Aspachs, O.; Durante, R.; Graziano, A.; Mestres, J.; Mon- talvo, J.G. y Reynal-Querol, M. (2020): “L’impacte de la COVID-19 sobre la desigualtat a Espanya”. Informe Mensual de CaixaBank Research, 450, 29-40. Fundación FOESSA (2020): Distancia social y derecho al cuidado, Fundación FOESSA, Madrid. 20 IEB Report 4/2020
La pobreza en España y Europa. Efectos de la COVID-19

                                                       Luis Ayala Cañón
                                                       UNED
                                                       EQUALITAS

                                Las posibles consecuencias de la covid-19
                                sobre la pobreza

                                Entre los efectos sociales más inmediatos de la COVID-19,            et al., 2020), debido, principalmente, a una distribución
                                uno de los más relevantes es, sin duda, el aumento de                muy desigual de la pérdida de horas trabajadas. Existe
                                las necesidades sociales y, más específicamente, de las              también evidencia indirecta creciente del empobrecimiento
                                situaciones de insuficiencia de los ingresos de los hogares.         de grandes capas de la población, al dejar al descubierto
                                Aunque todavía no existe información disponible desde el             este profundo shock la realidad del mercado laboral, con
                                primer trimestre de 2020 en las principales encuestas ofi-           un alto número de trabajadores con contratos de muy corta
                                ciales, la magnitud del deterioro de la actividad económica          duración, salarios bajos y un acceso limitado al sistema de
                                y la respuesta conocida de los indicadores de desigual-              prestaciones sociales.
                                dad y pobreza al aumento del desempleo (Ayala et al.,
                                2017; Bárcena-Martín y Cantó, 2020) permiten anticipar               Dada la evolución conocida de la distribución de la renta
                                un impacto de gran magnitud. Como han empezado a                     en el largo plazo, uno de los principales motivos de pre-
                                mostrar algunos estudios, parece inevitable el ensanchami-           ocupación respecto a las consecuencias de la pandemia es
                                ento de las diferencias de renta entre los hogares (Palomino         que el aumento transitorio de la incidencia y la intensidad

                                Gráfico 1. Evolución del porcentaje de hogares con todos los activos en paro y de los hogares sin ingresos
Hogares todos activos en paro

                                                                                                                                                             Hogares sin ingresos

                                                                     Hogares todos activos en paro            Hogares sin ingresos

                                 Fuente: Elaboración propia a partir de Encuesta de Población Activa (INE).

                                IEB Report 4/2020                                                                                                              21
de la pobreza tenga efectos duraderos. No es fácil, sin em- algunas organizaciones sociales a partir de los perfiles y
bargo, predecir el posible comportamiento de la pobreza el volumen de hogares demandantes de servicios y presta-
ante cambios en el ciclo económico a través de los indica- ciones. Cáritas (2020) publicó en junio un primer informe
dores habituales de pobreza relativa, en los que el umbral sobre el impacto de la crisis de la COVID-19 sobre las fa-
cambia cuando lo hace la renta. Una posible aproximación milias acompañadas por esta organización, que mostraba
que evita esa sensibilidad del umbral a los cambios de ciclo que el efecto del aumento del desempleo se multiplicó por
es considerar como referencia el porcentaje de hogares sin diez en las familias más vulnerables, con una incidencia
ingresos que trimestralmente ofrece la Encuesta de Población muy negativa en las que dependían del empleo informal.
Activa y que puede interpretarse como un indicador de po-
breza severa. La EPA también permite calcular el porcentaje La pandemia ha supuesto, en cualquier caso, un freno en el
de hogares en los que todos los activos están en situación de proceso de reducción de la pobreza cuando todavía no se
desempleo, que es una de las variables que mejor predice la había cerrado la brecha respecto a los niveles anteriores a
pobreza monetaria. Tal como puede verse en el Gráfico 1, la crisis de 2008. Tal como puede apreciarse en el Gráfico
el porcentaje de hogares sin ingresos aumentó súbitamente 2, en el que se muestra el indicador más habitual de po-
en los primeros cien días de la pandemia, que incluyen las breza (relativa), en 2019, cuando ya había transcurrido el
dos últimas semanas del primer trimestre de 2020 y el segun- mismo número de años de recesión que de recuperación,
do trimestre completo. La recuperación de la actividad en el la tasa de pobreza monetaria era un punto superior a la
verano, por el contrario, dio lugar a una rápida caída del que había antes de la crisis. El freno en el proceso de re-
volumen de hogares en esta situación, aunque insuficiente ducción de la pobreza tras el aumento de la crisis de 2008
para compensar el crecimiento previo. se percibe mejor en el indicador de hogares sin ingresos,
que en el trimestre anterior a la pandemia tenía un valor
Esa reducción no se observa en los hogares con todos los que era todavía superior en más de un 80% al de 2007.
activos en paro, cuyo volumen siguió creciendo en el tercer
trimestre de 2020, aunque a un ritmo más moderado que Uno de los riesgos de la pandemia es, por tanto, que el
en los primeros meses de la pandemia. En la medida en aumento de la pobreza dé origen a formas estructurales de
que de la evolución en el largo plazo de esta variable este riesgo. Puede resultar ilustrativa a este respecto la ex-
parece inferirse un retardo entre su crecimiento y el de la periencia de recesiones anteriores. Entre 1992 y 1994, la
pobreza severa, cabe esperar que sin una rápida mod- tasa de desempleo pasó del 14,4% al 22,0%, lo que sus-
eración de su tendencia al alza sea difícil esperar descen- citó un rápido incremento del porcentaje de hogares sin in-
sos de la pobreza. Así parecen confirmarlo los datos de gresos (del 1,7% al 2,3%). Cuando el desempleo empezó
Gráfico 2. Evolución de la tasa de pobreza relativa (umbral: 60% de la mediana de la renta por adulto equivalente)
23
22
21
20
19
18
17
16
15
04 05 06 07 08 09 10 11 12 13 14 15 16 17 18 19
Fuente: Elaboración propia a partir de Encuesta de Condiciones de Vida (INE).
22 IEB Report 4/2020a crecer a finales de 2007, cerrándose un largo proceso bution of unemployment”. Journal of Economic Inequali-
de continuado e intenso crecimiento del empleo (la tasa ty, 15, 47-73.
de desempleo descendió desde el citado 22% al 8%), no
se habían recuperado los niveles de pobreza severa ante- Bárcena-Martín, E. y Cantó, O. (2020): “Movilidad de
riores a la recesión de 1992-94. El carácter asimétrico de ingresos y bienestar económico”. IEB Report 4/2020.
los efectos del ciclo económico sobre la desigualdad y la
pobreza, con rápidos crecimientos en las recesiones y de- Cáritas (2020): “La crisis de la COVID-19: el primer im-
scensos mucho más pausados en las expansiones, permite pacto en las familias acompañadas por Cáritas”. Ob-
anticipar que para una proporción no desdeñable de la po- servatorio de la Realidad Social, 1, junio 2020.
blación la salida a esta crisis no va a tener una forma de V.
Palomino, J.C.; Rodríguez, J.G. y Sebastián, R. (2020):
Hay, además, dos rasgos preocupantes en la evolución “Wage inequality and poverty effects of lockdown and
de la pobreza, que la pandemia puede exacerbar y que social distancing in Europe”. European Economic Re-
obligan a establecer medidas más ambiciosas para su re- view, 129, 1-25.
ducción. Uno es el crecimiento del carácter persistente de
la pobreza -estar por debajo del umbral en el año en curso Vaalavuo, M. (2015): “Poverty Dynamics in Europe:
y en al menos dos de los tres años previos- en muchos From What to Why”. Social Europe Working Paper
hogares españoles. En 2019 el problema afectaba a más 03/2015, Commisión Europea.
de un 15% de la población, lo que suponía casi un 40%
más que el promedio de la UE-28. Los hogares que viven
durante años consecutivos en situaciones de pobreza tie-
nen grandes dificultades para salir de ese estado. Varios
estudios muestran que la probabilidad de ser pobre hoy es
prácticamente el doble si se ha sido pobre el año anterior
(Vaalavuo, 2015). Las consecuencias son más graves que
las de la pobreza transitoria, especialmente en el caso de
los menores de edad, cuyas posibilidades futuras en cuanto
a oportunidades laborales, salarios, relaciones sociales o,
incluso, estado de salud, se restringen severamente si se
han vivido estas situaciones durante la infancia.
La segunda realidad es que son, precisamente, los hog-
ares con niños los que se han visto más afectados por la
pandemia. El citado estudio de Cáritas (2020) recoge que
ésta ha supuesto una carga adicional para las familias vul-
nerables con menores de edad. De la EPA se desprende
también que mientras que el porcentaje de hogares sin in-
gresos aumentó un 20% entre el último trimestre de 2019
y el segundo de 2020, en el caso de los hogares con
menores el incremento fue prácticamente el doble. Que el
impacto del shock económico de la COVID-19 haya sido
especialmente negativo en los hogares con niños resulta
preocupante por las citadas consecuencias en el medio y el
largo plazo, con el riesgo de que la vivencia de la pobreza
en esta etapa temprana y crucial de su desarrollo constituya
un elemento limitativo de su bienestar futuro.
Referencias bibliográficas
Ayala, L.; Cantó, O. y Rodríguez, J.G. (2017): “Poverty
and the business cycle: The role of intra-household distri-
IEB Report 4/2020 23You can also read