IG Petrochemicals Limited - Investor Presentation - August 2019 - IG Petrochemicals Ltd
←
→
Page content transcription
If your browser does not render page correctly, please read the page content below
IG Petrochemicals Limited
      Investor Presentation - August 2019

                                            1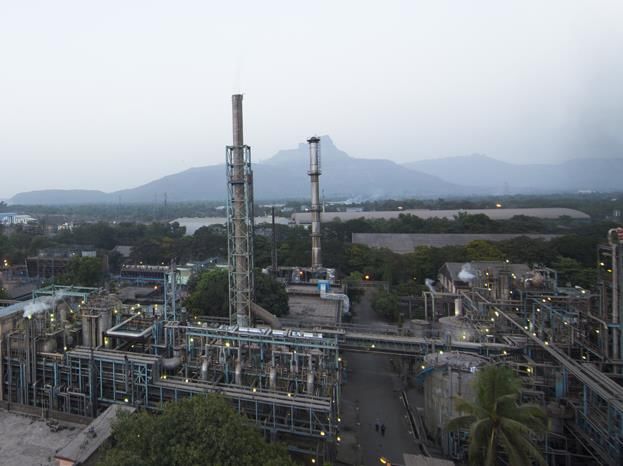
Safe Harbor

This presentation has been prepared by and is the sole responsibility of I G Petrochemicals Limited (the “Company”). By accessing this presentation, you are
agreeing to be bound by the trailing restrictions.

This presentation does not constitute or form part of any offer or invitation or inducement to sell or issue, or any solicitation of any offer or recommendation to
purchase or subscribe for, any securities of the Company, nor shall it or any part of it or the fact of its distribution form the basis of, or be relied on in connection
with, any contract or commitment thereof. In particular, this presentation is not intended to be a prospectus or offer document under the applicable laws of any
jurisdiction, including India. No representation or warranty, express or implied, is made as to, and no reliance should be placed on, the fairness, accuracy,
completeness or correctness of the information or opinions contained in this presentation. Such information and opinions are in all events not current after the date
of this presentation. There is no obligation to update, modify or amend this communication or to otherwise notify the recipient if information, opinion, projection,
forecast or estimate set forth herein, changes or subsequently becomes inaccurate.

Certain statements contained in this presentation that are not statements of historical fact constitute “forward-looking statements.” You can generally identify
forward-looking statements by terminology such as “aim”, “anticipate”, “believe”, “continue”, “could”, “estimate”, “expect”, “intend”, “may”, “objective”, “goal”,
“plan”, “potential”, “project”, “pursue”, “shall”, “should”, “will”, “would”, or other words or phrases of similar import. These forward-looking statements involve
known and unknown risks, uncertainties, assumptions and other factors that may cause the Company’s actual results, performance or achievements to be
materially different from any future results, performance or achievements expressed or implied by such forward-looking statements or other projections. Important
factors that could cause actual results, performance or achievements to differ materially include, among others: (a) our ability to successfully implement our
strategy, (b) our growth and expansion plans, (c) changes in regulatory norms applicable to the Company, (d) technological changes, (e) investment income, (f) cash
flow projections, and (g) other risks.

This presentation is for general information purposes only, without regard to any specific objectives, financial situations or informational needs of any particular
person. The Company may alter, modify or otherwise change in any manner the content of this presentation, without obligation to notify any person of such change
or changes.

                                                                                                                                                                            2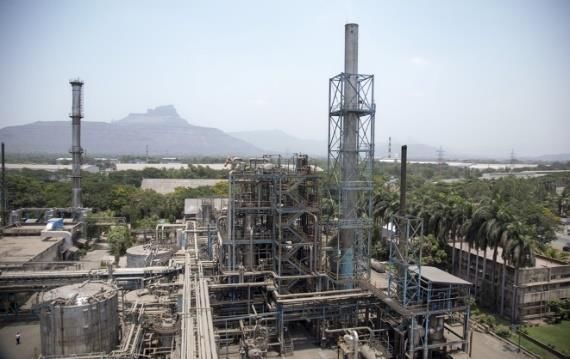
Company Overview

India’s Largest Phthalic Anhydride (PAN) manufacturer and among the top five in the world

PAN is a downstream product of Orthoxylene (OX) a basic Petrochemical

PAN is a versatile intermediate in organic chemistry for production of Plasticizers, Unsaturated
Polyester Resins, Alkyd Resins, Paints & CPC Pigments

Plants are engineered with modern technologies and are designed on the low energy based
processes. Steam generated from the production process used for Company’s captive power                      VISION
requirements
                                                                                                      “To be well diversified
                                                                                                     chemicals company with
Usage of PAN is increasing in new generation products where R & D is ongoing
                                                                                                      leadership position in
                                                                                                   Phthalic Anhydride Industry”
ISO 9001:2008 for quality management system
ISO 14001:2004 for environment certification from Bureau Veritas

IGPL produces Maleic Anhydride through wash water generated out of the production process
of PAN. Maleic Anhydride is used in agro and food businesses

IGPL also manufactures Benzoic Acid (BA) as a by-product

                                                                                                                                  3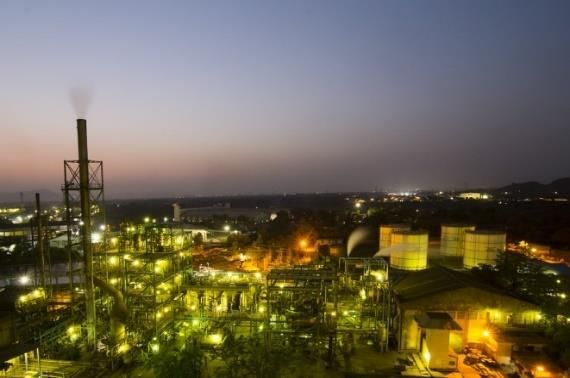
Business Overview

                    4
End User Industry & Application of PAN
PLASTICIZERS
Used in manufacturing of poly vinyl chloride ALKYD RESINS
(PVC) products which is used for manufacturing a
range of consumer care, personal care and home
care products like shoes, wires & cables, pipes & Used in manufacturing of paints and
hoses, boxes, containers, packaging films, coatings OTHERS
medical and surgical equipment's
34% 24% 17% 6% 19%
Supply Chain
CPC PIGMENTS UNSATURATED POLYESTER RESIN
S ainks
Used for making l e&s photovoltaic
& cells Used as thermostat for manufacturing of fiberglass
reinforced plastics for automobile, construction,
Distribution marine and transportation industries
PAN is a downstream product of Orthoxylene (OX) a basic Petrochemical. It is a versatile intermediate in organic chemistry
Applications for PA are increasing rapidly, driven by new Research & Innovation
5Production Process
PA I PA III PA II
Air Orthoxylene Air Orthoxylene Air Orthoxylene
Reactor Reactor Reactor
Steam PA (Gases) Steam PA (Gases) PA (Gases) Steam
Cooling Cooling Cooling
Steam
Sublimation Sublimation Sublimation
Crude PA (Liquid) Crude PA (Liquid)
Distillation Distillation
PAN PAN
Recovers
Maleic Anhydride &
Benzoic Acid
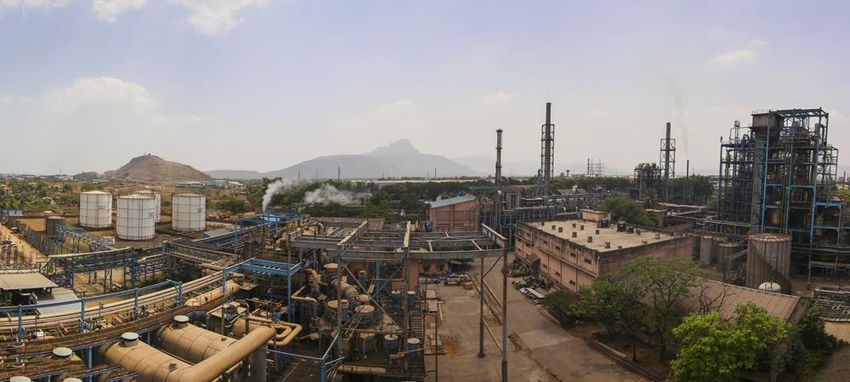
6Strategically Located Plant…
❖ Located at MIDC, Taloja in Raigad District,
Maharashtra
❖ Proximity to Jawaharlal Nehru Port Trust (JNPT),
Nhava Sheva, Mumbai, Maharashtra - Enjoys the
advantage of being near ports for exports
Kandla Port
Jamnagar ❖ Proximity to India’s Chemical Hub where majority
of downstream industries are located including
JNPT Port procurement of Raw Material
❖ Completely Integrated Manufacturing Facility
at a Single Location
❖ Majority of domestic sales is within Western India
IGPL Plant at MIDC - Taloja, Maharashtra
Chemical Belt in Western India
…with State-of-the-Art Technology
Map not to scale. All data, information and maps are provided “as is” without warranty
or any representation of accuracy, timeliness or completeness. 7Maleic Anhydride
India’s only manufacturer of Maleic Anhydride; made through wash
water which gets derived through manufacturing of PAN
END USER INDUSTRY
• Spandex (Elastics)
Indian Market Size for Maleic Anhydride (MA) is ~55,000 MTPA • Unsaturated Polyester Resins
(UPR)
• Lubricating Oil Additives
• Personal Care Products
The raw material used is N-butane (gas derivative) which is not available
in India. All MA required in India is completely imported except the one • Maleic anhydride is also a
made by IGPL precursor to compounds used
for water treatment
detergents, insecticides and
fungicides.
IGPL’s Capacity of MA is 6,500 MTPA
Post expansion, Capacity will increase to 8,000 MTPA
8Key Strengths & Strategies
9Capacity Expansions & Strategies
PA 4 Plant Advance Plasticizers
Project Cost : Rs 320 Crores Project Cost : Rs 20 Crores
Loan : Rs 125 Crores (ECB) Capacity of 8,000 MTPA
Capacity to be commissioned by Dec’ 2019 Capacity to be commissioned by Mar’ 2020
Total Capacities Post Expansion (MTPA)
+31% +29% +30%
222,110 8,400 1,300
169,110 53,000 6,500 1,900 1,000 300
Pre Expansion Post Pre Expansion Post Pre Expansion Post
Phthalic Anhydride Maleic Anhydride Benzoic Acid
MTPA - Metric Tonnes Per Annum 10Key Competitive Strengths
Capacity Utilized Recovery Process Strong Clientele
High Capacity Utilization with Steam generated from Diversified Product Use in Multiple
Annual contract for its sales to Processes are utilized Industries
Indian Customers efficiently Low Customer Concentration
Low Cost Producer Strategic Location Unique Position
One of the Lowest Cost of Plant being near to Port – Huge
production of Phthalic Saving in Freight Cost along Market Leader having over
Anhydride due to with Proximity to the Chemical ~50% of the share in India
Manufacturing Efficiencies Belt of India
11Industry Overview
12Industry & Outlook
Imports
Infrastructure Imports have risen
Development continuously in the last 3
Infrastructure years on back of high
Development
Highest Budget by the domestic demand
Highestgovernment
Budget byforthe
Infrastructure Development FY17 – 90,000 MT
government for
at 3.96 lakh crores FY18 – 1,00,000 MT
Infrastructure
FY19 – 1,20,000 MT
Development at With having a better economic
Indian Market Size 3,96,135 crores Industry Growth Pricing Policy
scenario, improved consumption
Pricinginfrastructure
and increased of Phthalic thrust,
Phthalic Anhydride is PA to grow 7% - 8% Anhydride & Ox is as
annually in future, the Company is uniquely positioned
~3,75,000 MTPA per the PLATTS i.e.
Import Duty &to partake in the industry
Maleic Anhydride (MA) is
backed by the thrust of internationally pricedgrowth as
Infrastructure and GDP Anti-Dumping Duty well as substitute imports resulting
~55,000 MTPA growth
Import Duty of 7.5% on in higher market share
Phthalic Anhydride
Housing Development Dominance by Asia
ADD of 8% - 9% on
Pacific
Japan,Region
Russia, Korea,
Propose to facilitate higher
Taiwan & Israel
investment in affordable Likely to expand at a
housing, by giving CAGR of 6.10% from
infrastructure status 2016-2024
13Huge Domestic Opportunity
Low per capita consumption of End User Industry of PAN in India
20.0
India Consumption World Consumption
17.0 17.0
4.0
3.0 3.0
2.1 1.6 1.7
1.4 1.2
0.2
Polyesters Plastics Synthetic Rubber Synthetic Fibre Polymer Paints
Opportunity….
2x 6x 9x 4x 8x 9x
End User Industry expected to grow by 12% - 13% CAGR for next 3-5 years
14Financial Highlights – Q1 FY20
15Financial Highlights – Q1 FY20
Revenue^ EBITDA^ PAT
352 86 40
250
26
9
Q1FY19 Q1FY20 Q1FY19 Q1FY20 Q1FY19 Q1FY20
Rs. Crores
EBITDA^ (%) PAT (%)
24.4% 11.3%
10.4%
3.6%
Q1FY19 Q1FY20 Q1FY19 Q1FY20
The Financial Results have been prepared in accordance with the Indian Accounting Standards (Ind AS)
^ Includes Other Income * On Standalone Basis 16Profit & Loss Statement – Q1 FY20
Particulars (Rs. Crores)* Q1 FY20 Q1 FY19
Revenue from Operations^ 250 352
Total Raw Material 178 226
Employee Expenses 14 16
Other Expenses 32 24
EBITDA^ 26 86
EBITDA Margin (%) 10.4% 24.4%
Depreciation 8 6
EBIT 18 80
EBIT Margin (%) 7.4% 22.7%
Finance Cost 4 3
Exceptional Items - 10
Profit before Tax 14 68
Tax 5 28
Profit After Tax 9 40
PAT Margin (%) 3.6% 11.4%
EPS 2.95 13.60
Production and sales were impacted for the quarter ended 30th June 2019 due to planned shut down and maintenance
^ Includes Other Income
The Financial Results have been prepared in accordance with the Indian Accounting Standards (Ind AS)
* On Standalone Basis 17Financial Highlights
Revenue^ (Rs. Crores) EBITDA^ (Rs. Crores) and Margin % PAT (Rs. Crores) and Margin %
23.6% 12.8%
17.8% 9.8%
16.5% 8.9%
1,311 271 147
1,204 1,187 1,148 234
1,041 11.9% 6.3% 116
953 102
6.8% 172
5.0%
0.8%
113 0.3% 60
80
60
3 9
FY14 FY15 FY16 FY17 FY18 FY19 FY14 FY15 FY16 FY17 FY18 FY19 FY14 FY15 FY16 FY17 FY18 FY19
Net Debt (Rs. Crores) & Net Debt / Equity ROE % ROCE %
0.7
0.6
0.3 27.7% 43.2%
26.0%
180 0.2 0.2
0.1 20.6% 31.7%
135 18.5%
129 24.3% 26.5%
99
82 18.0%
11.2%
20 3.7%
1.2%
FY14 FY15 FY16 FY17 FY18 FY19 FY14 FY15 FY16 FY17 FY18 FY19 FY14 FY15 FY16 FY17 FY18 FY19
^ Includes Other Income 18For further information, please contact
Company : Investor Relations Advisors :
I G Petrochemicals Ltd Strategic Growth Advisors Pvt. Ltd.
CIN: L51496GA1988PLC000915 CIN: U74140MH2010PTC204285
Ms. Vama Gala Mr. Deven Dhruva / Mr. Rohan Adhiya
vgala@igpetro.com deven.dhruva@sgapl.net / rohan.adhiya@sgapl.net
+91 9833373300 / +91 9833219522
www.igpetro.com www.sgapl.net
19You can also read