INVESTOR PRESENTATION - September 2021 - Tata Steel
←
→
Page content transcription
If your browser does not render page correctly, please read the page content below
INVESTOR PRESENTATION
     September 2021

                      1
Safe harbour statement

Statements in this presentation describing the Company’s performance may be “forward looking
statements” within the meaning of applicable securities laws and regulations. Actual results may differ
materially from those directly or indirectly expressed, inferred or implied. Important factors that could
make a difference to the Company’s operations include, among others, economic conditions affecting
demand/supply and price conditions in the domestic and overseas markets in which the Company
operates, changes in or due to the environment, Government regulations, laws, statutes, judicial
pronouncements and/or other incidental factors.

                                                                                                        2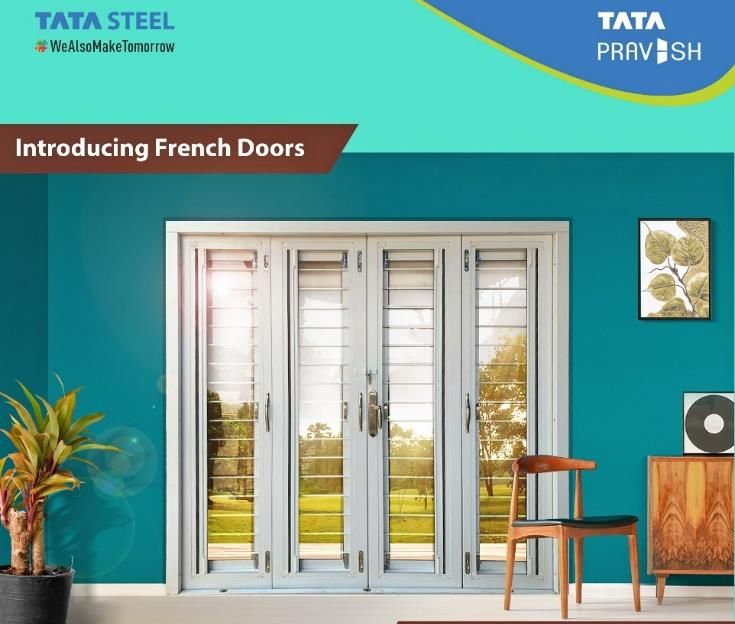
Overview

                                                                                                                                               Global scale of operations
▪ Flagship company of Tata Group
                                                                                                                      India1                  ▪ Highly integrated and profitable India operations
                                                                                                                                              ▪ One of the lowest cost producer in the world
▪ Integrated steel producer having 34 MTPA steelmaking
                                                                                                                                              ▪ Steelmaking capacity: 19.6 MTPA with 5 MTPA
  capacity with operations in India, Europe and Southeast Asia                                                                                  Kalinganagar Phase II expansion underway
                                                                                                                                  61%
                                                                                                                                              ▪ Product portfolio includes Flats (HR, CR, Galvanised,
                                                                                                                                                Coated), Longs (Wire Rods, Rebar), Wires and Tubes
▪ Key Consolidated financials of FY2021:
                                                                                                                                              ▪ Raw material linkage – 100% integration in Iron ore
   o Revenues : Rs.1,56,294 crores / US$21 billion
                                                                                                                                                and ~25-30% integration in Coking coal
   o EBITDA             : Rs.30,892 crores / US$4.2 billion
   o PAT                : Rs.8,190 crores / US$1.1 billion                                                           Europe                   ▪ Steelmaking capacity: 12.4 MTPA at Netherlands and
                                                                                                                                                UK
                                                                                                                                   31%
▪ Market Capitalisation: Rs.1.74 trillion / US$24 billion2                                                                                    ▪ Product Portfolio includes Strip Products (HR, CR,
                                                                                                                                                Galvanised, Coated, Plated & Precision), Tubes,
▪ Constituent of: Nifty50, BSE Sensex and MSCI India                                                                                            Electrical steel

                                                                                                                  Southeast                   ▪ Steelmaking capacity: 2.15 MTPA across Singapore
▪ Credit Ratings:                                                                                                   Asia                        and Thailand
    o S&P                         BB                  CreditWatch Positive                                                         8%
                                                                                                                                              ▪ Product portfolio includes Rebars, Wires and Wire
    o Moody’s                     Ba2                 Stable                                                                                    Rods, Semi-finished steel
                                                                                                                  4…
                                                                                                                   Steel deliveries in FY21

1. Tata Steel India (Tata Steel standalone, Tata Steel BSL and Tata Steel Long Products); 2. As per Bloomberg on 3 rd September 2021; HR – Hot Rolled; CR – Cold Rolled;                              3
Exchange rate: US$ = Rs.74.2096; 1 Crores = 10 million
Tata Steel is focused on creating sustainable value

                                             Consolidate
             Leadership in                                       Robust financial
                                           position as global
                 India                                               health
                                              cost leader

                                           Leadership position
              Leadership in                                      Become culturally
                                              in technology
              sustainability                                       future ready
                                                and digital

                                                                                     4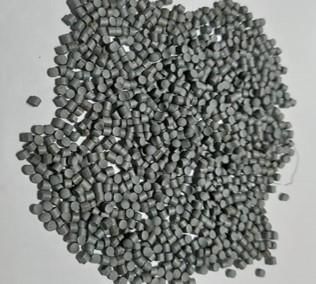
Our strategy is pivoted around capitalizing on India growth story…

                  Targeting value accretive growth in India                                                                      India to be the dominant manufacturing
                                                                                                                                 base for Tata Steel going forward

                                                                                                                      2010: 22 MTPA             2020: 34 MTPA           2030F: 55 MTPA
   Production capacity (MTPA)

                                                                                                                                 29%
                                                                                                                                                           57%
                                                                                                                                                                                    73%

                                                                                                                                        India     Europe         South –East Asia

                                                                                                                                 Optimizing product portfolio is a key target
                                                                                                                                 in India
                                                                                                                                                                 Production capacity (MTPA)
                                                                                                                          Flat     Long
                                                                                                                                                                            30

                                                                                                                                                   15.6
                                                                                                                                                                                    10
                                                                                                                           3.7      2.9                      4
                                                        TSK –
    2018         TSBSL        TSLP          2020                       2025      (organic /     2030
                                                       Phase II                                                                  2010                 2020                    2030F
                                                                                Inorganic)
                                                        / EAF

                                                                                                                                                                                          5
TSBSL – Tata Steel BSL; TSLP – Tata Steel Long Products.; TSK – Tata Steel Kalinganagar; EAF – Electric Arc Furnace
…with future investments focussed upon sector leading returns

                             India Steel                                                    New & Allied
                             Production                                                     Business

                                                           Downstream
                                                          Portfolio in India

 › Complete 5 MTPA Kalinganagar            › Cold Rolled Products – From 4.3 MTPA to 6.5 MTPA   › Electric arc furnace low carbon Steel
   expansion
                                           › Ductile Iron Pipes - From 0.2 MTPA to 1 MTPA       › Composites
 › Raw Material expansion to 50            › Tinplate – From 0.4 MTPA to 1 MTPA                 › New Materials Business
   MTPA of Iron Ore
                                           › Tubes – From 1.3 MTPA to 2 MTPA                    › Commercial mining

                                           › Wires – From 0.45 MTPA to 1 MTPA

                                                                                                                                    6
Continuous focus to attain and retain leadership in chosen segments for strong
market presence

                                                                                                                                               Leadership position in chosen                Market share
                                                                                                                                                    segments in India                       FY18 FY21
                                                                                                                                                           ▪ 1 in every 3 outer panels
    Preferred                          40 brands across customer                                  Over Rs.10,000                                                                       45%4        58%4
                                                                                                                                                           ▪ 2 in every 3 wheels
 supplier for auto                     segments contribute >1/3rd                             crores / US$1.3 billion
   customers                                of India revenue                                   of annual retail sales                                      ▪ 1 in every 2 LPG
                                                                                                                                                                                            40%    52%
                                                                                                                                                             cylinders in India

Service centers for last                                                                       250+ distributors and                                       ▪ 2 in every 3 continuous
                                                                                                                                                                                            55%    62%
      point processing                                                                         14,600+ dealers                                               welding electrodes

                                                                                                                                                           ▪ Tata Shaktee - 1 out of 2
                                                                                                                                                                                            35%    45%
50+ Product Application                                     Strong                                                                                           GC roofs
                                                         distribution                          Covering 95%
             Engineers                                                                         districts across India                                      ▪ Tata Tiscon – Rs.7,500
                                                           network
                                                                                                                                                             crores/US$1 billion plus       14%    15%
                                                                                                                                                             brand
 100% fleet covered by                                                                         6 Hubs1 and 14
                                                                                                                                                           ▪ Tata Astrum - 1st in the
vehicle tracking system                                                                        spokes2                                                       world laser marking on         18%    21%
                                                                                                                                                             HR Coils (2019)
                                                       TOC3 enabled                                                                                        ▪ Tata Steelium - 1st in
                                                                                                                                                                                            18%    15%
                                                        supply chain                                                                                         branding CR (2003)

 1. Hubs: large warehouses, 2. Spokes: Small warehouses ; 3. Theory of constraints; 4. Auto flat product market share; ECA: Emerging customer accounts (small & medium enterprises); GC -
                                                                                                                                                                                                    7
 Galvanised Corrugated; All % market share include Tata Steel BSL from FY19 onwards; Exchange rate: US$ = Rs.74.2096; 1 Crores = 10 million
We are investing in capabilities to attain leadership position in adjacent businesses

      Services & Solutions                     New Material Business                      Commercial Mining
                                           Composite                Graphene

                                                   Medical Materials

 › Servitizing steel to de-risk business   › Capitalizing future needs of existing   › Chrome business

    o Pravesh – Doors and windows            segments while adding new ones          › Mine Developer and Operator business

    o Nest-in – solutions for society                                                › Strategic minerals play

                                                                                                                         8
Continuous structural and operational improvements key to achieve our financial goals
Global cost leader Among the lowest 3 on the global HRC cash cost curve
All figures are in Rs. crores
5 year cost savings at Transformation programme at
Tata Steel India operations Tata Steel Europe
Cost and Supply chain Optimisation Overhead cost reduction
6,545
332 5,369 2,252 2,177
1,916 505
3,556 542
1,590 960
755
4,298 1,635
3,406 2,801 3,274 1,292
2,594
FY17 FY18 FY19 FY20 FY21 FY20 FY21
TSN TSUK
TSL TSBSL TSLP
9
TSL: Tata Steel Standalone; TSBSL: Tata Steel BSL; TSLP: Tata Steel Long Products; TSN: Tata Steel Netherlands; TSUK: Tata Steel UK; 1 Crores = 10 millionAll key metrices continue to improve
EBITDA Margin (%)1 EBITDA / ton (Rs.)1 Interest Coverage Ratio (x)1,2 Gross & Net Debt (Rs. crore)
22,779 8.9
30.3%
1,16,328
1,00,816
92,147 88,501 84,237
18.9% 19.8%
83,014 1,04,779
17.2%
11,110 94,879
14.5%
12.2%
9,337 10,838 3.9 3.9
7,129 3.4 4.1 72,367 69,215 75,389 73,973
6,267
2.4
Net Gross
FY 17 FY 18 FY 19 FY 20 FY 21 1Q FY 17 FY 18 FY 19 FY 20 FY 21 1Q
FY 17 FY 18 FY 19 FY 20 FY 21 1Q FY 17 FY 18 FY 19 FY 20 FY 21 1Q
FY22 FY22
FY22 FY22
Net Debt / EBITDA (x)3 Net Debt / Equity (x) Credit Rating
5.91 1.72 7
BBB-/ Baa3 Investment Grade
6
BB+/ Ba1 S&P
1.43 1.42 Moody's
1.37 5
BB/ Ba2
4.25 4
BB-/ Ba3
3.20 3.19 2.44 3
1.59
0.91 B+/ B1
0.98
2
B/ B2
1
FY 17 FY 18 FY 19 FY 20 FY 21 1Q FY 17 FY 18 FY 19 FY 20 FY 21 1Q
FY22 FY22 0
B-/ B3
Apr-16 Apr-17 Apr-18 Apr-19 Apr-20 Apr-21
FY17 FY18 FY19 FY20 FY21 Aug’21
All data is on consolidated basis; 1. FY20 and FY21 includes Southeast Asia (SEA) Operations which is reclassified as continuing operations; 2. Interest Coverage Ratio: EBITDA / Interest; 10
3. 1QFY22 based on 12 trailing month EBITDA; 1 Crores = 10 millionPathway for our future financial strategy
▪ Investment grade financial metrics; strong earnings and cashflow performance
▪ US$2 billion+ gross debt reduction while prioritize off-shore debt pre-payment
Short-term ▪ Continued focus on capital allocation, cashflow and working capital management
(FY22 targets)
▪ Capex of ~Rs.10,000-12,000 crores / ~US$1.3-1.6 billion
Target Leverage Target RoIC Dividend Policy
Net Debt/EBITDA at 2x Progressive dividend
15%
Interest Cover at 4x policy; robust pay-out
Medium-term
(Across cycle
targets)
RoIC: Return on Invested Capital 11Sustainability is deeply embedded in Tata Steel ecosystem
Key achievements 2025 goals 2030 goals
▪ TSI: AchieveWe aspire for leadership position in identified technology areas
Use of low-quality Iron ore, Technologies for generation Technologies for Water Use of AI to drive process
coal and ferro alloy minerals /usage of green/blue H2 in neutrality through Reduce, excellence and ‘first time right’
steel value chain Reuse & Recycle in steel value chain
Low Quality Hydrogen Water Digital
Raw Materials
Carbon Capture and Coatings
Mobility
Utilization
Technologies for CO2 Material leadership in Breakthrough coating solutions
Capture, Storage and mobility domain serving needs better than
Utilisation competition
13Becoming culturally future ready will provide the platform for future value creation
Strengthening enablers for Future of ‘Work’, ‘Workforce’ and ‘Workplace’
Culture of Safety, Continuous
Agility, Innovation and
improvement, Ethics & Giving
Technology leadership
back to the community
Certified as
India’s Best
Digital and Anaytics as a Workplaces by Progress towards
way of life ‘Great Place to benchmark productivity
work’ for the 4th
time
Unique policies deployed to Enabling capabilities and
drive diversity and inclusion career to unleash potential
14Our efforts are recognized globally and nationally
TSL and TSE
recognized as Safety & Health Excellence Recognized as the
‘Sustainability Recognition 2020 for world's most ethical
Champions’ by Digitalization of Process companies for the
Worldsteel (4th Safety Performance 10th time by
time in a row) Indicators (PSPI) Ethisphere Institute
Rated ‘A-’ 3 Assets recognized
(Leadership band) Certified as the as Global Lighthouses
for our Climate Best Workplace in by WEF (Jamshedpur,
Change and Supply Manufacturing 2021 Kalinganagar and
Chain disclosure IJmuiden)
Rated amongst Dun & Bradstreet Recipient of Prime
top 5 Steel Corporate Award Minister’s Trophy for
Companies 2019 in the 11 times (out of 25) for
globally. category of the Best Performing
Corporate Social Integrated Steel Plant
Responsibility
15
TSL: Tata Steel Limited, TSE: Tata Steel EuropeWe are on our way to build the Tata Steel of the Future
▪ Most respected and preferred supplier by discerning customers
▪ Be one of the lowest cost producer globally
▪ Strong focus on Free cash flow to create shareholder value
Most respected and ▪ Leadership in sustainable practices: low carbon business model at scale
valuable steel company
in the world by 2030
▪ Recognized as technology & innovation leader by customers, peers,
employees and investors
▪ Culture and values for the next generation and global benchmark in
corporate citizenship
16You can also read