IL TUFFATORE, THE DEBT-FUELLED DYNAMIC ACCELERATES - HOUSE VIEW MAY 2020 - Banca March
←
→
Page content transcription
If your browser does not render page correctly, please read the page content below

Il Tuffatore. The Tomb of the Diver.
                         Paestum. Magna Grecia. 450 a.C.

HOUSE VIEW
MAY 2020

IL TUFFATORE,
THE DEBT-FUELLED
DYNAMIC ACCELERATES
HOUSE VIEW. MAY 2020

IL TUFFATORE, THE DEBT-FUELLED DYNAMIC ACCELERATES
Perhaps one of the most accurate representations of what lies ahead for the global economy is depicted in the
images of the Tomb of the Diver, in Paestum. This fresco, located in an Etruscan tomb that dates back 2,500
years, depicts a swimmer diving headfirst from the Pillars of Hercules. As the global economy crashes and the
deepest recession since the Great Depression beckons, the unforgiving gravity that compels the diver towards
the water speaks eloquent volumes. But that is not the only story this fresco tells. A tomb is the place where the
transmutation from death to reconstruction takes place, and the swimmer is a metaphor for the transition from
the world we know to what lies beyond: an unprecedented paralysis of economic activity and a decisive response
by the authorities.

As we discussed last month in The Spring Offensive, or Kaiserschlacht, governments and central banks have
shown steely determination in their response to collapsing economic activity. In some respects, the consequences
of Covid-19 are on a par with the impact of a war; in fact, the death toll from the disease in the US has surpassed
the number of Americans killed in the Vietnam War by 20%. The response by the US government, measured in
terms of fiscal deficit, has been more robust than its response to most past conflicts.

1. FISCAL BALANCE US FEDERAL GOVERNMENT / GDP
  Source: US Government Spending. Estimates 2020 and 2021 Congressional Budget Office. Banca March

                                                                                                            World War 2

                                                                                                                                        COVID-19
                                                                                       World War 1

                                                                                                                                   Financial
                                                     American Civil War
                                                                                                                                     crisis
                                                                                                    Great
                                                                                               Depression           Reaganomics
                             War of 1812

Graph 1 provides the historical context for the extraordinary 17.9% deficit to be reached this year, following the US
government’s decision to step up aid for small businesses; the only time the deficit has surpassed this level was in
the Second World War.

As time goes by, the Spring Offensive continues, and the world continues to step up its stimulus measures.
Governments are increasing tax aid packages and expanding credit lines and state-backed loan guarantees, whilst
central banks are ramping up the volume of asset purchases (graph 2). In April, they also lowered the minimum
credit ratings on the assets they are prepared to buy. The Fed is to start buying fallen angels - issuers that lose their
investment grade rating during the crisis - and the ECB has made fallen angel bonds collateral eligible.

IL TUFFATORE, THE DEBT-FUELLED DYNAMIC ACCELERATES                                                                                                   2
HOUSE VIEW. MAY 2020

2. STIMULUS MEASURES                                                 3. CENTRAL BANK BALANCE SHEETS
   Source: Bloomberg, Bruegel and Banca March                         Source: Bloomberg and Banca March

                                                                                                       Size of balance sheet (%GDP)
        4.000                                                  60%   60

                                                               50%   50
                                                                                                                                                                COVID-19
                                                                                                                                                                +16,7 p.p.
        3.000                                                                            FED      BCE
                                                               40%
x €bn

                                                                     40
        2.000                                                  30%                                     Sovereign debt crisis
                                                                                                            +10,1 p.p.
                                                                                                                                     QE III
                                                               20%   30                                                             +7,9 p.p.
        1.000                                                                  Financial crisis                                                                COVID-19
                                                                                                                                                               +23,9 p.p.
                                                               10%                +5,1 p.p.
                                                                     20
            0                                                  0%
                   Eurozone        United Kingdom     US             10
                Immediate fiscal support        Deferred payments              Financial crisis
                                                                                  +9,1 p.p.
                Credit lines and guarantees     Monetary              0
                                                                          06     07      08 09    10     10      11     12     13     14        15   16   17   18     19     20
                Total % GDP (right)

Graph 3 shows the rate at which central bank balance sheets have swelled; the Federal Reserve, for example, will
double its balance sheet before the end of the year, jumping from 19% of GDP pre-Covid to 43%. The ECB is set
to expand its balance sheet from 39.2% to 56% of GDP. Taking these fiscal measures in conjunction with the lines
of financing and central bank asset purchases, the combined response is enormous; it will total 34% of GDP in
the US and in Europe, where the figures will be impacted more by the lines of credit announced, total stimulus
measures could stand at 48% of GDP. It is important to point out, however, that the immediate fiscal measures
announced in the US are almost three times higher than the measures announced in Europe (9.1% of GDP versus
3.3%, as represented by the dark green lines on graph 2) and that the real, 100% implementation of credit lines
will take time, and remains to be seen.

As we begin to see the first lockdown de-escalation measures and the next set of macro data reveals an ongoing
peak in the paralysis of economic activity, this combined raft of stimulus measures will mitigate the economic
shock, reduce the impact on companies’ solvency, facilitate liquidity and provide a firm support level for credit
and equities. As investors, now the initial panic has subsided, we must focus on the speed at which we are likely
to return to previous growth rates; as we will explore below, this will not happen quickly, and we will need to be
patient.

The only problem with these desperate, effective, practically inescapable measures by regulators is that over the
medium term, there will be even more debt to service, and debt levels were already high. This will hamstring
the growth potential of an economy that was already seeing growth tapering off, which means the debt-fuelled
dynamic - which has grown relentlessly in previous economic crises - has accelerated further still.

                                                                     The Tomb of the Diver. Left lateral wall. Paestum. 450 BC

IL TUFFATORE, THE DEBT-FUELLED DYNAMIC ACCELERATES                                                                                                                                3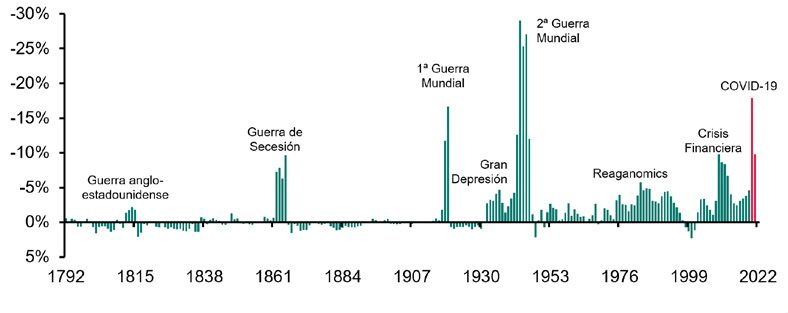
HOUSE VIEW. MAY 2020

In The Tomb of the Diver, as well as the diver himself, there is a reclining man holding an egg, the universal symbol
of renewal and rebirth. The figure is believed to be Dionysus, the ancient Greek god of wine and fertility.

The coronavirus has brought death, quarantine and desperation to find the right measures to help us overcome
the struggle. If one thing is clear, however, it is that as we emerge from this crisis, the existing dynamic has
accelerated: debt to subsidise a world without growth, interest rates at zero interest and central banks picking up
the tab. Our new isolated way of life will also mean more technology, digitalisation and e-commerce.

Joan Bonet Majó
Chief Investment Strategist

IL TUFFATORE, THE DEBT-FUELLED DYNAMIC ACCELERATES                                                                  4
HOUSE VIEW
MAY 2020

THE FIRST STEPS
TOWARDS NORMALITY
HOUSE VIEW. MAY 2020

THE FIRST STEPS TOWARDS NORMALITY

   ASSET ALLOCATION
   ASSET CLASS                -2    -1    NEUTRAL     +1       +2

   LIQUIDITY

   FIXED-INCOME

   EQUITY

   ALTERNATIVE

   FIXED-INCOME               -2    -1    NEUTRAL     +1       +2

   SOVEREIGN DEBT

     High quality (AAA)

     Peripheral

   CORPORATE BONDS

     Investment Grade

     High Yield

   EMERGING DEBT

   CONVERTIBLE BONDS

   EQUITIES                   -2    -1    NEUTRAL     +1       +2

   EUROPE

     United Kingdom

   UNITED STATES

   EMERGING

   REST OF THE WORLD

   CURRENCIES                 -2    -1    NEUTRAL     +1       +2

   U.S. DOLLAR

   STERLING POUND

MACROECONOMIC LANDSCAPE

With the worst of the pandemic now behind us, the de-escalation plans commence.
With an official Covid-19 tally of over three million cases, two hundred thousand deaths and more than a million
recoveries, the world is beginning to emerge from the lethargy of lockdown and de-escalation plans are starting to
take shape. The worst is now behind us and we are heading into a new phase, as we slowly seek some semblance
of normality, plagued by the fear that lifting lockdown too soon could trigger a new wave of the epidemic.

THE FIRST STEPS TOWARDS NORMALITY                                                                                6
HOUSE VIEW. MAY 2020
In Asia, lockdown in the Chinese city of Wuhan was officially lifted on 8 April, and in the rest of China, the
measures were lifted depending on the degree to which each region was affected. The proportion of companies
that have resumed activity in the country as a whole stands at 97.6%, and production is at 82.8%. Schools are
beginning to open, as is domestic tourism, following the symbolic opening of Beijing’s Forbidden City. South
Korea’s successful Covid-19 strategy has been based on information, medicine and technology. In late April, the
country had reported no deaths from the pandemic and economic activity was starting to gain traction.
In Europe, de-escalation plans are getting underway, but will be rolled out more gradually than in China, with
a delay of around one month in Spain. Spearheading the de-escalation are Denmark - schools are open and
hairdressers are operating at a healthy clip - as well as Austria and Germany, where some smaller establishments,
including certain museums, are now open. On the continent, plans to open schools are underway except in Spain,
Italy and Portuguese primary schools.
1. LOCKDOWN PERIOD BASED ON DURATION IN WUHAN
Source: Governments; Banca March
Start End*
Wuhan 23-jan. 8-apr.
Italy 10-mar. 25-may.
Denmark 13-mar. 28-may.
Spain 15-mar. 30-may.
France 15-mar. 11-may 30-may.
Austria 16-mar. 31-may.
NY USA 20-mar. 4-jun.
CA, USA 20-mar. 4-jun.
Germany 23-mar. 7-jun.
United Kingdom 24-mar. 7-may. 8-jun.
Lockdown Economic hibernation Opening of small businesses Opening of schools
In Spain, the official de-escalation began on 4 May, with a four-phase, asymmetrical plan and the goal of reaching
relative normality by late June, when hotels and tourist accommodation should theoretically be able to open. In
Italy, four and a half million people are back at work, and bars in central Rome are offering takeaway meals.
In the US, which has recorded the highest number of cases and deaths, the messaging is more confusing and less
uniform, as the de-escalation plans are recommended at the federal level but how to implement them is decided
independently by each state. The world’s largest economy is moving swiftly towards normality nonetheless; a
total of twelve states are already allowing non-essential businesses to reopen.
2. STATE RESTRICTIONS ON BUSINESS RE-OPENINGS
Source: Kaiser Foundation
WA
MT ME
ND
OR MN WT
ID NH
SD WI NY MA
WY RI
CT
IA PA NJ
NV NE
OH DE
UT IL IN MD
CA CO WV DC
KS VA
MO KY
NC
TN
AZ OK
NM AR SC
MS AL GA
TX LA
AK FL
HI
All closed Fully reopened (some) Partial reopening (all)
Partial reopening (some) Some closed No restrictions
THE FIRST STEPS TOWARDS NORMALITY 7HOUSE VIEW. MAY 2020
Early macroeconomic indicators confirm an abrupt downturn in activity.
The early macroeconomic indicators coming out now, which relate to the period when infections were growing
at their fastest and economies were shutting down, have confirmed our worst fears, reflecting a sharp downturn
in activity. As graph 3 demonstrates, GDP shrank in the three main regions in the first quarter of the year. The
hardest-hit economy in Q1 was China, where the virus spread initially, which saw a quarterly drop in GDP of -9.8%.
The eurozone also sustained a severe blow to economic activity, contracting by -3.3% over the quarter. Even in
the US, which was hit by Covid-19 somewhat later, GDP figures confirm that social isolation measures have had
a direct, fierce impact on consumer spending, which – as we anticipated in previous reports – will be one of the
components that suffers the most.
3. SHARP DOWNTURN IN ACTIVITY 4. PLUMMETING BUSINESS CONFIDENCE
Source: Bloomberg and Banca March Source: Bloomberg and Banca March
4 Quarterly GDP performance (%) 60
2 50
0
40
-2 -1,2
33,4
-4 30
-3,8
-6 -5,2 20
-8 13,6
10 12
-10
-9,8
-12 0
mar.-18 jun.-18 sep.-18 dec.-18 mar.-19 jun.-19 sep.-19 dec.-19 mar.-20 apr.-18 jul.-18 oct.-18 jan.-19 apr.-19 jul.-19 oct.-19 jan.-20 apr.-20
US Eurozone Spain China
Composite PMI Threshold Manufacturing PMI Services PMI
The abrupt downturn in activity has been reflected extremely quickly in employment figures, whilst business
confidence indicators in the eurozone suggest that we will see the worst of the downturn in April and May
(graph 4). The composite PMI for the region fell to a record low of 13.6 in April, auguring the severe contraction
in economic activity this quarter. Whilst industry appears to be holding up relatively well, the service sector has
been impacted heavily by the lockdown measures.
A steeper decline and gradual reopening have led to downgraded forecasts.
The rapid downturn in activity data in Q1, coupled with recent announcements on de-escalation processes, have
led us to downgrade our growth forecasts. In May, we have begun to take the first steps towards normal life, but
the process will be slow and gradual.
We expect to see a deep recession in the first half of the year, with the worst contraction in modern economic
history. However, we continue to believe that the transient nature of lockdown measures and particularly the
robust raft of fiscal and monetary stimulus measures announced, will mean that this recession is short-lived.
THE FIRST STEPS TOWARDS NORMALITY 8HOUSE VIEW. MAY 2020
As graph 5 shows, activity will plummet to record lows in H1, then begin to recover in the second half of the
year. Despite this subsequent recovery, global GDP will be down by 2.9% year on year for 2020 as a whole. This
scenario means we will not claw back late-2019 levels until Q1 2021, and at the end of the forecast period, global
GDP will still be -1.8% lower than we expected at the beginning of this year, as the recovery will now be less steep
than initially forecast (graph 6).
5. GLOBAL GDP 6. REVISIONS TO INITIAL FORECAST
Source: Oxford Economics and Banca March Source: Oxford Economics and Banca March
10 Global GDP forecasts (YoY) 110 Global GDP forecasts (YoY) -1,8%
8
6 105
4
2 100 -6,1%
0
-2 95
-4
-6 90
-8
-10 85
05 06 07 08 09 10 11 12 13 14 15 16 17 18 19 20 21 dic.-18 dic.-19 dic.-20 dic.-21
Adverse Activity resumes in Q3 December 19 Adverse Activity resumes in Q3 December 19
The uncertainty plaguing macroeconomic scenarios remains unusually high and these are only quantitative
estimations of the possible economic impact of the lockdown measures applied. The economic impact of the
health crisis will depend largely on how long the measures needed to contain the virus remain in place, and
the outlook in that respect is constantly changing. If the quarantine measures remain in place for longer than
expected, the economic impact will be more severe. Graph 5 shows a more negative alternative scenario involving
stricter, longer isolation measures in place until after the summer in the northern hemisphere, in which the impact
of deteriorating financial conditions would also cause increased destruction of the business landscape. In this
adverse scenario, the negative impact would be more structural and global GDP would be around -6.1% lower
than was forecast early this year (graph 6).
By regions, we believe the impact of the health crisis will be uneven. Specifically, the eurozone will be one of the
hardest-hit regions, as lockdown measures are having an impact on major economies like Spain, Italy and France;
these economies depend heavily on tourism, which accounts for an average of 12.5% of GDP, and which will be
one of the slowest sectors to recover due to restrictions on movement and consumers’ fears of infection.
7. GDP FORECASTS 8. TOURISM AS A PROPORTION OF GDP
Source: Oxford Economics, World Bank and Banca March Source: Oxford Economics, World Bank and Banca March
The US Eurozone China World 25% Travel and Tourism (%GDP, 2018)
10
8 20%
6 15%
4
10%
2
0 5%
-2
0%
-4
Greece
Portugal
Spain
Italy
China
United Kingdom
France
India
Germany
Brazil
The US
Japan
Canada
The Netherlands
Russia
-6
-8
2019 2020 p 2021 p
THE FIRST STEPS TOWARDS NORMALITY 9HOUSE VIEW. MAY 2020
Spain: one of the hardest-hit economies.
Social distancing measures have had an extremely severe impact on the Spanish economy in the first quarter
of the year which, coupled with the composition of the country’s production model itself, leads us to believe
that the economy will undergo a major contraction this year. In the first quarter, which included just two weeks
of the State of Emergency, GDP shrunk by -5.2% over the quarter and -4.1% year on year, which is the largest
drop in GDP on record. By components, private consumption dropped significantly (-7.5%) as did investment
(-5.8%). On the flipside, GDP from private consumption grew at +1.8%, in line with the increased efforts by public
administrations to tackle the crisis, especially in healthcare.
9. ELECTRICITY DEMAND In the second quarter, high-frequency indicators
Source: Red Eléctrica España and Banca March such as energy consumption show that activity
has continued to fall, with growth bottoming
105
out in April, when all non-essential sectors were
Electricity use
100 shut down. The good news is that before the
de-escalation process, the economy will already
Mov 7d avrg: 1 March = 100
Non-essential activity
Electricity demand (Gwh)
95 State of
Emergency shut down
likely have bottomed out.
90
Reopening of construction
85 and manufacturing
80
75
70
1-mar. 8-mar. 15-mar. 22-mar. 29-mar. 5-apr. 12-apr. 19-apr. 26-apr.
The inherent characteristics of the Spanish economy and the heavy weighting of the service sector - tourism,
hospitality and leisure account for almost 24% of GDP - mean that the economic contraction in 2020 will stand
at over -9% year on year.
10. SPANISH GDP YEAR-ON-YEAR Looking ahead to the rest of the year, the outlook
Source: INE and Banca March is shown from the supply perspective. The service
GDP and components
sector will not recover to the growth levels prior
(Suupply, YoY growth) to the State of Emergency this year, and it will be
0% Industry – and to a lesser degree Construction –
-3,1% that will spearhead the reactivation of economic
-4,1%
-5% activity in the second half of the year.
-10% -10,1%
-15%
-18,7%
-20%
2020 T1 2020 T2 2020 T3 2020 T4
Agriculture Industry Construction Services GDP
THE FIRST STEPS TOWARDS NORMALITY 10HOUSE VIEW. MAY 2020
China will continue to act as a model for what comes next.
However, although the difficulty in predicting the depth of the drop in GDP will continue, we do believe that the
focus should be on anticipating how economic activity will recover once our everyday lives return to a semblance of
normality. In that respect, we continue to believe that China can serve as an example.
As China was the epicentre of the virus, it will continue to be a good indicator of what will happen in the rest of the
world. The latest data coming out of China showed a 6.8% year on year drop in GDP in Q1, but the various economic
components put in uneven performances, revealing important patterns as to what the initial stages of the recovery
will look like in other countries.
11. CHINA: ACTIVITY HAS COLLAPSED, BUT NOT EVENLY As graph 11 shows, during the months when
Source: Bloomberg and Banca March the infection rate was at its peak, consumption
tapered off sharply, but in March, when the
20%
Retail sales
11,6%
restrictions began to be lifted, sales of more
(Restaurants) 8,8% 9,9%
10% 6,1% 6,9% 6,5% durable and technology goods recovered quickly.
Retail sales
1,8% Mobile sales, for example, fell by 8.8% year on
0%
(Auto) year between January and February, but grew by
-10% 6.5% in March. However, the restaurant sector
Retail sales -8,8%
(Mobiles) -13,8% continued to fall, even faster than in previous
-20% -18,1% -18,3% months.
Industrial prod.
-30%
(Cement) -29,5%
-40% -37,0%
Industrial prod. -39,7%
(Computers,
Comms. and -50% -46,8%
Others) dec-19 jan - feb 20 mar-20
The severe economic and social crisis will be followed by an unprecedented recovery, accelerating
structural changes.
The recovery in demand observed in China, 12. CONSUMPTION WILL HAVE TO ADAPT
coupled with behavioural studies, suggest that Source: YouGov and Banca March
after Covid-19, consumption and economic
activity will recover at different speeds depending
Surveys on post Covid-19 behaviour
on the sector. Once the infection rate has been 100% (% of population that will avoid behaviours)
contained and the collapse of the health service
has been avoided, lifting lockdown measures will 75%
not trigger an immediate return to normality,
given the potential change in behaviours we are
50%
likely to see (graph 12).
25%
0%
Spain Italy France Germany United US China India Japan
Kingdom
Avoid crowded places Avoid touching objects in public
THE FIRST STEPS TOWARDS NORMALITY 11HOUSE VIEW. MAY 2020
It is still too soon to say for sure which changes will be structural and long-term, and which impacts will be
temporary. In our view, there will be certain trends in the post-Covid world that will have unavoidable consequences
for the financial markets:
1. More debt, less growth potential and minimal interest rates: the fiscal stimulus required to reactivate
the economy and to inject liquidity into the private sector ahead of the economic shutdown will drive up
public debt levels. Central banks will continue to intervene in the markets and seek to stop financing costs
from spiking. Our baseline macroeconomic outlook in recent years, which envisages a world with lower
growth potential than in past decades and low interest rates for a substantial period, will therefore remain
valid.
2. Globalisation in response to the need to secure production chains: Some companies struggled to
access supplies at the outset of this health crisis, after China had to shut down its economy; this will
impact future decisions on the location of production chains and supplier relations, and will trigger a
resurgence of protectionist measures in some strategic sectors. Economic agents will be more mindful of
the risk involved in globally integrated supply chains.
3. Digitalization, news ways of working and communication: the changes in consumer behaviour and
particularly in interpersonal relationships over these few months will provide added tailwinds for the
digitalisation of the economy. Remote working, e-commerce and distance learning will all now be a more
prominent part of our lives. In the short term, however, people-intensive businesses and sectors like
tourism will need to reinvent themselves.
These trends are already reflected in the figures for online retail sales and education platforms. The
impact of the coronavirus crisis on physical retail outlets has been evident, but it is noteworthy that within
the Spanish tech sector (graph 13), initially it was pure play retailers that saw their share of sales increase.
However, as the public health crisis has advanced, companies that combine both online sales and physical
stores have now equalled that percentage. The change in shopping habits is already a reality, and while
this percentage may reduce once the lockdown is lifted, it is unlikely to return to the former status quo.
13. SALES CHANNELS DURING LOCKDOWN 14. DISTANCE LEARNING
Source: GfK, Udemy and Banca March Source: GfK, Udemy and Banca March
Consumption of technology goods Registration for online courses
(by sales channel) (Udemy)
100% 350%
90% 13% 17%
30%
80% 9% 8% 43% 41%
300%
46%
70% 250%
60% 18%
50% 200%
40% 39%
78% 75% 34% 40% 150%
30%
52%
20% 100%
10% 20% 18% 19%
50%
0%
jan-20 feb-20 mar-20 Week 14 Week 15 Week 16
(20 - 26 april) 0%
Physical stores Click & Mortar Pure Players Italy United Spain Germany India France US Mexico Brazil
Kingdom
% sinde February
Alternative training models are also attracting increasing demand: not only is online education being
used by education centres, but also by professionals who want to expand their training during lockdown,
according to figures released by online training platform Udemy (graph 14).
THE FIRST STEPS TOWARDS NORMALITY 12HOUSE VIEW. MAY 2020
4. Increased spending on healthcare: the need to find a cure for Covid-19 and the challenges of responding
to a global health crisis of this size will lead to additional funds being channelled into this sector. Investment
will come both from the private sector, buoyed by stronger growth forecasts, and from the public sector,
because the health crisis has emphasised the importance of this sector for national security.
There are also other changes which we currently believe to be temporary and secondary, but which must
nonetheless be monitored. The negative impact this health crisis is having in the short term on companies and
liquidity requirements has led many governments to intervene in the private sector through loans and even
capital injections. There are strong examples of this in the eurozone and in sectors like energy and airlines.
These interventions are good news for these companies’ bondholders, as they reduce the risk of disorderly
defaults in the short term; however, the impact on the long-term growth of these businesses and on shareholder
remuneration remains to be seen.
THE FIRST STEPS TOWARDS NORMALITY 13HOUSE VIEW. MAY 2020
CENTRAL BANKS AND FIXED INCOME
Central banks are extending their stimulus measures even further.
In April, the Fed continued to reinforce its stimulus plans and confirmed that its asset purchases will now
include corporate bonds issued by fallen angels, companies which have lost their investment grade ratings. At its
scheduled April meeting – its first non-emergency meeting since January – the Fed maintained its pro-stimulus
discourse in response to data which clearly evidences the downturn in the US economy. The Fed’s actions in
response to Covid-19 are previously unheard-of; from mid-March to late April alone, it expanded its balance sheet
by 54%. That equates to 2.3 trillion dollars, equivalent to two years’ GDP for a country like Spain.
The ECB has also expanded its own monetary policies. It has announced the conditions for TLTRO III and for
its new Pandemic Emergency Longer-term Refinancing Operations (PELTRO), designed to generate liquidity in
the interbank market with more advantageous conditions than the traditional LTROs. The novelty offered by
PELTROs is that the ECB will accept lower-rated collateral and that the interest rate will be -0.25% rather than
the current rate of 0% on its main refinancing operations.
The conditions of TLTRO III are more advantageous still: from June 2020 until June 2021 the rate will drop by
-0.25% to -0.50%, following the reduction announced in March. Banks could even secure financing at 50 bps less
than that rate - i.e., at -1%, if they can demonstrate an increase in their eligible net lending over a year. This move
is designed to channel liquidity into small businesses and households, which do not have access to the capital
markets and depend largely on banks for financing.
Meanwhile, the asset purchase programme remains underway, and between March and April the ECB made net
bond purchases worth 90 billion euros, of which three quarters were sovereign debt. As reflected in graph 15,
the key beneficiaries so far have been Italy, France and Spain, which are the countries that have been hit hardest
by the health crisis. The ambitious programme will continue, with 20 billion euros a month plus the 750 billion
Pandemic Emergency Purchase Programme (PEPP).
15. ECB PUBLIC SECTOR DEBT PURCHASES (PSPP)
Source: Bloomberg and Banca March
40
35
30
25
20
15
10
5
0
-5
-10
apr.-19 jun.-19 aug.-19 oct.-19 dec.-19 feb.-20 apr.-20
Spain Italy France Germany Rest
THE FIRST STEPS TOWARDS NORMALITY 14HOUSE VIEW. MAY 2020
Government bonds post unequal performances: the best-rated debt stabilises as tension
remains in peripheral bonds.
After the highly stressed conditions in March, central bank measures have curbed volatility in the fixed income
markets. The best-rated sovereign bonds remained stable over the month thanks to central bank purchases. US
10-year Treasury yields stabilised in the range of 0.60%–0.65%, and German bund yields held steady at -0.45%
to -0.55%. We expect yields to remain in these ranges over the coming months.
On the flipside, European periphery bonds have suffered occasional episodes of stress, especially when
governments have undertaken further issuances. At the end of April, issuances by Spain and Italy drove sovereign
credit spreads to levels very near to the maximum stress levels registered in March.
However, the key market event came when Fitch downgraded Italy’s sovereign rating to BBB-. Standard and
Poor’s confirmed Italy’s BBB rating, two notches above junk status, but with a negative outlook.
These episodes of volatility, as Brussels rushes to negotiate the finer points of the European Rescue Plan and the
amount that states will not have to repay, afford tactical opportunities to buy.
16. RISK PREMIUM SPAIN AND ITALY
Source: Bloomberg and Banca March
280
Issuance
260
240
Risk premium (bps)
220
S&P
maintains Fitch
200 rating cuts
rating
180
Issuance
160
140
120
100
80
1-mar. 8-mar. 15-mar. 22-mar. 29-mar. 5-apr. 12-apr. 19-apr. 26-apr.
Spain Italy
We continue to see opportunities in credit markets. We recommend being overweight
Investment Grade bonds and we have changed our outlook from underweight to neutral on
High Yield.
The decisions made in April by certain central banks in relation to the minimum credit ratings they are prepared
to accept have had a decisive impact on the performance of credit markets. Specifically, the Fed is to start buying
fallen angels – issuers that lose their investment grade rating during the coronavirus crisis – and the ECB has
made fallen angel bonds eligible as collateral for liquidity.
Spreads have eased substantially since the peak in March, by around 100 bps for global investment grade (IG)
credit and by twice that for high yield (HY). This has mitigated one of the main risks linked to IG credit, which
we discussed in last month’s report: 52% of European IG credit is rated BBB and is therefore exposed to rating
downgrades that could strip it of its IG status.
The Fed’s decision is a drastic one, and evidences the central bank’s concerns around the swift deterioration of
many companies’ ratings. There is no doubt that Q2 will be one of the most tumultuous periods in quite some
time. In April alone, Standard and Poor’s has opened 413 ratings actions on Western European bonds; the average
for the decade is 200 actions in the whole of Q2. In addition, the number of fallen angels soared at the end of
March, when lockdown began (graph 17).
THE FIRST STEPS TOWARDS NORMALITY 15HOUSE VIEW. MAY 2020
17. NUMBER OF POTENTIAL FALLEN ANGELS
Source: Moody’s
80
70
60
Number of issuances
50
40
30
20
10
0
Q1-2013 Q1-2014 Q1-2015 Q1-2016 Q1-2017 Q1-2018 Q1-2019 Q1-2020
BBB negative outlook BBB potential fallen angels
The Fed’s decision backs up our outlook for the asset class, and we believe that if the situation deteriorates in
Europe, the ECB could follow suit. In any case, despite the significant increase in prices over recent weeks, we
believe that the current implicit default rates of 3.5% are too high, especially bearing in mind that in the 2009
crisis, 0.6% of companies defaulted on their debt. At that time, rating downgrades impacted 21% of the IG issuers
and 31% of the HY issuers rated by Moody’s. As the table in graph 18 shows, investors have historically obtained
returns of 8% at 12 months by investing approximately at current levels.
HY also offers attractive valuations and historical data suggests we are currently looking at good entry levels.
Given the unpredictable nature of this crisis, however, we remain cautious in HY debt, as we believe that the
default rates and rating downgrades that will materialise over the quarters ahead will be high despite government
support, and will not, in reality, be far off what current implied default probabilities suggest (Graph 18). What’s
more, most HY debt will not enjoy central bank support, which puts it at a clear disadvantage versus IG.
18. IMPLIED PROBABILITY OF DEFAULT AND YIELDS
Source: Bloomberg and Banca March
35%
Invest. Grade Global Yield at one year if implied probability is…
30% Implied probability of default Around 3% Around 4% Around 5% Around 6%
Implied probability of default
Mean 8,1% 15,2% 21,1% 23,7%
25% 15,6% Median 7,9% 11,9% 22,2% 23,9%
Max. 30,4% 30,4% 30,4% 30,4%
20% Min. -16,1% -16,1% 8,9% 14,5%
15% High Yield Global Yield at one year if implied probability is…
Implied probability of default Around 8% Around 10% Around 12% Around 14%
10% Mean 12,5% 16,8% 22,4% 32,3%
Median 11,0% 15,5% 20,8% 31,8%
5% 3,5%
Max. 71,8% 71,8% 71,8% 71,8%
Min. -33,0% -25,9% -8,7% -4,4%
0%
01 02 04 06 08 10 12 14 16 18 20
IG Global HY Global
THE FIRST STEPS TOWARDS NORMALITY 16HOUSE VIEW. MAY 2020
Emerging market fixed income continues to offer excellent potential.
Emerging market sovereign bonds in hard currency posted gains in April, rising 8.5% from March lows, and
continues to trade at attractive entry levels with an IRR of 7.2%. Spreads remained stable over the month at
around 650 bps and we believe that there could be additional capacity for compression once the cut in oil supply
materialises, benefiting the countries that are most exposed to crude prices (Brazil, Russia and Mexico out of the
major economies). Buying at these spreads, over the last decade, emerging market fixed income in hard currency
has paid average yields of 18.4% at one year.
The probability of default implied from spreads is 10.5%, lower than global HY (15.5%) and very far removed from
what has traditionally been the case. As indicated in graph 19, this default rate has not been reached since 2006,
not even in the 2008 crisis, and on average, only 1.7% of EM issuers default on their payment obligations each
year. The worst year was 2017, when 4% of emerging market sovereign issuers went into default: Mozambique,
Belize, the Republic of the Congo and Venezuela, each for their own different reasons. We therefore believe
that the fear of defaults, currently focused on major oil producers like Russia, Saudi Arabia, Brazil and Mexico, is
excessive, and will gradually dissipate as economic activity begins to pick up.
19. EMERGING MARKETS % COUNTRIES DEFAULTING ON DEBT
Source: Moody’s and Banca March
5%
4,0%
Defaults by emerging market issuers
4%
3% 2,7%
2,3%
2%
1,5%
1,3% 1,2% 1,1% 1,1% 1,0% 1,0%
1%
0%
06 07 08 09 10 11 12 13 14 15 16 17 18
THE FIRST STEPS TOWARDS NORMALITY 17HOUSE VIEW. MAY 2020
EQUITIES
The markets are recovering at speed in an asymmetric ascent focused on the strong
performance of a few select stocks and sectors, which are spearheading the gains.
The decisive action taken by central banks and governments in response to the pandemic has allowed global
equity markets to recover to a significant degree. Gains from trough to peak stand at almost 30%. In April, the
S&P 500 chalked up its best monthly performance since January 1987, and had its third-best month for 80 years.
Despite these figures, it is important to emphasise that only 14% of companies are trending upwards (see graph
21, which shows the percentage of NYSE names that are trading at over their 200-session average), which gives
a clear idea of how asymmetrical the rally has been. Against this backdrop of sector-specific performances,
Technology (+13.5%) and Health (+11.5%) both outperformed, with US biotech stocks posting their strongest
monthly gains for two decades, and Energy, Industrials and Financials registered steep losses.
20. PERFORMANCE OF THE MAIN STOCK 21. S&P 500 AND % OF NYSE SHARES
MARKETS TRENDING UPWARDS
Source: Bloomberg. MSCI indices except Europe (Stoxx 600) and Spain Source: Bloomberg. MSCI indices except Europe (Stoxx 600)
(IBEX 35) and Spain (IBEX 35)
3500 90
3300 80
3100
70
2900
60
2700
50
(%)
2500
40
2300
30
2100
20
1900
1700 10
US Europe China Spain Nasdaq 100 1500 0
ene.-15 ago.-15 mar.-16 oct.-16 may.-17 dic.-17 jul.-18 feb.-19 sep.-19 abr.-20
S&P 500 % shares trending upwards (right)
Following this steep appreciation, the recovery process will be much slower. The lateral
market registered since mid-April is a good indicator of the movements we can expect over
the coming weeks.
The rally from lows in the main stock market indices has been unusually fast and intense, confirming the
importance of holding equity exposure steady and not selling down positions in moments of panic, such as the
second fortnight of March.
From now on, the vertical upward trend will taper, as corporate earnings will continue to fall. We believe it is
premature to consider recovery to pre-Covid earnings levels when forecasts are still being downgraded and these
downgrades will continue until at least Q3, after which the recovery rate will begin to stabilise.
We therefore maintain our recommendation of staying neutral and seeking to harness possible corrections to add
positions. In the short term, until it becomes clearer when the downturn in activity will bottom out and a medical
solution has been found for the health crisis, we will see recurring episodes of volatility.
THE FIRST STEPS TOWARDS NORMALITY 18HOUSE VIEW. MAY 2020
Should investors harness this rally to sell?
No. Despite the uncertainty landscape in terms of health, in which predicting future waves of Covid-19 is
impossible, and the slow de-escalation process that lies ahead, we maintain that the decisive, unprecedented
measures rolled out by central banks and governments will provide a safety net to curb the potential depth of
any future downturns. Direct asset purchases by central banks are an absolutely crucial measure.
The impact of Covid-19 is already evident in Q1 results season.
The quarterly results season is now beginning to peak, and corporate earnings are partly reflecting the impact
of the pandemic and economic slowdown. In the US, more than a third of the S&P500 companies have now
published results, with a 65% positive surprise ratio, the lowest for a decade. EPS is down by 16% excluding the
financial sector, which includes a substantial increase in provisions, and both revenues and profits have remained
flat. Once again, cyclical companies underperformed in relation to defensives and on the whole, Financials (-49%)
and Industrials (-15%) have posted the worst results to date. At the opposite end of the scale, earnings were up
for Real Estate (+17%) and Technology (+11%) and revenues grew for Health (+10%) and Technology (+5%).
In Europe, 40% of the Stoxx600 has posted results to date, and earnings are down by 19%, with a positive surprise
ratio of 54%. The drop in revenues so far stands at 5%. The sectors posting the worst earnings performances are
Consumer Discretionary (-71%) and Energy (-59%). On the positive side, like in the US, revenues grew in Health
(+11%) and Technology (+4).
The earnings downgrades estimated by the consensus of analysts are far less severe than
they were in the 2008 crisis. Earnings forecasts will continue to be downgraded.
As illustrated by graph 22, given the severity of the macro downturn and however swift the recovery may be, we
believe a drop in earnings of almost 15% is insufficient; in 2008/2009, the real correction in earnings was over
30% in the US and 40% in Europe.
22. ESTIMATED EPS GROWTH 2020 BY REGIONS 23. ESTIMATED EPS GROWTH 2020 BY
Source: Bloomberg, Refinitiv and Banca March GLOBAL SECTORS
Source: Bloomberg, Refinitiv and Banca March
15,0 20%
16
10% 6,5%
13 4,1% 2,6%
9,8 0,5%
10 8,9 8,5 0%
-0,4%
7 5,0 -10%
EPS growth
-9,4% -11,0%
EPS growth (%)
4 -20% -14,9% -16,6%
-20,1%
1 -30%
-2 -40%
-5 -50%
-8
-60%
-11 -9,4 -64,2%
-70%
-14 Tech Health Util C. Disc Tel World Mat Ind Fin C. Def Ene
-14,1 -14,7
-17
MSCI AC World S&P 500 Stoxx 600 MSCI EM
03 jan 2020 Current
THE FIRST STEPS TOWARDS NORMALITY 19HOUSE VIEW. MAY 2020
By sectors, Energy, Financials, Industrials and Consumer Discretionary together account for a third of the stock
market rally, but in the short term there is ongoing pressure from earnings downgrades for these sectors, and their
trading ratios remain above average. The earnings downgrades in the Energy sector are particularly interesting,
given that crude prices are at record lows, and we believe these could partially reverse once the economy returns
to a certain degree of normality.
By contrast, recommended sectors like Health and Technology have proven in the past to be more resilient
in downturns and enjoy stronger capacity for recovery when markets rise. Both sectors outperformed in April
(Technology +13.1%; Health +11.5%), but unlike the general index, they offer growing earnings forecasts with
reasonable ratios, fairly close to the average in the case of Tech and even more attractive in the Health sector.
24. TECH AND HEALTH: THE BEST-POSITIONED SECTORS TO WITHSTAND THE CURRENT CRISIS
Source: Bloomberg, Refinitiv and Banca March
Annualised growth last 10 years Performance during GFC and current estimates
350% 324,6% 10% 6,5%
4,1%
300% 0%
250% -3,6%
-10%
EPS growth (%)
-9,4%
EPS growth
200%
-20%
150%
104,7% -30%
100% 90,3%
-40% -36,2%
50% -39,4%
0% -50%
Recovery (2008-2009) Max loss (2008-2009) 2020 E
MSCI World AC Health Technology MSCI World AC Health Technology
In terms of regions, we prefer the US to Europe. We also continue to like Asia within the
emerging markets.
By regions, we are overweight the US versus Europe, as we are more optimistic on the US economy’s capacity for
recovery, largely due to its lower degree of export dependency. Mainly, however, because of the heavier relative
weighting of the sectors and companies where our outlook is most positive, such as Tech (which accounts 26%
of the S&P500) and Health (15%) which, along with other heavily-weighted new economy giants (for example,
Amazon, Facebook and Alphabet, in other sectors, account for a further 10%), will emerge stronger from this
crisis.
In addition, as we mentioned early on in this report, the proportion of government measures with an immediate
economic impact is greater in the US, and the Fed has broader capacity to expand its various programmes.
We continue to recommend positions in Asian emerging markets, which should be the first economies to start
withdrawing lockdown measures. The drop in global demand will continue to hamper international sales by
companies in these economies, but we believe that they are in a more advanced phase of the crisis and the
relatively better performance of recent weeks should continue.
The stronger performance of the Chinese stock market throughout this crisis, its lower volatility and the -4%
losses registered YTD are a reflection of its attractive valuations. Its lower degree of dependency on the service
sector, which has been hit hardest by this crisis and accounts for half of the Chinese economy versus two thirds
in developed markets, coupled with falling energy prices, will support a stronger recovery versus the developed
economies. Graph 25 shows the discounts on valuations in the Asian emerging markets versus the rest of the
world.
THE FIRST STEPS TOWARDS NORMALITY 20HOUSE VIEW. MAY 2020
25. PER 12 MSCI EMERGING ASIA VS MSCI WORD AC
30%
20%
10%
0%
-10%
-20%
-30% -25,78%
-40%
-50%
-60%
96 99 01 03 06 08 10 13 15 17 20
Other structural factors also come into play, such as the substantial weighting of emerging markets within the
global economy (approx. 60%) and their under-representation in the main global indices and a significantly above-
average earnings performance.
THE FIRST STEPS TOWARDS NORMALITY 21HOUSE VIEW. MAY 2020
CURRENCIES
Euro-dollar cross under pressure due to demand for liquidity. Our range is from 1.08 to 1.15
EUR/USD.
At times of crisis like the present, the dollar will continue to benefit from its status as a safe haven, and demand
will remain high. However, the Fed has already launched various programmes aimed at increasing the supply
of dollars in circulation and has even opened up direct liquidity facilities with other central banks. Against this
backdrop, a depreciation of the dollar in the short term looks unlikely, and the currency will continue to have
strong support until after the summer. We therefore maintain our outlook that euro-dollar cross levels of under
1.08 EUR/USD should be harnessed to pare back exposure. In the long term, we continue to believe that based
on economic fundamentals the euro-dollar cross should be around 1.15 EUR/USD, but until we see clear progress
in the EU towards a joint, coordinated response to this health crisis - and the serious increase in public debt - the
euro will remain under pressure versus the dollar.
The pound sterling is stabilising. Range 0.83 - 0.90 EUR/GBP.
The volatility of the pound has eased off thanks to a Covid-19 policy which is more in line with the rest of Europe.
This comes against the backdrop on the ongoing debate as to whether the Bank of England should step up its
existing 645 billion-pound asset purchase programme, as there is virtually no wiggle room in interest rates after
March’s rate cut to 0.1% and the economy is clearly shrinking (the BoE is forecasting a GDP contraction of 14%
for the year).
26. EUR/GBP VOLATILITY
Source: Bloomberg and Banca March
25
Brexit
20
Covid - 19
15
10
5
0
jan.-16 nov.-16 sep.-17 jul.-18 may.-19 mar.-20
The UK also has another important task to tackle: its negotiations with the European Union. The talks appear to
have taken a back seat, and if the UK does not request an extension, the transition period will end on 31 December
2020 and the UK will definitely leave the European Union. Despite the reticence expressed by the UK, the most
likely outcome is that it will end up requesting an extension. This situation could drive a temporary spike in
volatility in the pound. We expect the range for the weeks ahead to stand at 0.83-0.90 EUR/GBP.
Banca March Market Strategy Team:
Joan Bonet Majó
Pedro Sastre
Paulo Gonçalves, CAIA
Luis Coello
Adrián Santos
THE FIRST STEPS TOWARDS NORMALITY 22HOUSE VIEW. MAY 2020
EURIBOR EURIBOR 12 MONTHS (3 YEARS)
LAST 1 MONTH YTD 1 YEAR 0
1 MONTH -0,44 -0,42 -0,45 -0,37 -0,05
3 MONTHS -0,35 -0,36 -0,39 -0,31 -0,1
6 MONTHS -0,28 -0,29 -0,33 -0,23
-0,15
12 MONTHS -0,16 -0,17 -0,24 -0,11
-0,2
-0,25
CURRENCIES -0,3
-0,35
LAST 1 MONTH YTD 1 YEAR
-0,4
EUR/USD 1,0955 1,103 1,120 1,122
-0,45
EUR/GBP 0,870 0,888 0,854 0,860
may.-17 aug.-17 nov.-17 feb.-18 may.-18 aug.-18 nov.-18 feb.-19 may.-19 aug.-19 nov.-19 feb.-20
EUR/CHF 1,058 1,060 1,086 1,143
EUR/JPY 117,4 118,6 122,0 125,0
EUR/USD (3 YEARS)
GOVERNMENT BONDS
1,3
LAST 1 MONTH YTD 1 YEAR
2 YEARS 0,20 0,25 1,57 2,30 1,25
5 YEARS 0,36 0,38 1,67 2,30
USA 1,2
10 YEARS 0,64 0,67 1,88 2,50
30 YEARS 1,28 1,32 2,33 2,90 1,15
2 YEARS -0,76 -0,69 -0,60 -0,58
5 YEARS -0,76 -0,65 -0,47 -0,41 1,1
GERMANY
10 YEARS -0,59 -0,47 -0,19 0,01
1,05
30 YEARS -0,18 0,03 0,35 0,66
2 YEARS -0,22 -0,19 -0,39 -0,34 1
5 YEARS 0,04 0,15 -0,08 0,15 may.-17 aug.-17 nov.-17 feb.-18 may.-18 aug.-18 nov.-18 feb.-19 may.-19 aug.-19 nov.-19 feb.-20
SPAIN
10 YEARS 0,72 0,68 0,47 1,00
30 YEARS 1,46 1,51 1,32 2,16
2 YEARS 0,02 0,14 0,59 0,74
10 YEAR GOVERNMENT YIELDS (SPAIN VS GERMANY)
5 YEARS 0,09 0,21 0,65 0,88
UK
10 YEARS 0,23 0,36 0,87 1,15
2
30 YEARS 0,57 0,83 1,38 1,67
1,5
CORPORATE BONDS (1 YEAR SPREAD) 1
LAST 1 MONTH YTD 1 YEAR
0,5
AA 0,19 0,61 -0,27 -0,23
A 0,32 0,64 -0,26 -0,20 0
BBB 0,76 0,86 -0,16 -0,09
-0,5
-1
COMMODITIES may.-17 aug.-17 nov.-17 feb.-18 may.-18 aug.-18 nov.-18 feb.-19 may.-19 aug.-19 nov.-19 feb.-20
LAST 1 MONTH YTD 1 YEAR
BRENT 25,27 22,74 68,44 72,80
GOLD 1686,5 1577,2 1515,2 1283,5 IBEX (3 YEARS)
12000
EQUITY INDICES (3 YEARS)
LAST 1 MONTH YTD 1 YEAR 11000
MSCI WORLD* 489,17 10,58% -13,33% 7,47%
SP500 2912,43 12,68% -9,59% 22,16% 9000
EUROSTOXX50 2927,93 5,06% -21,89% -17,75%
TOPIXX 1464,03 4,35% -14,95% -4,42% 8000
IBEX35 6922,3 2,02% -27,99% -35,40%
FOOTSIE100 5901,21 4,04% -22,22% -18,08% 7000
MSCI BRAZIL 1233,94 5,28% -48,01% -32,45%
MSCI CHINA 81,36 6,33% -5,41% 19,30% 6000
MSCI EMERGING 924,94 9,00% -17,30% -5,42% may.-17 aug.-17 nov.-17 feb.-18 may.-18 aug.-18 nov.-18 feb.-19 may.-19 aug.-19 nov.-19 feb.-20
* All countries. Data: Bloomberg
THE FIRST STEPS TOWARDS NORMALITY 23HOUSE VIEW. MAY 2020
160%
EQUITY INDICES
PERFORMANCE
(3 YEARS) 140%
Data: Bloomberg
IBEX REL 120%
MSCI EMERGENTES REL
SP500 REL
100%
80%
60%
40%
jun.-17 sep.-17 dec.-17 mar.-18 jun.-18 sep.-18 dec.-18 mar.-19 jun.-19 sep.-19 dec.-19 mar.-20
IBEX rel MSCI Emergentes rel SP500 rel fijo
*DATA AS OF 30 DE APRIL 2020
RETURN DURATION PORTFOLIO DISTRIBUTION
MONTH YTD 1 YEAR CURRENT 1 MONTH AGO FI EQUITY ALT. INV.
MARCH RENDIMIENTO F.I. -0,01% -0,17% -0,45% 0,000 0,258 57,80% 0,00% 0,00%
MARCH RENTA FIJA CORTO PLAZO F.I. 0,54% -1,87% -1,80% 0,000 0,454 81,75% 0,00% 0,00%
MARCH PATRIMONIO C.P. F.I. 0,57% -1,51% -1,51% 0,000 0,696 81,57% 0,00% 0,00%
FONMARCH F.I. 0,84% -3,19% -2,78% 0,000 1,974 92,25% 0,00% 0,00%
MARCH EUROPA F.I. 10,13% -21,01% -29,55% 0,000 0,003 0,00% 100,51% 0,00%
MARCH INTL - VALORES IBERIAN EQUITY 6,22% -23,32% -21,94% 0,003 0,003 0,00% 95,11% 0,00%
MARCH GLOBAL F.I. 8,39% -24,16% -18,47% 0,000 0,003 0,00% 90,70% 0,00%
MARCH INTL - MARCH VINICATENA 8,39% -19,59% -20,04% 0,003 0,003 0,00% 96,39% 0,00%
MARCH INTL - THE FAMILY BUSINESSES FUND 6,23% -17,91% -12,42% 0,003 0,003 0,00% 92,66% 0,00%
MARCH INTL - MEDITERRANEAN FUND 7,99% -19,68% 0,00% 79,32% 0,00%
MARCH NEW EMERGING WORLD F.I.* 9,20% -19,83% -19,52% 0,000 0,003 0,00% 91,23% 0,00%
TORRENOVA DE INVERS. S.I.C.A.V. S.A. 2,17% -5,71% -4,74% 0,847 0,884 67,95% 19,52% 0,00%
CARTERA BELLVER S.I.C.A.V., S.A. 5,08% -11,61% -10,26% 0,742 0,837 38,65% 51,20% 0,00%
LLUC VALORES S.I.C.A.V., S.A. 8,41% -16,28% -13,45% 0,003 0,003 0,00% 85,57% 0,00%
MARCH INTL - TORRENOVA LUX 2,09% -5,86% -5,43% 0,003 0,003 72,04% 19,71% 0,00%
MARCH INTL BELLVER LUX 4,01% -5,51% -7,16% 26,64% 47,37% 0,00%
MARCH INTL LLUX LUX 7,31% -16,41% -17,30% 11,25% 82,60% 0,00%
MARCH PATRIMONIO DEFENSIVO F.I.* 1,54% -3,34% -3,29% 0,000 0,003 57,63% 3,17% 31,50%
MARCH CARTERA CONSERVADORA F.I.* 3,21% -4,91% -3,84% 0,000 0,003 42,60% 19,67% 30,24%
MARCH CARTERA MODERADA F.I.* 5,54% -6,30% -4,09% 0,000 0,003 23,41% 44,30% 24,92%
MARCH CARTERA DECIDIDA F.I.* 8,20% -11,26% -8,62% 0,000 0,003 0,95% 71,52% 19,36%
PLAN PENSIÓN CRECIENTE, F.P. 0,82% -2,67% -2,56% 0,000 1,303 90,77% 0,00% 0,00%
MARCH PENSIONES 80/20, F.P. 2,21% -8,22% -5,84% 0,000 2,026 71,93% 21,33% 0,00%
MARCH PENSIONES 50/50, F.P. 4,02% -11,47% -7,43% 0,000 1,947 49,23% 44,03% 0,00%
MARCH ACCIONES, F.P. 7,72% -18,98% -11,78% 0,000 0,003 0,00% 86,96% 0,00%
MARCH AHORRO, F.P. 3,16% -9,80% -6,48% 0,000 1,967 63,23% 29,90% 0,00%
PLAN ÓPTIMO, F.P. 2,88% -9,38% -6,11% 0,000 1,962 60,17% 26,82% 0,00%
MARCH MODERADO EPSV 1,89% -6,99% -5,27% 0,000 1,582 66,97% 19,12% 0,00%
MARCH ACCIONES EPSV 7,79% -16,25% -8,90% 0,000 0,003 0,00% 86,27% 0,00%
THE FIRST STEPS TOWARDS NORMALITY 24HOUSE VIEW. MAY 2020 IMPORTANT REMARK: The contents of this document are merely illustrative and do not pretend, are not and cannot be considered under any circumstances as an investment recommendation towards the contracting of financial products. This document has only been prepared to help the customer make an independent and individual decision but does not intend to replace any type of advice needed for the contracting of such products. The terms and conditions described in this document are to be viewed as preliminary terms only, subject to discussion and negotiation as well as to the agreement and final drafting of the terms affecting the transaction, which will appear in the contract or certificate to be issued. Consequently, Banca March, S.A.. and its customers are not bound by this document unless both parties decide to embark on a specific transaction and agree on the terms and conditions concerning the final documents to be approved. Banca March, S.A.. does not offer any guarantee, expressly or implicitly, in relation with the information shown in this document. All terms, conditions and prices contained in this document are merely informative and subject to modifications depending on the market circumstances, changes in laws, jurisprudence, administrative procedures or any other issue which may affect them. The customer should be aware that the products mentioned in this document may not be appropriate for his/her specific investment targets, financial situation or risk profile. For this reason the customer must make his/her own decisions by taking into account such circumstances and by obtaining specialised advice in tax, legal, financial, regulatory, accounting issues or any other type of information required. Banca March, S.A.. does not assume any responsibility for any direct or indirect costs or loss which may result from the use of this document or its contents. No part of this document can be copied, photocopied or duplicated in any way or through any means, redistributed or quoted without a previous written authorisation by Banca March, S.A. THE FIRST STEPS TOWARDS NORMALITY 25
You can also read