Impact of COVID-19 on health-related behaviours, well-being and weight management
←
→
Page content transcription
If your browser does not render page correctly, please read the page content below
Avery et al. BMC Public Health    (2021) 21:1152
https://doi.org/10.1186/s12889-021-11143-7

 RESEARCH                                                                                                                                          Open Access

Impact of COVID-19 on health-related
behaviours, well-being and weight
management
Amanda Avery1,2*, Josef Toon2, Jennifer Kent2, Laura Holloway2, Jacquie Lavin2 and Sarah-Elizabeth Bennett2

  Abstract
  Background: Weight management is complex for people even in times of stability. Supporting individuals to
  develop strategies to maintain a healthier weight when there are additional life challenges may prevent relapse.
  This mixed-methods study describes the impact the COVID-19 restrictions had on adults engaged in weight
  management before and during the pandemic in order to determine helpful strategies.
  Methods: Longitudinal data was captured from online surveys completed by Slimming World (SW) members 0–4
  weeks after joining, October/November 2019, providing pre-joining and baseline (T0&T1), 3- (T2) and 6- month (T3-
  during COVID-19) data. Representatives from the general population, not attending a weight management service,
  completed the same questionnaires providing cross-sectional control data. All weights are self-reported. For this
  study, questions assessing the impact of the COVID-19 challenges on health-related behaviours and well-being are
  included comparing responses at T0/T1, T2 & T3. Longitudinal data were analysed using repeated measures ANOVA
  and cross-sectional data, one-way independent ANOVAs to compare means. Comparisons between SW members
  and controls were determined using z-proportion tests.
  Qualitative data generated was thematically analysed using a six-step approach to produce the key emerging
  themes.
  Results: 222 SW members completed all three surveys, achieving a weight loss of 7.7 ± 7.5%. They maintained
  positive health-related behaviour changes made since joining, including increased fruit and vegetables (p < 0.001),
  fewer sugary drinks (p < 0.001), cooking from scratch (p < 0.001) and increased activity levels (p < 0.001). Despite
  COVID-19 restrictions, they were still reporting improvements in all behaviours and had healthier scores than the
  controls on all but alcohol intake, although still within guidelines. Qualitative data indicated that the situation
  created various challenges to managing weight with fresh foods harder to access, comfort eating, drinking more
  alcohol, eating more sugary foods and snacking through boredom. However, some reported having more free time
  enabling better planning, more time to cook from scratch and increased physical activity.
  Conclusions: The findings highlight the value of peer, group and online support and guidance for individuals to
  develop sustainable behaviour changes and a level of resilience. These strategies can then be drawn upon enabling
  maintenance of lifestyle changes and management of weight even in challenging times.

* Correspondence: amanda.avery@nottingham.ac.uk
1
 The University of Nottingham, School of Biosciences, Sutton Bonington
campus, Loughborough LE12 5RD, UK
2
 Slimming World, Alfreton, Derbyshire, England DE55 4SW

                                       © The Author(s). 2021 Open Access This article is licensed under a Creative Commons Attribution 4.0 International License,
                                       which permits use, sharing, adaptation, distribution and reproduction in any medium or format, as long as you give
                                       appropriate credit to the original author(s) and the source, provide a link to the Creative Commons licence, and indicate if
                                       changes were made. The images or other third party material in this article are included in the article's Creative Commons
                                       licence, unless indicated otherwise in a credit line to the material. If material is not included in the article's Creative Commons
                                       licence and your intended use is not permitted by statutory regulation or exceeds the permitted use, you will need to obtain
                                       permission directly from the copyright holder. To view a copy of this licence, visit http://creativecommons.org/licenses/by/4.0/.
                                       The Creative Commons Public Domain Dedication waiver (http://creativecommons.org/publicdomain/zero/1.0/) applies to the
                                       data made available in this article, unless otherwise stated in a credit line to the data.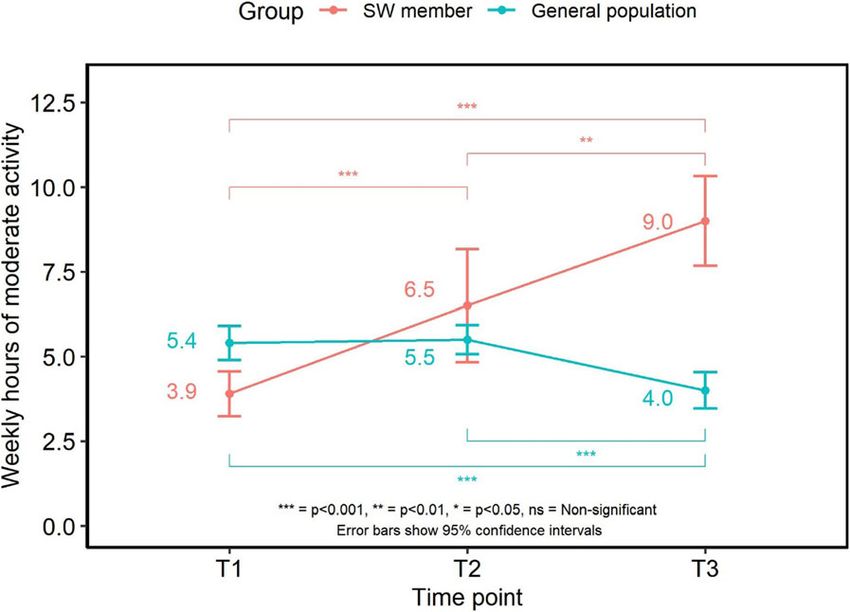
Avery et al. BMC Public Health   (2021) 21:1152                                                            Page 2 of 14

Introduction                                                 regular time points over a 12-month period. Data is ob-
The COVID-19 pandemic is a global health and human           tained about various aspects of health-related behaviours
crisis threatening the food security and nutrition of        and well-being including dietary habits, eating behav-
many people. It has become increasingly acknowledged         iours, physical activity levels, alcohol intake and mood.
that obesity increases the severity of symptoms and im-      A comparator survey of a representative general popula-
pairs treatment outcomes in those affected by COVID-         tion sample is captured at each time point. The six-
19 [1]. Before the COVID-19 pandemic, different levels       month time point coincided with first ‘lockdown’ result-
of malnutrition were already prevalent with many people      ing from the COVID-19 pandemic. Hence the study
consuming an energy dense, nutrient poor diet [2]. The       team added additional questions with the aim to capture
majority of the UK population were not participating in      how the lockdown restrictions might have impacted on
recommended levels of daily activity for physical and        the various aspects of health-related behaviours and
mental health benefit and to support maintenance of a        well-being being monitored through the study. The hy-
healthy weight [3]. Weight control is complex, influ-        pothesis was that the lockdown restrictions negatively
enced by an interaction of various factors including bio-    impacted on health behaviours related to weight man-
logical, behavioural, environmental, societal and cultural   agement and also to people’s sense of well-being, but
[1]. People are faced with many challenges towards suc-      with weight management support reducing the level of
cessful, sustainable weight control and relapse is com-      negative impact. This paper reports the six-month find-
mon even when their lives are relatively stable and there    ings with emphasis on the impact of the COVID-19 pan-
is some degree of certainty. People benefit from support     demic on weight management at this six-month follow
to develop personal and practical strategies which can       up timepoint using the quantitative and qualitative data.
become part of their routine and help them to lose
weight and maintain their weight in the long term [4, 5].
Many people value support to feel empowered to de-           Methods
velop these strategies to draw upon at times of chal-        New adult members, defined as those adults (≥18 years)
lenge. The COVID-19 pandemic added to difficulties in        joining Slimming World (SW) between 03/10/2019 and
the ability to maintain many health-related behaviours       07/11/2019 were invited to take part in an online survey
with the need for some people to shield, limitations to      within the first 4 weeks of their membership. An invita-
opportunities to be physically active alongside reports of   tion was directly emailed to members accessing either
changes in shopping and cooking habits, access to foods,     the group support or online programme. Participants
changes to dietary intake such as decreased consumption      were told that the survey would ask questions about
of fresh fruit and vegetables, comfort eating, increased     their health, well-being, physical activity and diet. The
alcohol purchasing and increased snacking on cakes, bis-     invitation was for members to take part in the baseline
cuits, confectionary and savoury snacks for example [1,      survey which would capture retrospective data from be-
6]. Many of which may add to the complexities of main-       fore they became a member and within the first 4 weeks
taining a healthier weight during the UK first lockdown      after joining. Follow up surveys were sent to capture
period.                                                      data 3 and 6 months later, with a 12-month follow up
   Slimming World is a UK based weight management            also planned. Those taking part in the survey were of-
organisation, which uses a multi-component approach          fered the opportunity to be entered into a prize draw
focussing on psychological as well as physiological as-      after the completion of each survey to win a high street
pects of weight control to encourage the formation of        shopping voucher. The survey questions were managed
new healthy eating habits and increases in physical activ-   via the survey-platform Qualtrics (Qualtrics, Provo, UT,
ity levels. The underpinning psychological approach is       USA). Qualtrics was also used to recruit representative
built on a number of behaviour change techniques in-         samples from the general population, based on the typ-
cluding self-determination theory and the commitment         ical age, gender and BMI of the Slimming World mem-
model, but essentially offers positive support and           bership, to provide a comparator group at each time
reinforcement, with no criticism or judgement. It also       point. The comparator groups were not currently man-
focuses on supporting members to become less self-           aging their weight with a commercial organisation.
critical and more self-compassionate, helping them to
cope with set-backs throughout their weight loss journey
and arming them with the skills needed for successful        Ethics
long term weight control. Slimming World’s Health and        The study was performed in accordance with the Declar-
Well-being study is an ongoing piece of work surveying       ation of Helsinki and approved by the University of Not-
new adult members, who joined the weight management          tingham, School of Biosciences Ethics Committee No:
programme between October and November 2019, at              SB1819/36.
Avery et al. BMC Public Health   (2021) 21:1152                                                                Page 3 of 14

Questionnaire                                                  had changed due to the situation, and if so, the direction
The wider survey consisted of 70 core questions cover-         of this behaviour change. The sections with an add-
ing demographic information and self-reported height           itional COVID-19 question included those related to diet
and weights, detailed questions about dietary habits, al-      and eating habits, alcohol intake, physical activity and
cohol intake and eating behaviours, physical activity and      mood and well-being. Participants were also asked to
general health and well-being for each time point (Add-        rate on a scale of 1–5, with 1 being ‘Very difficult’ and 5
itional files 1 & 2). For the purposes of this paper, ques-    being ‘Very easy’, how they had found managing their
tions relevant to the impact of the COVID-19 situation         weight during the COVID-19 situation. An additional,
on health-related behaviours and well-being were in-           final open-ended question, ‘Please could you explain
cluded, such as fruit and vegetable consumption ‘How           why you have found managing your weight easy or diffi-
many portions did you eat yesterday?’ (with numerical          cult during the COVID-19 situation’ provided more in-
response capped at 13+ for analysis purposes); the fre-        depth, qualitative findings.
quency of fatty and sugary food intake and the frequency          This survey was completed between April 9th – May
of cooking from scratch ‘In a typical month how often          16th 2020 and the results from this survey are reported
do you do the following?’ (asked on a 5-point scale ran-       in this paper.
ging from ‘Once a month or more’ to ‘Once a day or
more’); the frequency of wholegrain and sugary drink in-       Participants
take ‘In a typical week how often do you do the follow-        The study team aimed to recruit around 2000 SW mem-
ing’ (asked on a 5-point scale ranging from ‘More than         bers at baseline to ensure a suitable sample size was
once a day’ to ‘Never/occasionally’); alcohol intake ‘How      available for later analysis. In total, 1884 SW members
many alcoholic drinks do you generally consume each            completed the first survey of which 222 SW members
week?’ (split by type and volume of drink to allow units       completed all subsequent surveys. A sensitivity analysis
of alcohol to be derived for analysis purposes); total         of this sample showed variance tests would be sensitive
hours of moderate-intensity physical activity were calcu-      enough to detect small differences in measures (sensitive
lated using the Sport England Active Lives question-           up to ηp2 = .016) at 95% power with an alpha of 0.05.
naire, (https://www.sportengland.org/know-your-                   Samples from the general population were collected in
audience/data/active-lives?section=method_behind_              parallel with a similar aim to recruit 2000 participants at
active_lives).                                                 survey 1 and 2. This was reduced slightly at survey 3 to
   A well-being score was created by adapting items from       reduce the sample size differences between SW mem-
the SF-36 to assess how often participants felt calm and       bers with data from 637 members of the general popula-
peaceful, (item 1), had a lot of energy (item 2), felt         tion collected at the third survey. As the T3 sample were
downhearted and low (item 3) and had been a happy              going to be compared to SW members, a sensitivity ana-
person (item 4), with three additional questions asses-        lysis to understand what differences were going to be re-
sing how often; participants had been in a sociable mood       liably detected between the 2 samples was performed
(item 5), felt stressed (item 6) and felt anxious (item 7).    showing that at 95% power and an alpha of 0.05 small
All items were scored from 6 (“All of the time”) to 1          effect sizes would be detected reliably (sensitive to d =
(“None of the time”). A score from the scale was calcu-        0.28).
lated by summing scores from all items after reversing
questions on negative affect (items 3, 6 and 7) to create      Data time points captured in this research paper
a total well-being score (min = 7, max = 42) where a           For clarity, retrospective data will be referred to as T0
higher score indicated a more positive well-being.             (data only collected for SW members to determine their
   The scale assessing well-being was tested for reliability   health-related behaviours before they joined SW, col-
in multiple ways. Average item-total correlation was           lected at the same time as T1 data), data collected within
high (r = 0.77) and split-half reliability showed a high in-   the first 4 weeks of membership as T1, 3-month data as
ternal consistency estimate (r = 0.84). Cronbach’s alpha       T2 and 6-month data as T3.
analysis also showed the well-being scale had high in-
ternal consistency (α = 0.88) with no items identified as      Statistical analysis
improving the scale if removed with high inter-item cor-       All data were collated and analysed within R statistical
relation (r = 0.52).                                           programming software (version 3.6.3). For the Likert
   Given that the 6-month time point coincided with            data, data was checked for normality. For all data re-
lockdown, additional questions were added to determine         ported, where there was no significant divergence from
the impact of the COVID-19 situation on health-related         normality, parametric analyses were undertaken. Longi-
behaviours and the ability to manage weight. Partici-          tudinal data from SW were analysed using repeated
pants were asked whether certain lifestyle behaviours          measures ANOVA (or Friedman tests where data
Avery et al. BMC Public Health    (2021) 21:1152                                                                        Page 4 of 14

followed a non-normal distribution) followed by post-                Weight data
hoc comparisons to test differences between time points              Between the baseline and 6-month surveys (T1-T3), the
within groups with adjustments to p-values for multiple              222 SW members achieved a mean weight loss of 7.7 ±
comparisons performed using Bonferonni correction.                   7.5% and a change in mean BMI of −3.0 ± 2.99 kg/m2.
For the cross-sectional data collected from the general              Weight changed significantly over time (F (1.25,
population samples, one-way independent ANOVAs (or                   276.78) = 161.209, p < 0.001), with post-hoc tests show-
Kruskal-Wallis tests where data followed a non-normal                ing significant decreases by 3 months (94.2 ± 20.2 kg vs
distribution) were used to compare means for the sam-                88.9 ± 18.9 kg; T1 vs T2, p < 0.001) and between 3 and 6
ple cohorts followed with post-hoc tests. Data within                month follow up points (88.9 ± 18.9 kg vs 87.0 ± 18.8 kg;
text are presented as mean ± standard deviation and                  T2 vs T3, p < 0.001). Weight did not differ significantly
error-bars within figures represent upper and lower 95%              between each of the general population samples (Fig. 1).
confidence intervals. Proportion data between SW mem-
bers and the general population were compared using z-               Health-related behaviour changes reflecting potential
proportion tests.                                                    impact of COVID-19
  Significance levels are indicated as * p < 0.05, **p <
0.01, ***p < 0.001.                                                  Dietary changes (Fig. 2)

                                                                     Fruit intake Across the study time points, there was an
Qualitative data analysis                                            overall significant change in fruit intake (F (2.87,
The responses, provided by both the SW members and                   577.23) = 64.15, p < 0.001), with post-hoc comparisons
the control group, to the question ‘please, could you ex-            showing that SW members significantly increased fruit in-
plain why you have found managing your weight easy or                take after joining (1.9 ± 1.34 vs 3.2 ± 1.40 portions; T0 vs
difficult during the COVID-19 lockdown period’ were                  T1; p < 0.001) and levels remained higher at T2 (3.1 ± 1.34
thematically analysed. The six-step framework [7] (1. Be-            portions, p < 0.001) and T3 (3.0 ± 1.56 portions, p < 0.001).
coming familiar with the data, 2. Generating initial                   For the general population, there was no significant
codes, 3. Searching for the themes, 4. Reviewing themes              difference in average daily fruit portions consumed be-
5. Defining themes and 6. Writing-up) was followed in                tween samples at each time point (F (2,3545) = 1.863,
this study. Key and supporting sub themes were identi-               p > 0.05), with SW members eating significantly more
fied independently by four different members of the re-              portions of fruit at each time point (p < 0.05).
search team with agreement on the final listing.                       Data from the COVID-19 specific question showed
                                                                     that the majority of SW members and the general popu-
                                                                     lation reported their fruit intake had not changed due to
Results                                                              the COVID-19 situation (61.3 and 60.3% respectively).
The T1 characteristics of the 222 SW members who                     For those who reported a change, 25.1% of members
completed all surveys are compared to all 1884 members               and 24.3% of the general population reported a decrease,
who completed the survey at T1 and apart from age                    whilst 13.6% members and 15.4% general population re-
there were no differences (Table 1). They are also com-              ported an increase in fruit intake.
pared to the general population sample at T3 (n = 637)                 Vegetable intake There was an overall significant time
where differences in age, weight and BMI were observed               effect on vegetable intake for SW members (F (2.78,
(Table 1).                                                           558.91) = 34.467, p < 0.05). Post-hoc tests showed that

Table 1 Characteristics of the 222 SW members who completed the survey at T1 and T3 compared to all the SW members who
completed the survey at T1 and the general population sample who completed the survey at T3 (all respondents v. study population)
                             Data from T1                                      Data from T3
                             T1 SW members (n =    T1 SW members       P      T3 SW             T3 General population   P value
                             1884)                 (n = 222)           value^ member T3         sample                  T3 SW vs T3
                                                                              (n = 222)         (n = 637)               GP
Gender (%female/ %male)      93.9%/6.12%           93.7%/6.19%         ns      93.7%/6.19%      92.1%/7.86%             ns
Age (years)                  47.7 ± 13.34          51.8 ± 13.6         ***     52.6 ± 13.65     47.4 ± 11.91            *
Weight (kg)                  92.7 ± 19.68          94.2 ± 20.17        ns      87.0 ± 18.35     80.7 ± 19.87            *
BMI (kg/m2)                  33.8 ± 6.65           34.7 ± 7.09         ns      31.7 ± 6.53      29.8 ± 6.48             **
Median Annual household      £30,000–£39,000       £30,000–£39,000     ns      £30,000–£39,     £30,000–£39,000         ns
income                                                                         000
Avery et al. BMC Public Health (2021) 21:1152 Page 5 of 14
Wholegrains intake The frequency of SW members’
wholegrain consumption changed significantly over time
(F (2.74,550.71) = 6.357, p < 0.001). Average frequency of
intake increased after joining (2.4 ± 1.26 vs 2.6 ± 1.14; T0
vs T1, p < 0.01) and remained higher at the 3 (2.7 ± 1.18;
T2) and 6 month points (2.6 ± 1.14; T3).
There was no overall difference in wholegrain intake
for the general population across time points (F (2,
3545) = 1.112, p > 0.05). The general population sample
were eating wholegrains less often than SW members at
T1 (p < 0.001) and 3 months (p < 0.001) but there was no
difference at the 6-month follow up point.
The majority of both SW members (83.1%) and the
general population (82.4%) reported no change in the
Fig. 1 Mean and 95% confidence intervals for weight (kg) over time frequency of wholegrain consumption due to the
COVID-19 situation. 10.0% of members reported a de-
crease and 7% reported an increase in how often they
vegetable intake increased significantly after joining consumed them, which was similar to the general popu-
(2.5 ± 1.31 vs 3.5 ± 1.37 portions; T0 vs T1, p < 0.001) lation, with 7.4% reporting a decrease and 10.2% report-
and remaining higher at 3 (3.4 ± 1.38 portions, p < 0.001) ing an increase.
and 6 months (3.2 ± 1.40 portions, p < 0.001). Fatty food intake The frequency of fatty food intake
There was no difference in vegetable intake between by SW members differed over time (F (2.78,581) =
samples of the general population at each time point (F 238.05, p < 0.001) with post-hoc tests showing that fre-
(2,3545) = 0.727, p > 0.05). Vegetable intake was signifi- quency of fatty food intake dropped significantly after
cantly greater for SW members compared to the general joining (3.5 ± 1.18 vs 1.5 ± 0.83; T0 vs T1, p < 0.001). In-
population samples at each time point (p < 0.05). take then increased slightly at T2 (1.5 ± 0.83 vs 1.7 ±
Most SW members (71.1%) and the general population 0.07;T1 vs T2, p < 0.05) and again by T3 (2.0 ± 1.13; p <
(64.8%) reported no change in vegetable consumption 0.001). Intake remained lower at the 6-month point (T3)
due to the COVID-19 situation. Where there was a compared to levels prior to joining (T0, p < 0.001).
change, 18.9% of members reported eating fewer vegeta- Frequency of fatty food intake for the general popula-
bles and 10% reported eating more. For the general tion samples varied over time (F (2,3545) = 7.188, p <
population 16.6% reported a decrease and 18.5% re- 0.001) and was significantly lower at T2 compared to T1
ported an increase in vegetable intake. (3.0 ± 1.11 vs 2.9 ± 1.09; T1 vs T2, p < 0.001) which then
Sugary drinks intake Frequency of sugary drink con- increased at T3 (3.0 ± 1.12; p < 0.05) meaning it was no
sumption by the SW members changed significantly over different from that of the sample at T1 or the SW mem-
time points (F (1.95,386.48) = 15.79, p < 0.001). Post-hoc bers at T0 (before joining SW). The frequency of fatty
tests showed that members significantly decreased their food intake for the general population samples remained
consumption of sugary drinks after joining (1.5 ± 1.01 vs higher than the SW members at T1, T2 and T3 (p <
1.2 ± 0.52; T0 vs T1, p < 0.01). This intake remained stable, 0.001).
with no significant changes at further time points. Around two thirds of SW members (61.0%) and the
For the general population samples, intake varied over general population (65%) reported no change in how
time (F (2:3545) = 3.338, p < 0.05) and was lower at T2 often they were eating fatty foods due to the COVID-19
than T1 (1.7 ± 1.16 vs 1.8 ± 1.21; p < 0.01) and increased situation. For members, 12% reported a decrease and
between T2 and T3 (1.8 ± 1.21, p < 0.05). SW members 27% reported an increase in how often they were eating
were having sugary drinks significantly less often than fatty foods. For the general population, 17.3% reported a
the general population at each time point (p < 0.05). decrease and 17.7% reported an increase. Whilst a
The majority of both SW members (89.9%) and the greater percentage of members reported an increase in
general population (74.1%) reported no change in their how often they were eating fatty foods at this time, the
intake of sugary drinks due to the COVID-19 situation. quantitative data (Fig. 2) shows that members were still
The general population were more likely to have re- eating fatty foods less often than the general population
ported a change, with a greater proportion reporting at each time point (p < 0.001).
both an increase in intake (12.7% vs 5.5%, general popu- Sugary food intake There was an overall significant
lation vs members, p < 0.01) and a decrease (13.2% vs difference in how often SW members were consuming
4.5%, general population vs members, p < 0.001). sugary food intake across time points (F (3,627) =Avery et al. BMC Public Health (2021) 21:1152 Page 6 of 14 Fig. 2 Mean changes and 95% confidence intervals for dietary behaviours reported over the 6-month period
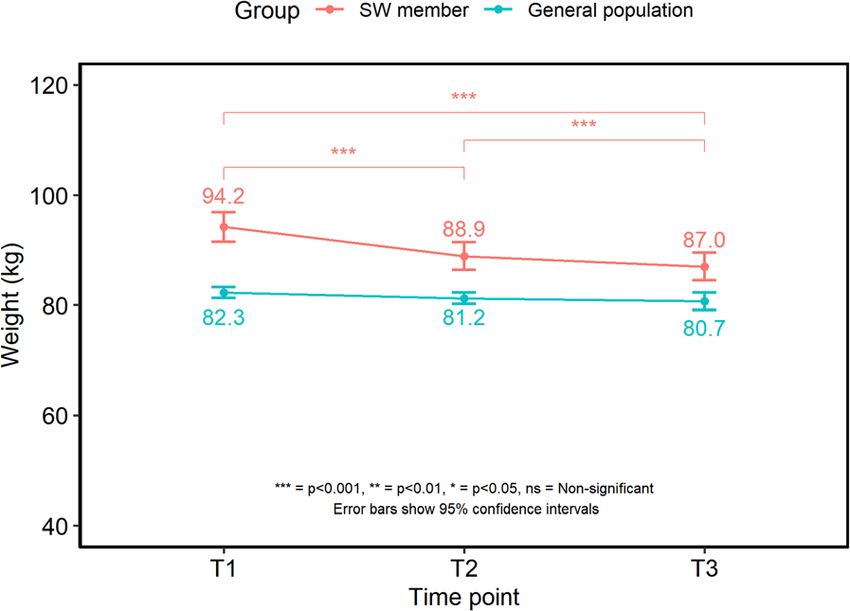
Avery et al. BMC Public Health   (2021) 21:1152                                                                 Page 7 of 14

186.775, p < 0.001). Post-hoc tests showed, after joining,     data shows that SW members were cooking from
members started eating sugary foods less often (4.0 ±          scratch significantly more often at each time point (p <
1.16 vs 1.8 ± 1.13; T0 vs T1, p < 0.001). The frequency of     0.05).
sugary food intake increased at 3 months (2.6 ± 1.29; T2,         Alcohol intake SW members’ alcohol consumption
p < 0.001) and again at 6 months (2.9 ± 1.36; T3, p <          varied over time (X2 (3)=39.2, p < 0.001) with post-hoc
0.001) although they were still being eaten less often         tests showing that members reduced their average
than they were prior to joining.                               weekly unit consumption soon after joining (15.7 ± 10.20
   Frequency of intake of sugary foods differed over time      vs 12.0 ± 10.50 units/wk.; T0 vs T1, p < 0.001) and this
for the general population samples (F (2,3545) = 6.146,        decreased further at the 3-month point (8.9 ± 8.56 vs
p < 0.001). Data from the T1 (3.4 ± 1.22) and T2 (3.4 ±        12.0 ± 10.50 units/wk.; T2 vs T1, p < 0.001). There was
1.23) showed no significant difference in how often the        an increase in alcohol intake from 3 to 6 months, al-
general population were consuming sugary foods. The            though average weekly units were still significantly lower
intake increased significantly at T3 (3.6 ± 1.20) compared     than before joining (12.7 ± 9.86 vs 15.7 ± 10.20 units/wk.;
to T1 (p < 0.01) and T2 (p < 0.001) and remained signifi-      T3 vs T0, p < 0.001).
cantly greater than the intake of SW members at all time          For the general population samples, alcohol intake dif-
points (p < 0.05).                                             fered over time (x2 (2)=11.7, p < 0.001). There was no
   Around half (49.5%) of SW members and the general           significant difference in mean intake of alcohol units per
population (52%) said the COVID-19 situation had not           week between the samples at the first and second sur-
affected how often they were eating sugary foods. A pro-       veys (16.2 ± 26.2 vs 14.3 ± 19.6 units/wk.; T1 vs T2, adjp =
portion of both groups, 41.5% for members and 34.2% of          0.104). However, the general population sample at 6-
the general population, reported an increase in fre-           months had lower alcohol consumption on average com-
quency of eating sugary foods, while only 9% of mem-           pared to the sample at T1 (14.2 ± 19.90 vs 16.2 ± 26.2;
bers and 13.8% of the general population reported a            T3 vs T1, p < 0.01). The general population consumed
decrease. While 41.5% of members reported they were            more units of alcohol per week than SW members at T1
eating sugary foods more often due to the COVID-19             and T2 (p < 0.05).
situation, they were still eating sugary foods significantly      The majority of SW members (66.7%) and the general
less often than the general population at all time points      population (72.4%) reported that the COVID-19 situ-
(p < 0.05).                                                    ation had not affected their alcohol intake. However,
   Cooking from scratch There was a difference in how          27.7% of members and 16.3% of the general population
often members cooked from scratch over the time points         reported an increase, whilst 5.6% of members and 11.3%
(F (2.32,485.08) = 60.166, p < 0.001) with significant in-     of the general population reported a decrease in alcohol
creases occurring between T0 and T1 (4.0 ± 1.08 vs             intake. Despite a greater proportion of members report-
4.7 ± 0.63;T0 vs T1, p < 0.001). Data remained stable and      ing that their intake of alcohol had increased due to the
did not differ significantly at subsequent time points and     COVID-19 situation, the results above show members
members remained cooking from scratch significantly            had already significantly reduced their alcohol intake
more often than at T0.                                         after joining, and at this time were still drinking less
   There was some variation in how often the general           than they were before they joined, and were below the
population were cooking from scratch over time (F (2,          recommended guidelines of a maximum of 14 units per
3545) = 3.236, p < 0.05). The sample at the 6-month sur-       week.
vey were cooking from scratch significantly more often
than those sampled at T1 (3.9 ± 1.13 vs 4 ± 1.14, T1 vs
T3, p > 0.05) but there were no differences at other time      Physical activity levels (Fig. 3)
points.                                                        Hours of moderate intensity physical activity per week
   Around half of SW members (58%) and the general             changed over time (F (1.63,213.17) = 12.925, p < 0.001),
population (49.6%) reported the COVID-19 situation             with SW members increasing their activity levels within
had not affected how often they cooked from scratch.           the first 3 months (3.9 ± 4.74 vs 6.5 ± 11.7 h/wk.; T1 vs
However, in those who reported a change, the majority          T2, p < 0.001) and again from 3 months to 6 months
said they were cooking from scratch more often (32.5%          (6.5 ± 11.7vs 9.0 ± 8.56 h/wk.; T2 vs T3, p < 0.001).
of members and 46.5% of the general population). A               There was variation in hours of weekly moderate in-
much smaller proportion of members (9.5%) and the              tensity activity over time for the general population (F
general population (3.9%) reported cooking from scratch        (2,3089) = 6.951, p < 0.001). Average weekly activity
less often. Even though a greater proportion of the gen-       levels did not differ significantly between the first two
eral population reported an increase in cooking from           survey samples (5.4 ± 10.1 vs 5.5 ± 6.95 h/wk.; T1 vs T2),
scratch due to the COVID-19 situation, the longitudinal        but levels were significantly lower at 6 months (4.0 ±
Avery et al. BMC Public Health (2021) 21:1152 Page 8 of 14
compared to 42.4% of the general population but this
was not significantly different (p > 0.1).
Qualitative responses about the impact of COVID-19 on
weight management
In terms of how easy or difficult people found managing
their weight during the COVID-19 situation, responses
from SW members and general population were similar.
In total, 59.3% of members and 64.5% of the general
population reported finding managing their weight ‘diffi-
cult’ during lockdown.
When asked to explain why they had found managing
their weight easy or difficult during this time, there was
a wide range of responses from both members and the
Fig. 3 Weekly hours of moderate intensity activity for SW members general population with some saying they had found it
and general population sample easy to others reporting various difficulties. After gener-
ating the initial codes, five broad themes were identified
6.35; T3) compared to the samples at T1 and T2 (p < following the search, review and defining procedures
0.001). (Table 2) with changes to routine an underlying theme
When asked whether the COVID-19 situation had af- to all five themes. Some respondents found it was easy
fected activity levels, there was a spread across the re- to maintain a healthy lifestyle whilst others reported dif-
sponses. The majority of the general population (42.5%) ficulties in maintaining a healthy diet due to access to
and 38.7% of SW members reported no change in their certain foods, temptation to snack more because of
activity levels whilst 40.5% of the general population and boredom, comfort eating and drinking more alcohol.
36.2% of members reported a decrease in activity. A Similarly, there was a mix of responses around physical
greater proportion of SW members reported their activ- activity with some reporting they were now exercising
ity levels had increased compared with the general popu- and moving around more while others reported being
lation (25.2% vs 17.0%; members vs general population, less active. Stress and anxiety were reported to negatively
p < 0.05). affect eating behaviours too.
Overall, there were more barriers than enablers to
maintaining healthier lifestyle changes because of the
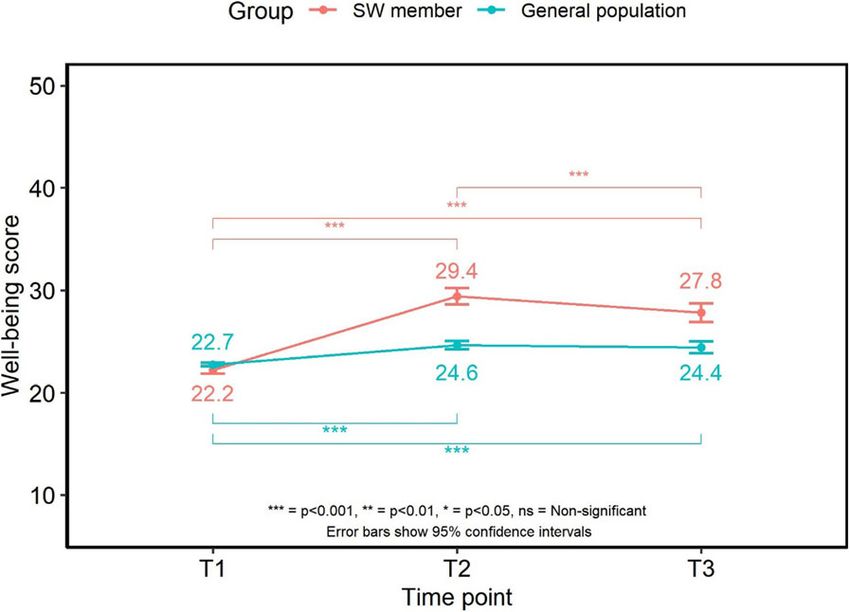
Well-being COVID related situation.
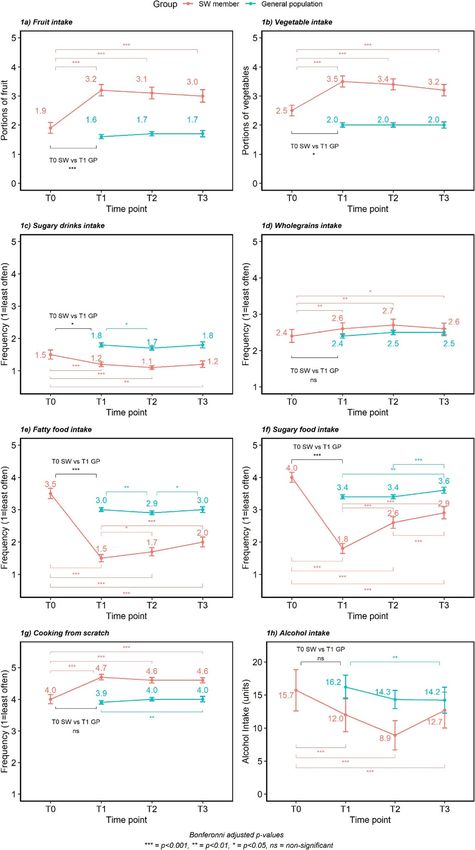
Well-being changed significantly over time for members
(F (1.9417.21) = 130.708, p < 0.001) increasing between Harder to access healthier food options
the baseline and 3-month survey points (22.2 ± 2.93 vs Many reported difficulties in shopping and accessing
29.4 ± 6.20; T1 vs T2). At the 6-month survey, well- certain foods, with usual healthier alternatives not being
being scores had decreased compared to that at the 3 available. There were reports of difficulties obtaining
month point (27.8 ± 6.73; T3, p < 0.001) but remained
higher than that at T1 (27.8 ± 6.73 vs 22.2 ± 2.93; T3 vs
T1, p < 0.001).
Well-being changed over time for the general popula-
tion samples (F (2,3545) = 47.374, p < 0.001), which was
greater within the 3-month sample compared to the
sample at the first survey (24.6 ± 7.52 vs 22.7 ± 3.93; T2
vs T1, p < 0.001). Well-being scores at the 6-month sur-
vey did not differ compared to the 3-month survey (p >
0.04) and were still higher than data from the first survey
(24.4 ± 7.23 vs 22.7 ± 3.93; T3 vs T1, p < 0.001). Well-
being scores were significantly higher for SW members
at T2 (p < 0.001) and T3 (p < 0.001) (Fig. 4).
Around half (52%) of SW members and the general
population (50.9%) reported their mood had not been af-
fected by the COVID-19 situation. Just over a third of Fig. 4 Mean scores and 95% confidence intervals for well-being
over time
members (36.3%) reported their mood had decreasedAvery et al. BMC Public Health (2021) 21:1152 Page 9 of 14
Table 2 underlying and related sub-themes emerging when Some mentioned the need to shield due to health con-
respondents were asked to explain why managing weight was ditions making it difficult to access healthy foods. Key-
easy or difficult during the COVID-19 affected period workers, particularly those working in the NHS,
Underlying theme: Changes to routine reported finding it difficult to find time to shop for food,
Key theme Related sub-themes a lack of healthy foods available during long shifts, feel-
Harder to access healthier Shopping less frequently; limited ing exhausted and grabbing snacks more often rather
food options (Barrier) availability; fresh produce not lasting in- than having a time for a meal.
between shops; limited delivery ser-
vices available; reduced income
‘Working shifts in ICU in hospital, little time to shop,
unhealthy food more available and exhausted’ (SW
More time at home (Barrier) Eating through boredom; lack of
routine; greater accessibility to food; member).
increased snacking; drinking more
alcohol
More time at home
Emotional impact of Anxiety; worry and stress; feeling
lockdown (Barrier) down/low; comfort eating; reduced Many respondents, both the general population and SW
income; health related issues; drinking members, reported snacking more frequently on less
more alcohol healthy foods due to being at home, boredom and being
Changes to physical activity Less exercise; no gyms; no work-related out of a normal routine or lack of structure to the day.
levels (Barrier & Enabler) exercise; sedentary behaviours; no facil-
ities; need to shield; more time to
Being at home during the day with children who are
exercise snacking was mentioned as increasing temptation to join
Maintenance of healthy Coping strategies; more time to plan; in with snacks. Spending more time at home was also
habits (Enabler) cooking more from scratch; not reported to increase temptation to spend more time in
socialising as often; motivation sedentary activities such as watching TV and increasing
temptation to more alcohol. Some mentioned baking
more often to occupy children and grandchildren which
meant they felt they now had more higher fat and sugar
foods to eat.
fresh fruit and vegetables and healthier options such as
‘Because of too much snacking out of boredom. Also,
skimmed milk. Difficulties in accessing shops or being
the children always munching on something like crisps
able to get online delivery slots (including difficulties fi-
and sweets and it makes me want to join them’. (General
nancing the minimum spend) were reported. Shopping
population).
less frequently and making a larger shop or being
‘Having a lot of extra time, boredom and being at
dependent on others were mentioned as making it more
home with food in the cupboards/fridge I have found it
difficult to have a regular supply of fresh foods particu-
difficult to stay on plan but I am managing it’. (SW
larly vegetables and salad ingredients due to their shelf
member).
life. Some also mentioned the larger shops meant that
‘I am stuffing my mouth with sweet stuff - I need to lose
there were more tempting snack foods available in the
weight I have put on a stone if not more’ (General
house. Furlough and a reduction in household income
population).
was mentioned as impacting on shopping habits, making
‘More time at home and am not working. Drinking
it more difficult to shop as often and have healthy foods
more alcohol which gives you the alcohol munchies. Bit
in the house.
of a feeling of the school holidays’ (SW member).
‘Fresh fruit and veg sometimes dont turn up with order,
but cookies always do’ (General population).
‘Unable to get deliveries of some foods that are helpful Emotional impact of lockdown
for a healthy diet. Supermarkets substituting unhelpful The emotional impact of lockdown was clear amongst
alternatives’. (SW member). SW members and the general population, with many
‘Not doing my own shopping relying on others to bring reporting feeling stressed, worried, anxious and/or low.
food in from shops I don’t use normally’. (SW member). Some reported that there were too many things to worry
‘It’s harder to keep a supply of fresh fruit veg and salad about to think about managing their weight. Key
without going to the supermarket every 3-4 days’ (Gen- workers mentioned not being able to prioritise healthy
eral population). eating, activity or weight management at this time.
‘Because my husband has been furloughed from his job There was mention of poor mental health and ‘having
for only 80% of his salary, we can’t afford to get as much no interest in anything else including eating healthily’.
shopping as we would get before. We aren’t able to get Many reported they were comfort eating because of their
out as I am having to self isolate due to underlying mood and some said they were using food and alcohol
health conditions’. (General population). as coping mechanisms.Avery et al. BMC Public Health (2021) 21:1152 Page 10 of 14
‘A depressing time and can’t contemplate watching Maintenance of healthy habits
what I eat or drink’. (General population). This theme, an enabling theme, was the least common
‘My mental health is suffering and I have no interest in for both groups of respondents, but some did express a
anything including eating healthy’. (SW member). commitment to maintaining healthy habits and finding
‘Working in the NHS has been stressful and sometimes alternative forms of exercise. Some found that they had
it’s easy to grab a snack rather than a meal, plus sitting more time and were able to go for a daily walk which
around more had led to comfort eating’. (SW member). they would not have done before lockdown.
‘Anxiety makes me eat as I eat for comfort. Always the ‘I was advised to lose weight for health reasons which
wrong foods - sugary and sweet’. (SW member). along with my consultant at SW gave me the inspiration
‘I am lacking in the motivation to do anything; I had to do so. I am motivated and determined about this and
just recovered from depression and now I have no real have no intentions of regressing’. (SW member).
reason to leave the house. I used to walk all the time and ‘Plenty of time to go walking and plan meals, shorter
do Yoga and I just cannot be bothered’. (General working hours means i can be home earlier and take
population). time over making dinners’. (General population).
‘I have had more time to cook, mostly from scratch &
more time to exercise (plus gardening, cleaning, sorting)’.
Changes to physical activity levels (SW member).
Responses were mixed in terms of physical activity; ‘Easier, cant get certain foods so not much to snack on’.
while some felt that lockdown had encouraged them to (General population).
be more active, the majority felt that lockdown had pre- There was mention of not eating out or eating take-
vented them from being active. The main barrier to aways as often and cooking from scratch more which
physical activity was the closure of gyms, leisure centres were highlighted as making it easier to now eat more
and exercise classes. Those who had previously exercised healthily and manage weight. Some also reported socia-
at the gym or engaged in swimming, team sports or ex- lising less meant they were now drinking less alcohol.
ercise classes noted a decrease in activity levels. Under- ‘No more coffee and cake in cafes!’ (General
lying health conditions, the need to shield and having population).
symptoms of the virus such as breathing difficulties and Some of the SW members who had joined six months
fatigue were mentioned by a few respondents as a cause ago reported having coping strategies in place.
of being less active. Some reported that they had more ‘Daily diary and bought the best scales to match SW’
time to get outside to walk or cycle and some talked (SW member).
about engaging in online exercise classes. Being fur- ‘It’s always difficult! But just belonging is enough to
loughed for some meant that they had more time to ex- keep me in check, even if I am actually losing very little’.
ercise, while for others meant that they no longer had (SW member).
the daily walk or cycle to and from work. Some respon-
dents mentioned that working from home meant they Change to normal routine – other factors
were sat down a lot more and not moving around as All five key themes were related to the changes in rou-
much as they would normally do in their job. For others, tine experienced during lockdown. There were a few
not being in the office meant they now spent less time other areas cited which do not sit within the key themes
sitting. but are also related to the changes in routine and which
‘I cannot do all the activities like swimming, the gym, may affect dietary habits and weight status. These areas
cinema, theatre, Meetup walks, socialise with friends, include the impact on sleeping patterns, living arrange-
look after my grandkids that I normally do on a weekly ments and the consequence of the SW groups being de-
basis… Not as physically active…’ (SW member). livered virtually rather than in-person.
‘Can’t exercise as much as I would like. No longer ‘I am sleeping badly. I am awake for longer than usual
walking as part of my journey home from work’. (General so I am eating more, causing weight gain’. (General
population). population).
‘Can’t go to gym, don’t have space or equipment to ex- ‘Because I’m not in my normal routine and I find it
ercise at home properly and lack of motivation’ (General easier to be healthy in a routine’. (SW member).
population).
‘Time to be more active and taking bike rides with my Discussion
son. Not working so sitting down a lot less’. (SW This mixed-methods study surveyed adults who had
member). joined a weight management programme, (Slimming
‘Furloughed from work so have more time to exercise’. World, SW), six months previously and a representative
(General population). sample from the general population. Given that the six-Avery et al. BMC Public Health (2021) 21:1152 Page 11 of 14 month time point corresponded with the first UK lock- population reported increasing the frequency of intake down due to COVID-19, the study team were curious to of both sugary and fatty foods at this time and this is investigate how the related changes may have impacted mirrored by the findings of similar research looking at on health-related behaviours, well-being and the ability the impact of the UK lockdown on eating behaviours to manage weight. It was predicted that these behaviours [8]. This was also reflected by the quantitative data. would have been negatively affected. Over half of both However, due to already having reduced the frequency groups of respondents said that they had found it more of fatty and sugary food intake since joining Slimming challenging to manage their weight during the COVID- World, members were still consuming less than they had 19 lockdown period. been previously, and were consuming sugary and fatty The SW respondents were predominantly female with foods less often than the general population during lock- a mean BMI placing them in the obese category. Around down. Whilst there was some reporting of alcohol intake 12% of the original new SW members completed the six increasing due to the COVID-19 situation, average in- month survey. They had been able to maintain a mean takes of the general population did not differ at this weight loss of almost 8% at six months with no mean time, whereas the quantitative data for members indi- absolute weight gain observed and with this group of cated a significant increase. However, again due to the 222 adults achieving a mean BMI reduction of 3 kg/m2. significant reductions in alcohol intake made by mem- The data collected suggests that a number of changes to bers within the first three months of their membership, dietary behaviours were made within the first few weeks even though their weekly units increased during the after joining the programme, many of which were main- COVID-19 situation, they were still drinking below the tained over the following three months, which were government recommendations, and less than before they likely to have contributed to the weight loss observed. joined Slimming World. These dietary changes included eating more fruits, vege- When asked whether activity levels had changed due tables, eating fewer fatty and sugary drinks/foods, eating to the COVID-19 situation, there was a fairly even more wholegrains, cooking more from scratch and cut- spread across responses, with both members and the ting down on alcohol intake. Increases were seen in general population reporting increases, decreases and no physical activity levels which may have also contributed change in activity. Interestingly, clearer patterns emerged to the maintained weight loss. Levels continued to in- from the longitudinal data. There were differences in crease 3–6 months after joining. physical activity behaviour between the two groups with The representative general population respondents the SW members being less active before they joined the had a mean BMI which would have placed them in the programme compared to the general population sam- overweight towards obese category and which did not ples. Whilst the general population sample substantially differ between samples. They were recruited as not cur- decreased the time they spent engaged in physical activ- rently accessing weight management support from a ity during lockdown, the SW members, on average, con- commercial provider. The baseline dietary behaviours of tinued to increase the amount of time they spent being the general population were very similar to the dietary physically active, suggesting that the behaviour change habits of the SW members before they joined the weight they had already initiated helped them maintain this management programme suggesting that the member healthy routine and prevent the decrease in activity seen behaviour was very similar to the general population in the general population. sample and that the weight loss achieved and maintained The qualitative data suggested that changes to routine by SW members was as a consequence of sustained be- during the lockdown period had a major impact and haviour change. Furthermore, the dietary habits of the contributed to the key themes observed when respon- general population samples did not differ between the dents were asked if and why managing their weight was first two time points apart from alcohol intake. There easy or difficult during the lockdown period. Clearly were no reported differences in income levels between some respondents, particularly the SW members, had the two groups. Given these similarities between the developed different coping strategies, some respondents groups, the data provides an insight into how people found the extra time available made it easier to find time accessing a weight management support programme be- to exercise or to cook meals from scratch whilst others fore lockdown were able to respond to the dietary chal- expressed the fact that because they were able to social- lenges faced during lockdown in contrast to the cross- ise less they were not meeting up with friends for coffee section of a representative sample from the wider popu- and cake. lation who had not received this support. SW members However far more respondents from both groups re- were able to maintain most of the dietary changes they ported the difficulties they had encountered with a num- had already made, despite the challenges faced. A not- ber of barriers preventing them maintaining healthier able proportion of both members and the general habits. Overwhelmingly many people said that they
Avery et al. BMC Public Health   (2021) 21:1152                                                             Page 12 of 14

found it harder to access healthier food options and this    place to return to their healthier dietary practices. The
was for a number of reasons. The changes to the food         finding that for some people, the COVID-19 lockdowns
environment resulting from the pandemic made access          are a time of high risk for over-eating has also been
to routinely consumed foods more challenging with            found in a recent online survey of a mainly UK based
guidance early on for people to limit visits to supermar-    adult population where almost half reported an in-
kets to once per week. This coupled with many stores         creased food intake although with a large individual vari-
having reduced availability and people having reduced        ability in the craving of high-energy dense sweet and
geographic mobility due to isolation, meant accessing        savoury foods [13]. Similarly, the anxiety we report has
fresh produce became difficult. Despite this, SW mem-        also been explored in an online survey (n = 264) of per-
bers managed to maintain their increased consumption         ceived changes in eating, exercise, and body image re-
of fruit and vegetables during lockdown, which was sig-      lated to mental health during lockdown within the UK.
nificantly greater than that of the general population.      Again, there were large individual differences in the per-
Some people expressed the fact that their incomes had        ceived changes with women more likely than men to
been reduced as a consequence of the pandemic and this       report increasing struggles with regulating eating, their
limited their budget for food expenditure. Concerns          preoccupation with food and worsening body image [14].
about financial stability may have added to the food in-        Early government guidance allowed people to just go
security experienced by many during lockdown [9, 10].        out once a day for physical activity with walking posi-
  Another contributing factor to the dietary habits          tively encouraged. However, many people do not have
resulting from lockdown which made weight manage-            pleasant and safe parks or green spaces in order to
ment more challenging was the strong ‘eating through         achieve this and because of the need to shield, felt too
boredom’ theme. Again, changes to routine, being at          vulnerable to go outdoors. Gyms, swimming pools and
home more with greater accessibility to certain foods led    leisure centres were closed at the time of the survey.
to a greater perceived level of snacking and snacking on     Thus, whilst some may have been able to have increased
foods that they would not normally choose. Marrying up       their physical activity levels, others will have become
the quantitative and qualitative data, both groups did in-   more sedentary. This was certainly the findings of the
crease their intake of sugary foods during the lockdown      qualitative work where some respondents said that lack
period and this may have been due to eating more             of facilities and motivation were barriers that contrib-
through boredom and snacking on foods like chocolate,        uted to reduced physical activity levels whilst others said
cakes and confectionary. Indeed some people said that        that having more time available because of being fur-
because they had more time on their hands, they were         loughed, enabled them more time to be active. Whilst
baking more.                                                 the SW members engaged in less physical activity before
  Across the UK, people’s level of anxiety increased as a    joining the programme compared to the general popula-
consequence of COVID-19. There was and there still is        tion representative sample, they were still able to further
a lot of uncertainty [11]. For many this means emotional     increase their activity levels during lockdown. In contrast
eating and eating foods and drink they would not nor-        the general population did decrease their levels. This
mally choose [12]. The acknowledgement that obesity          contrast may have been due to the focus on increasing
increases the severity of symptoms and worsens treat-        activity levels as part of the SW programme during the
ment outcomes may have led to increasing anxiety levels      lockdown where the delivery changed to virtual groups
for those people with high BMIs [8]. In the present          with the use of social media platforms to extend the sup-
study, over a third of both members and the general          port offered. A specific campaign to help members be
population reported that their overall mood had de-          active at home was launched.
creased due to the COVID-19 situation. This is reflected        The changes to routine during lockdown may have af-
in the longitudinal data, as the overall well-being score    fected sleeping patterns. Quantitative data was not col-
of members had significantly reduced, however it             lected about sleeping habits which may have been of
remained higher than that of the general population.         interest and a limitation of the current study. Certainly
Many people from both study groups expressed that            for some people reduced sleep can have an impact on
stress, worry and anxiety were barriers that had made        dietary behaviours with some people eating more as a
weight management more challenging. Financial chal-          consequence [15].
lenges added to their stress as did health-related issues.      Longitudinal data is only available for the SW mem-
They recognised they were emotional eaters and comfort       bers with representative samples of the general popula-
eating on sugary foods or drinking more alcohol as a         tion recruited at each time point. Whilst a richer
consequence of their emotions. Some recognised that          understanding of the general population data would be
whilst they had anxiety and other problems to worry          obtained using a longitudinal design the primary aim of
about initially, they then needed to have strategies in      this study was to understand the changes SW members
Avery et al. BMC Public Health   (2021) 21:1152                                                                             Page 13 of 14

made over time and how their health and behaviours            of spending more time at home, boredom and emotional
compared to samples of the general population. The            eating because of the added stress and anxiety. However,
consistency in measures between the general population        there were some who reported that the extra time
samples suggest that these data do offer a practical          afforded to them by the lockdown enabled them to plan
insight into behaviours that are typical within the wider     better, cook from scratch more and allowed them to fit
general population and serve as a representative com-         physical activity into their routines, suggesting they had
parison with SW members. The study is limited by the          developed strategies to help protect their weight.
low response rate at the 6 month point with only 222 of          Helping people cope with set-backs throughout their
the original 1884 SW members completing the surveys           weight loss journey may help them establish the skills
at all three time points, of which this subsample were        needed to cope with situations such as the COVID-19
older and may not be totally representative of the overall    lockdown. Overall, SW members were actually able to
SW membership. In addition the use of self-reported           increase their activity levels, whilst lockdown did seem
data may have led to bias in the reporting of weight, life-   to negatively impact on the physical activity levels of the
style and well-being changes although given the remote        general population. SW members showed a level of re-
nature of this research self-reported measures were the       silience and were able to maintain most of the positive
only viable means of collecting such data. Being a mem-       dietary changes that they had made since joining, and
ber of SW may have led to some reporting bias through         during the COVID-19 situation were still reporting im-
the sub conscious effect of being part of an organisation     provements in all dietary behaviours measured, with
and perceived demand characteristics alongside impres-        healthier scores than the general population, and main-
sion management. We did not assess levels of food inse-       tained their earlier weight loss.
curity at baseline or changes in levels of food insecurity
at subsequent time-points although the median annual          Acknowledgements
                                                              The authors wish to acknowledge the contribution made by Dr. Kath Roberts
household income levels were the same for the study           to the design of the study protocol and development of the survey.
groups and the general population at each time-point.
However, we appreciate that levels of food insecurity         Authors’ contributions
may be an important variable to consider in future re-        AA, JT, JK, LH, JL & SB were involved in the design of the study protocol and
                                                              development of the survey. JT led on the quantitative data analysis and
search and may limit the wider application of our find-       reporting. AA and LH led on the qualitative data analysis and reporting. AA
ings. Similarly, underlying health conditions may have        led on the writing of the manuscript with JL and SB contributing.
also influenced the results but were not considered in
                                                              Funding
this study. A further limitation is that some error may       This research did not receive any specific grant from funding agencies and
have been introduced through the use of parametric            was undertaken as part of on-going research by the Slimming World Nutri-
analysis for the Likert data.                                 tion, Health & Research team.
  However, using the mixed-methods approach allows
                                                              Availability of data and materials
the ability to verify the findings through the use of the     Data is available on request from the corresponding author. The survey is
quantitative and qualitative data and indeed good verifi-     available via Supplementary material.
cation was reported for both groups. The reported find-
ings from this study are also in-line with other              Declarations
observations of the impact of the COVID-19 situation          Ethics
on health-related behaviours [6, 8, 13, 14, 16]. A further    The study was performed in accordance with the Declaration of Helsinki and
limitation could be that one would expect to see some         approved by the University of Nottingham, School of Biosciences Ethics
                                                              Committee No: SB1819/36. Informed consent was obtained from all
return to original health-related behaviours in people        participants whose data has been included in the report and participants
accessing weight management support. However the              consented to the report being publicly available.
findings reported at three months after joining SW are
very similar to the behavioural changes reported and          Consent for publication
                                                              All authors have given consent for the manuscript to be published and the
sustained in a previous study of the health-related           findings more widely disseminated.
changes achieved and their contribution to weight man-
agement at 12 months [17, 18].                                Competing interests
  In conclusion, this study found that the COVID-19           All authors, including AA, receive salaries through SW.
lockdown period affected adults who had been accessing        Received: 25 January 2021 Accepted: 24 May 2021
weight management support in a similar way to the gen-
eral population with both groups finding weight man-
agement more challenging due to the changes in routine        References
                                                              1. PHE (2020). Excess weight and COVID-19: insights from new evidence.
and it being harder to access healthier foods. It found           https://www.gov.uk/government/publications/excess-weight-and-covid-19-
people’s eating and drinking habits were affected because         insights-from-new-evidence (accessed 27.07.2020)
You can also read