Moderate Genetic Diversity and Demographic Reduction in the Threatened Giant Anteater, Myrmecophaga tridactyla
←
→
Page content transcription
If your browser does not render page correctly, please read the page content below
ORIGINAL RESEARCH
                                                                                                                                                  published: 01 July 2021
                                                                                                                                        doi: 10.3389/fgene.2021.669350

                                              Moderate Genetic Diversity and
                                              Demographic Reduction in the
                                              Threatened Giant Anteater,
                                              Myrmecophaga tridactyla
                                              Carmen Elena Barragán-Ruiz 1* , Rosane Silva-Santos 1 , Bruno H. Saranholi 1,2 ,
                                              Arnaud L. J. Desbiez 3,4,5 and Pedro Manoel Galetti Jr. 1
                                              1
                                               Departamento de Genética e Evolução, Universidade Federal de São Carlos, São Carlos, Brazil, 2 Department of Life
                                              Sciences, Imperial College London, Ascot, United Kingdom, 3 Instituto de Conservação de Animais Silvestres, Campo
                                              Grande, Brazil, 4 Royal Zoological Society of Scotland, Edinburgh, United Kingdom, 5 Instituto de Pesquisas Ecológicas,
                                              Nazaré Paulista, Brazil

                                              In general, large mammal species with highly specialized feeding behavior and solitary
                                              habits are expected to suffer genetic consequences from habitat loss and fragmentation.
                                              To test this hypothesis, we analyzed the genetic diversity distribution of the threatened
                                              giant anteater inhabiting a human-modified landscape. We used 10 microsatellite loci to
                           Edited by:
                                              assess the genetic diversity and population structure of 107 giant anteaters sampled in
           Gislene Lopes Goncalves,
  Federal University of Rio Grande do         the Brazilian Central-Western region. No genetic population structuring was observed
                             Sul, Brazil      in this region suggesting no gene flow restriction within the studied area. On the other
                         Reviewed by:         hand, the moderate level of genetic diversity (Ho = 0.54), recent bottleneck detected
                      Izeni Pires Farias,
Federal University of Amazonas, Brazil
                                              and inbreeding (Fis , 0.13; p ≤ 0.001) signatures suggest potential impacts on the
                         Stefano Mona,        genetic variation of this Xenarthra. Additionally, a previous demographic reduction was
   Ecole Pratique des Hautes Etudes,
                                              suggested. Thus, considering the increased human-promoted impacts across the entire
        Université de Sciences Lettres
                       de Paris, France       area of distribution of the giant anteater, our results can illustrate the potential effects
                 *Correspondence:             of these disturbances on the genetic variation, allowing us to request the long-term
         Carmen Elena Barragán-Ruiz           conservation of this emblematic species.
             car.hele.ruiz@gmail.com
                                              Keywords: bottleneck, inbreeding, population size reduction, microsatellite markers (SSR), Xenarthra
                   Specialty section:
         This article was submitted to
Evolutionary and Population Genetics,         INTRODUCTION
               a section of the journal
                  Frontiers in Genetics       During the last decades, anthropogenic impacts have promoted habitat loss and fragmentation
         Received: 18 February 2021           by extensive agriculture, urbanization, and highways and thus threaten biodiversity worldwide
            Accepted: 24 May 2021             (Storfer et al., 2010; Haddad et al., 2015) including populations of wild animals. More and more,
            Published: 01 July 2021           isolated populations are affected by decreasing population size (Reed and Frankham, 2003) and
                            Citation:         reduced gene flow (Haag et al., 2010; Oliveira and Hannibal, 2017) and become more sensitive
   Barragán-Ruiz CE, Silva-Santos R,          to genetic drift effects (Reed and Frankham, 2003). Consequently, local genetic variation can be
      Saranholi BH, Desbiez ALJ and           reduced, and genetic differentiation among populations increases, negatively impacting the long-
       Galetti PM Jr (2021) Moderate
                                              term persistence of wild populations (Reed and Frankham, 2003). In this scenario, large mammals
  Genetic Diversity and Demographic
   Reduction in the Threatened Giant
                                              are the most threatened vertebrates affected by habitat loss and fragmentation, resulting in genetic
  Anteater, Myrmecophaga tridactyla.          variation loss (Lino et al., 2019).
            Front. Genet. 12:669350.             Extant in several major biomes across Central and South America, the giant anteater,
    doi: 10.3389/fgene.2021.669350            Myrmecophaga tridactyla, is a charismatic and large Xenarthra that has been suffering from human

Frontiers in Genetics | www.frontiersin.org                                          1                                             July 2021 | Volume 12 | Article 669350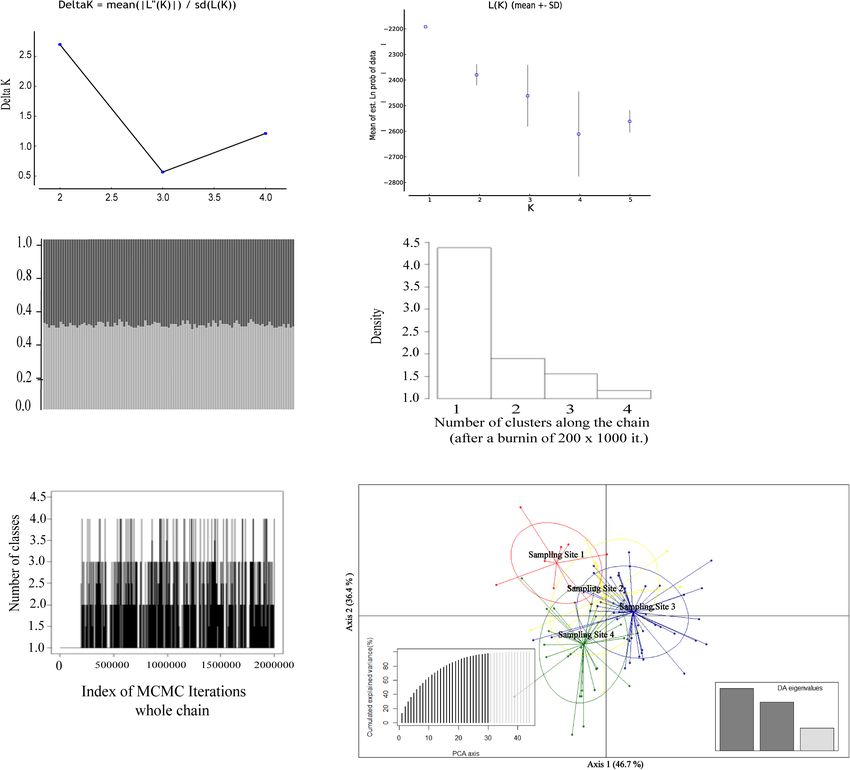
Barragán-Ruiz et al.                                                                                                Genetic Diversity of Giant Anteater

activities in several regions of its distribution area. Currently           Information, Chico Mendes Institute for Biodiversity
categorized as “Vulnerable” and with decreasing populations in              Conservation, Ministry of Environment, Brazil), under the
the International Union for Conservation of Nature (IUCN) Red               number 53798-4. The research was approved by the Ethics
List (Miranda et al., 2015) and in the Brazilian Threatened Species         Committee on the Animal Experimentation (CEUA/UFSCar)
List (Miranda et al., 2018), the giant anteater has disappeared             protocol number 1584280817, and the genetic resource access
in several areas of its original range (Bertassoni et al., 2014),           was registered under SisGen A9F8717.
mainly due to habitat reduction and fragmentation caused by
anthropic activities (Bertassoni et al., 2014; Miranda et al.,              Study Area and Sampling
2015). Its solitary habits, low fecundity, long gestation time,             The study was carried out in the Central-Western region of
and relatively high generation time (Eisenberg and Redford,                 Brazil, comprising the biome Cerrado (Neotropical savanna) and
1999) added to a specialist diet (McNab, 1984), making this                 transition areas with two other biomes, the Pantanal wetlands
species more vulnerable and threatened in anthropic scenarios               and inland Atlantic forest (Figure 1). In this area, agriculture
(Desbiez et al., 2020). Within the distribution area of the                 has transformed the landscape into a mosaic of monocultures,
giant anteater, mitochondrial haplogroups have been described,              mainly soy and sugarcane crops, and pasture with different
separating a population in the Amazon Forest from another                   degradation levels of natural vegetation (Brazilian Institute of
group represented by individuals from the Cerrado and Pantanal              Geography and Statistics (IBGE), 2020), besides urbanization,
biomes (Clozato et al., 2017). Although two studies using local             roads, and highways.
populations have already been published, little is known about                 We collected a total of 107 tissue samples, comprising 66
the consequences on the genetic variation in highly anthropized             samples from roadkill animals in four main roads crossing our
regions of these vulnerable animals in Brazil. A previous genetic           study area and 41 samples obtained from captured wild animals
study on anteaters in Central-Western Brazil evidenced a low                (Figure 1). All tissue samples were conserved in 95% ethyl
genetic diversity and high inbreeding in a small local population           alcohol and stored in a freezer at −20◦ C. All samples were
inhabiting a protected area submitted to recurrent fire events              collected by the research project “Anteaters and Highways”1 . The
(Collevatti et al., 2007). Conversely, another study in Central-            sample collection was conducted from April 2013 to February
Southern Brazil suggests high levels of genetic diversity in a              2017. This sampling represents the largest range for a giant
regional geographic scale accompanied by spatial population                 anteater population genetically evaluated so far. A detailed
differentiation (Sartori et al., 2020). Of note, all these previous         information related to each specimen sample is available in
studies focused on small local populations inhabiting protected             Supplementary Table 1.
areas or surrounding protected areas, and there is no genetic
populational analysis evaluating this genetic information in a              DNA Extraction and Genotyping Genetic
large-scale anthropized area.                                               Analysis
   The Brazilian Central-Western region, located on the                     Total genomic DNA was extracted using the conventional
southern edge of the distribution area of the giant anteater,               phenol-chloroform protocol (Sambrook et al., 1989). The DNA
has been undergoing an intense urbanization process with                    quality was checked by electrophoresis on 1% agarose gel stained
remarkable agriculture development (Brazilian Institute of                  with Gel RedTM (Biotium, Hayward, CA, United States).
Geography and Statistics (IBGE), 2020) and an increase in roads                A total of 10 microsatellite loci (Supplementary Table 2) were
and highway constructions (Grilo et al., 2019). These landscape             used for genotyping all the individuals. Five microsatellites (04,
modifications are relatively recent and have mostly occurred                07, 11, 13, and 20) were described for M. tridactyla (Garcia
during the last five decades (Brazilian Institute of Geography              et al., 2005), and five heterologous primers (A9, B2, E3, G3, and
and Statistics (IBGE), 2020). In this context, we predicted that            H5) were developed for Tamandua tetradactyla (Clozato et al.,
the giant anteaters living in this increasingly human-modified              2014). We used a universal M13 primer fluorescent-labeled and
landscape would lose genetic diversity and show fragmented                  an M13 complementary tail to the 50 position of each forward
populations with reduced gene flow. Therefore, we tested the                primer (Schuelke, 2000) for genotyping each locus. The PCR
hypothesis that anteater populations inhabiting a large polygon             reaction was performed in a final volume of 10 µl containing
in Central-Western Brazil will show reduced genetic diversity               1 U GoTaq DNA polymerase (Promega), 1 × buffer, 1.5 mM
and signals of gene flow reduction among local populations.                 MgCl2 , 0.20 mM deoxyribonucleotide triphosphates (dNTPs),
In addition, we hypothesized that a reduction in the effective              0.8 mg/ml bovine serum albumin (BSA), 2 pmol forward, and
population size of anteaters, due to the high loss of natural               8 pmol of reverse primers, 8 pmol M13 primers, and ∼30 ng of
habitat, will be observed. This represents the first large population       the target DNA. PCRs were conducted in two steps. PCRs were
genetic study in giant anteaters.                                           run with an initial denaturing step of 1 min at 94◦ C, followed
                                                                            by 20 cycles of 1 min at 94◦ C, 45 s at locus-specific annealing
                                                                            temperature (Supplementary Table 2), and 1 min at 72◦ C. In a
MATERIALS AND METHODS                                                       second step, eight cycles of the 30 s at 94◦ C, 45 s at 53◦ C, and
                                                                            45 s at 72◦ C were added, and a final extension for 20 min at 72◦ C.
Ethics Statements                                                           PCR products were checked on 2% agarose gel. Fragments were
The biological sampling authorization was obtained through the
SISBIO-ICMBio (Authorization System and Biodiversity                        1
                                                                                www.giantanteater.org

Frontiers in Genetics | www.frontiersin.org                             2                                       July 2021 | Volume 12 | Article 669350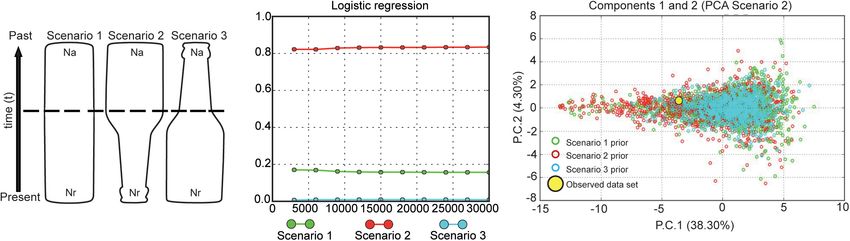
Barragán-Ruiz et al. Genetic Diversity of Giant Anteater
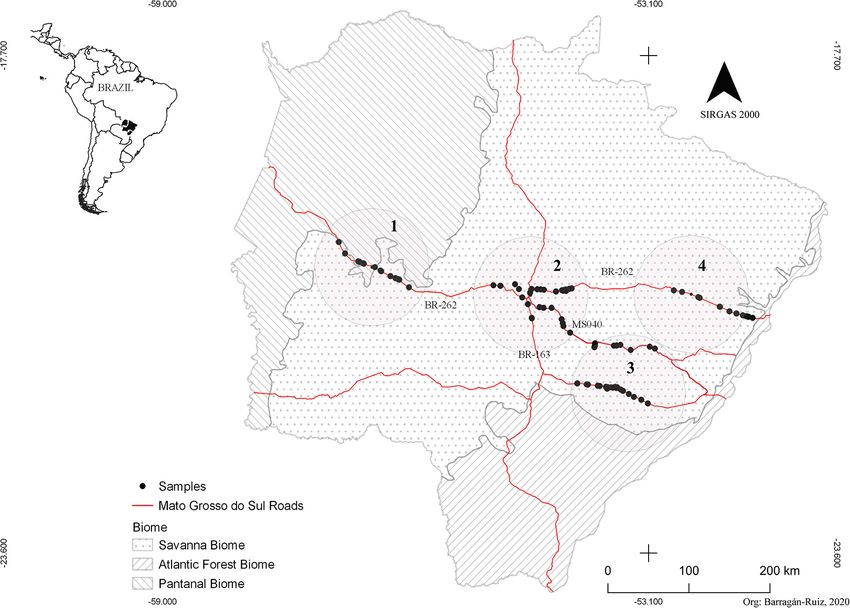
FIGURE 1 | Geographic location of Myrmecophaga tridactyla individual sampled. Red lines represent the main Mato Grosso do Sul roads, and black dots are each
individual.
genotyped using an ABI3730XL automatic sequencer (Applied Evanno et al. (2005), it is necessary to use the maximum number
Biosystems, United States). Allele sizes were scored using internal expected for K (K = 4, in our case) plus 1. For 1K estimation, we
standard ROX 550 and manually determined using Geneious R7 used the algorithm implemented in STRUCTURE HARVESTER
(Biomatters Ltd, New Zealand) (Kearse et al., 2012). The samples (Earl and vonHoldt, 2012). We also verified the best K in
consistently producing not concordant or negative genotypes at STRUCTURE based on the Ln value according to Pritchard
a locus after three repetitions using different DNA aliquots were et al. (2000). We furthermore used the GENELAND package
treated as missing data. (Guillot et al., 2005), implemented in R Core Team (2017), to
conduct a Bayesian spatial clustering model. GENELAND uses
spatial location of the samples, which provides more support
Genetic Population Structuring and to clustering analyses, even when crypt patterns of population
Genetic Diversity structuring occur (McManus et al., 2015) and can be especially
The presence of null alleles and scoring errors due to helpful in the case of sparse sampling (Ball et al., 2010). In this
allelic dropout and stutter peaks were checked using analysis, we used the correlated frequency model, 1,000,000
MICROCHECKER v. 2.2.3 (Van Oosterhout et al., 2004) MCMC iterations, and thinning and burn-in parameters set
and Oosterhout estimator. Genetic population structuring was at 1,000 and 200, respectively. The tested group number was
investigated using different methods, in which our sampling K = 1–4. The choice of K was based on the histogram of
was first organized in four 200-km diameter sampling areas, estimated K for each run, and the highest mean posterior density
representing what we considered the main sampling areas, across replicates was considered the best K.
named hereafter sampling sites 1–4 (Figure 1). We used the Population structuring was also evaluated by a multivariate
Bayesian assignment analysis implemented in the STRUCTURE approach using discriminant analysis of principal components
v. 2.3.3 software (Pritchard et al., 2000). The most likely number (DAPC; Jombart et al., 2010) from the Adegenet package
of clusters (K) was tested using the admixture model with (Jombart, 2008), implemented in the R software (R Core Team,
sampling location as prior (LOCPRIOR) information, with 2017), which do not make any assumption about the underlying
1,000,000 Markov chain Monte Carlo (MCMC) iterations, and population genetic model (Jombart, 2008).
each K-value (1–5) was tested with 10 replicates and burn-in To test the correlation between the genetic and geographic
at 1,000. We tested for K ranging from 1 to 5 because, for K distances and check a possible sexual dispersion bias reported
determination based in the highest value of 1K, following by Collevatti et al. (2007), we evaluated the presence of
Frontiers in Genetics | www.frontiersin.org 3 July 2021 | Volume 12 | Article 669350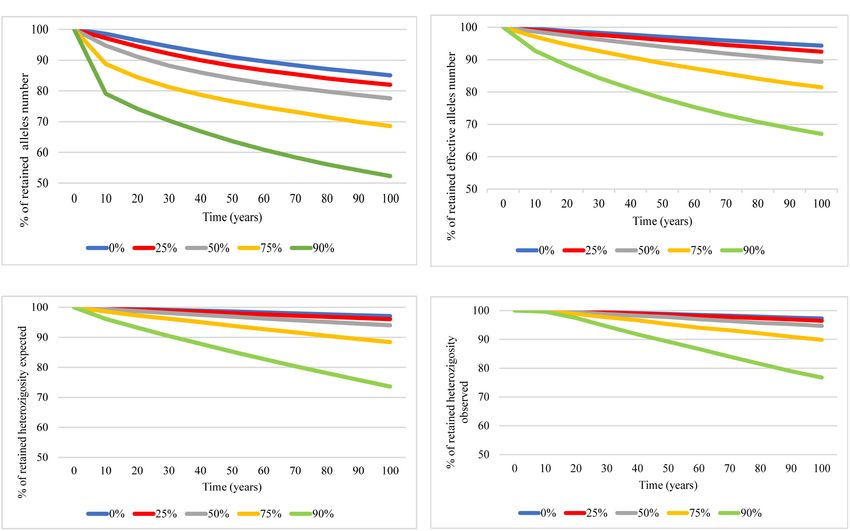
Barragán-Ruiz et al.                                                                                              Genetic Diversity of Giant Anteater

isolation by distance (IBD) using the Mantel test (Mantel, 1967).         limit), dioecy with random mating reproductive system, expected
All individuals had the sex previously assigned by molecular              longevity = 15 years, age of reproductive maturation = 4 years,
identification using the protocol of Barragán-Ruiz et al. (2020)          male/female ratio was set to 1:1 (parameters according to Desbiez
(sex individual information in Supplementary Table 1). The                et al., 2020), number of years simulated = 100 years, and number
genetic similarity between pairs of individuals at several distance       of iterations = 1,000.
classes was assessed by a spatial autocorrelation analysis, using a
20-km distance class and a total of 50-km distance classes. The           Demographic Changes
significance values were assessed using 9,999 permutations and            We measured the contemporary effective population size (Ne)
95% confidence intervals. A significant positive autocorrelation          using the linkage disequilibrium (LD) method (Waples and
means that individuals at a given distance class are genetically          Do, 2010) and the jackknife resampling method to determine
more similar than randomly expected. Both Mantel test and the             the effective population size with 95% confidence intervals. We
spatial autocorrelation analysis were carried out in the GenAlex          calculated this parameter using the NeEstimator 2.0 software
v. 6.5.0 software (Smouse and Peakall, 2012).                             (Do et al., 2013).
    The population was redefined according to the results                    To assess recent signatures of population size reduction,
concordantly obtained in all the genetic structuring analyses             we used both the Wilcoxon test (Luikart and Cornuet, 1998)
(K = 1), and the microsatellite loci were tested for linkage              and M-ratio (Garza and Williamson, 2001). Wilcoxon test was
disequilibrium (LD) and Hardy–Weinberg equilibrium (HWE),                 done using the infinite alleles (IAM), stepwise mutation (SMM),
using the exact test of Guol and Thompson (1992) for                      and two-phase (TPM) mutation models in BOTTLENECK
heterozygote deficit in GENEPOP v. 1.2 (Raymond and Rousset,              v. 1.2.02 (Cornuet and Luikart, 1996; Luikart and Cornuet,
1994). For both LD and HWE tests, we estimated p-values                   1999). Wilcoxon test provides relatively high power to identity
using the Markov chain methods with 10,000 dememorization                 significative population size reduction signatures and can be
steps, 1,000 batches, and 10,000 iterations per batch. Sequential         applied to data sets with few polymorphic loci. For the TPM
Bonferroni corrections were applied to correct for all multiple           model, a variance of 30, probability of 90%, and 1,000 interactions
simultaneous comparisons (Rice, 1989).                                    were assumed. Genetic bottlenecks can also leave a signature
    Genetic diversity was estimated by the number of alleles              in the ratio of the number of alleles and the allele size range
(Na), effective number of alleles (Ae), observed (Ho), and                (the M-ratio), where a bottleneck depletes the number of alleles
expected heterozygosity (He) using GenAlex v. 6.5.0 (Peakall              faster than reducing allele size range of the microsatellite (Garza
and Smouse, 2012). Allelic richness (AR, Leberg, 2002) and                and Williamson, 2001). We calculated the M-ratio by M = k/r
inbreeding coefficient (Fis ) (Weir and Cockerham, 1984) with             formula, where k is the number of alleles and r = Smax − Smin + 1
the p-value for heterozygote excess (pL) and deficit (pS) were            (Smax is the size of the largest allele, and Smin is the size of the
calculated for each locus using FSTAT v. 2.9.3.2 (Goudet, 1995).          smallest allele in the sample), using ARLEQUIN v 3.5 (Excoffier
To verify a kinship effect in Fis values, we calculated different         and Lischer, 2010). It was considered that M < 0.68 indicates a
kinship estimators (r) (Queller and Goodnight, 1989; Ritland,             bottleneck, while M > 0.80 indicates no reduction in effective
1996; Lynch and Ritland, 1999) among all individuals and within           population size (Garza and Williamson, 2001).
each sampling site. The r-values were calculated in the GenAlex
v. 6.5.0 software (Peakall and Smouse, 2012). We calculated the           Scenario’s Test of Demographic History
polymorphic information content (PIC) using the Cervus 3.0.3              We investigated historical changes in the effective population size
software (Slate et al., 2000).                                            using approximate Bayesian computation (ABC) implemented in
                                                                          DIYABC (Cornuet et al., 2010). We designed our ABC analysis
                                                                          in three steps: (1) a preliminary analysis to determine proper
Genetic Diversity in Bottleneck                                           prior intervals, (2) an analysis to evaluate the suitability of
Scenarios                                                                 each summary statistic, and (3) a final analysis to quantify the
To assess whether the current effective population size of                relative posterior probabilities of the models. We assessed the
giant anteater is sufficient to maintain the observed genetic             population size changes on the giant anteater population through
variation over the next 100 years, we simulated future genetic            the time, testing three different scenarios (Figure 3): (1) the
diversity using the program BOTTLESIM v. 2.6 (Kuo and Janzen,             population size has been stable during the time (null hypothesis,
2003) that measured changes in genetic diversity assuming no              Na = Nr, where Na is the ancestral effective population size, and
selection, migration, and mutation. We verified changes in the            Nr is the recent effective population size); (2) the population
genetic diversity parameters (observed number of alleles, effective       experiencing a reduction in the population size at coalescent
number of alleles, observed and expected heterozygosity)                  time t (bottleneck event, Nr < Na); and (3) there was an
under different population reduction scenarios, using as initial          expansion that led to an increase in the effective population size
population size the effective population size obtained here.              of the giant anteater (Na > Nr). In ABC, competing population
The future genetic diversity parameters were simulated over               scenarios are simulated, and statistical tests are then used to
100 years when retaining 100, 75, 50, 25, and 10% of the current          assess which scenario better fits the observed data. We performed
effective population size. All simulation parameters were set as          one million simulations per scenario. The prior settings for all
follows: degree of generation overlap = 100 (i.e., all individuals        parameters (effective population size, time, and mutation rate)
start with a random age value that is within the longevity                are shown in Supplementary Table 3. In DIYABC analysis, the

Frontiers in Genetics | www.frontiersin.org                           4                                       July 2021 | Volume 12 | Article 669350
Barragán-Ruiz et al. Genetic Diversity of Giant Anteater
generation time of a given species is considered the elapsed The subsequent genetic analyses considering all individuals
time between the birth of an individual and the birth of its first belonging to a single large population revealed no significant
offspring (Cornuet et al., 2014), which was assumed as 4 years linkage disequilibrium, although deviation from HWE (p ≤ 0.005
in the giant anteater, according to Desbiez et al. (2020). The after Bonferroni correction) occurred in five loci, with locus
summary statistics employed were the mean number of alleles, 4, A9, and H5 showing heterozygote deficit. Locus H5 also
mean expected and observed heterozygosity, and mean allele size showed high amount (37%) of null alleles (Table 1). We analyzed
variance. We analyzed each locus separately for increasing the our dataset with and without this latter locus, and we founded
total number of summary statistics and improving the simulation similar results. Thus, all analyses included the complete set of 10
results (Cornuet et al., 2014). Thus, we had 30 summary statistics microsatellites.
once each microsatellite was considered a distinct group to run A total of 55 alleles were obtained in the 107 samples. The
the analysis. The reliability of scenarios was visualized through number of alleles/locus ranged from three (B2 and G3) to eight
principal component analysis. (11 and 20) with a mean of 5.5, and the mean number of effective
To obtain the best fit scenario, the posterior probability (PP) alleles (Ae) was 3.10 (Table 1). Mean observed heterozygosity
for each scenario was estimated by logistic regression on 1% (Ho) was 0.54 (ranging from 0.05 to 0.84), and the mean expected
of the simulated dataset closest to the empirical data. For the heterozygosity (He) was 0.61 (ranging from 0.38 to 0.83). The Fis
scenario with high PP, we evaluated the confidence in the scenario values ranged from −0.28 to 0.47, with a statistically significant
choice estimating the posterior predictive global error using 1,000 mean value of 0.13 (p ≤ 0.001). Low relatedness level was found
pseudo-observed dataset for the logistic regression approach. To among the individuals (see r-values in Supplementary Table 4).
assess the precision for each estimated parameter, we calculated
the relative median of the absolute error (RMAE) (Cornuet et al., Genetic Diversity in Bottleneck
2010). The best model was tested by comparing the summary
statistics (mean allele size variance and mean Garza–Williamson’s
Scenarios
M index) between the observed and simulated datasets. The prediction of future genetic diversity based on BOTTLESIM
simulations projected a genetic diversity decrease in the
next 100 years in all tested scenarios. Overall, the genetic
diversity reduction was directly affected by the bottleneck
RESULTS intensity tested. The observed allele number and effective allele
number declined at a faster rate than expected and observed
Population Genetic Structuring and heterozygosity (Figure 4). The predicted future simulation
Genetic Diversity showed a decline of about 15% in the number of alleles, 6%
The PIC values for each locus were higher than 0.5, with a mean in the effective number of alleles, and 3% of expected and
value of 0.53 (Table 1), indicating that our multiloci panel was observed heterozygosity in the giant anteater population studied
highly informative and adequate for population genetic analyses even at the retention of 100% of individuals during the next
in M. tridactyla. 100 years (blue line, Figure 4). The genetic diversity decline in
All clustering approaches were agreeing to define a single the next 100 years will be sharper as the bottleneck intensity
genetic population for the giant anteater individuals analyzed is higher.
(Figure 2). Although K = 2 was obtained according to the
Evanno et al. (2005) criterion [LnP (K) = −2,251.07 and Effective Population Size Variation
1K = 2.69; Figure 2A), the graphic of individual assignment The effective population size (Ne) estimate was 375.5
showed similar probability for a given individual to belong to (CI = 80.2 − ∞; p < 0.05). Signs of population reduction
one or another population (Figure 2B), supporting an absence of were significant for the TPM model (p = 0.0048) in the
population structuring and indicating that the K definition based bottleneck analysis, and the M-ratio also showed a signal of
on 1K is not able to define de minimum K (K = 1). In turn, population reduction (M = 0.39).
the best K based on the Ln value revealed K = 1 (Figure 2C). The scenario that best explained our data was scenario 2,
The absence of population structuring was also inferred by the indicating that the giant anteater experienced a reduction in the
spatial analysis in GENELAND (K = 1; Figures 2D,E). Similarly, effective population size in the past. This hypothetical scenario
the multivariate analysis (DAPC) showed a clear overlap among showed a posterior probability of 0.8339 with a posterior error
the sampling sites tested, reinforcing the findings of a single rate of 0.304 (Supplementary Table 5). All our RMAE values
population pattern (Figure 2F). were < 2 (Nr = 0.191, Na = 0.316, and t = 0.293), indicating
The analyses of genetic spatial autocorrelation showed that all parameters estimated were reliable, suggesting a high
no significant autocorrelation between individuals in all confidence for scenario 2 (Figure 3). At this scenario, the effective
measured distances (p ≤ 0.05), even when females and population size Nr and Na had average values of 1,119 (95%
males were separately analyzed (Supplementary Figure 1 CI = 660–2,040) and 6,370 (95% CI = 2,130–9,830), respectively.
and Figures 1A, 2A, 3A). The Mantel test showed no When we applied the model checking (Supplementary Figure 2),
association of genetic variation and geographic distance, we observed that our best scenario has a good fit because
neither considering the total of individuals nor each gender the observed data set appears under the posterior predictive
separately (Supplementary Figure 1 and Figures 1B, 2B, 3B). distribution (Supplementary Figure 3).
Frontiers in Genetics | www.frontiersin.org 5 July 2021 | Volume 12 | Article 669350Barragán-Ruiz et al. Genetic Diversity of Giant Anteater
TABLE 1 | Summary information on the 10 microsatellite loci used in Myrmecophaga tridactyla.
Locus N Na Ae AR Ho He p-values Fis Null alleles PIC M-ratio
4* 107 4 2.06 3.99 0.27 0.51 0.0162 0.47 0.2213 0.42 0.44
7 74 9 6.03 9.00 0.84 0.83 0.4102 0.00 −0.0029 0.81 0.52
13 98 6 3.56 6.00 0.82 0.72 0.9815 −0.13 −0.0734 0.68 0.46
11* 96 8 3.02 7.49 0.64 0.67 0.0087 0.05 0.0145 0.63 0.22
20 97 8 5.56 7.76 0.80 0.82 0.4610 0.02 0.0114 0.80 0.47
A9* 82 5 3.25 4.99 0.56 0.69 0.0052 0.19 0.0844 0.64 0.55
B2 98 3 2.08 3.00 0.61 0.52 0.9745 −0.18 −0.1296 0.46 0.60
E3 99 4 1.61 3.75 0.37 0.38 0.1298 0.01 −0.0180 0.35 0.26
G38 83 3 1.80 3.00 0.46 0.44 0.0001 −0.03 −0.0275 0.37 0.08
H5* 79 5 2.04 5.00 0.05 0.51 0.0000 0.90 0.3715 0.47 0.45
Mean 91 5.5 3.10 5.40 0.54 0.61 – 0.13 – 0.56 –
Loci name, number of individuals (N), number of alleles per locus (Na), effective number of alleles (Ae), allelic richness (AR), observed and expected heterozygosity (Ho
and He, respectively), global estimate of Fis , results for the null allele test, polymorphic information content (PIC), and the Garza–Williamson index, the number of alleles
ratio to range in allele size (M-ratio). Bold values indicate significative Fis values (≤0.001).
*Loci with Hardy–Weinberg equilibrium (HWE) after Bonferroni correction (p ≤ 0.005).
DISCUSSION He = 0.72, Sartori et al., 2020; Ho = 0.60, He = 0.63, Garcia
et al., 2005), suggesting that these can represent the mean values
Contrary to our expectation, all clustering analyses concordantly of genetic diversity along the distribution of the giant anteater.
showed no population structuring in the giant anteater across It is well known that genetic diversity has important ecological
the large area studied. It is suggested that gene flow restriction consequences in natural populations, including the maintenance
among populations does not occur even considering that our of evolutionary potential and the individual ability to survive
sampling sites encompass different landscapes with high level in response to threats as environmental changes and disease
of anthropic modifications. Therefore, this result must be taken (Hughes et al., 2008). The combination of increased genetic drift,
with caution, since the studied area is under human-induced inbreeding, and restricted gene flow may substantially reduce
modification pressure, which can promote changes in the gene the genetic variation of populations (Schlaepfer et al., 2018;
flow in long term. Lino et al., 2019).
It is well known the giant anteater demonstrates different Lower genetic diversity has already been described in a small
ranges of movement throughout the Pantanal landscape from anteater population inhabiting a protected area (Ho = 0.059,
1 km/day (Medri and Mourão, 2005) to 8 km/day in the He = 0.482), and it was associated with intense population
Cerrado Biome (Bertassoni, 2010). It is likely that the absence reduction after recurrent fire events, resulting in inbreeding
of population structuring observed can be explained by this life within the remaining individuals (Collevatti et al., 2007). An
trait and the biology of the species. The giant anteater has been increased degree of homozygosity may cause the expression of
observed living from highly conserved areas to anthropogenic deleterious recessive alleles, which can decrease individual fitness
areas, such as agricultural fields and wood plantations of (Reed and Frankham, 2003). Our results found a significant
Pinus sp., Acacia sp., and Eucalyptus sp. (Miranda, 2004; inbreeding coefficient value (Fis = 0.13; p < 0.001) within the
Braga, 2010; Vynne et al., 2011) and is therefore considered a studied population, and it seems not biased either by a kinship
species associated with several environments. In general, species effect. Since the r values found were very low, it is an indicative of
associated with non-forested habitats may more easily cross a low level of relatedness among the individuals.
the matrix and move between fragments, thereby reducing Besides the potential inbreeding detected, we also found a
the negative effects of fragmentation-like genetic differentiation smaller mean number of effective alleles (Ae = 3.10) compared to
(Schlaepfer et al., 2018). The absence of spatial correlation the mean allele richness (Na = 5.5), suggesting that fewer alleles
between individuals, even when both sexes were separately are contributing to maintain the current genetic diversity. These
analyzed, suggests that both sexes are similarly moving across results can be a consequence of a Ne that is not large enough to
the landscape. However, this capacity for moving across different retain all alleles in high frequency, since large Ne is necessary to
landscape elements can make the individuals vulnerable to retain more genetic diversity (Kimura and Crow, 1964).
important threats for the species, such as human conflict and The effective population size is an important factor that
roadkill (Ng et al., 2008), which can explain why 60% of contributes to genetic variability maintenance because both
our sampled individuals were road-killed animals, promoting a heterozygosity and number of alleles are less impacted in
significant loss of individuals in long term. populations with large effective size (Kimura and Crow, 1964;
Moderate levels of genetic diversity (Ho = 0.54; He = 0.61) Reed and Frankham, 2003). It is known that effective population
were observed in this large and single giant anteater population size varies with the generation time (Frankham, 1997; Reed
inhabiting the studied area. Similar values were previously and Frankham, 2003). A long generation time and lifespan
reported for other local populations studied (Ho = 0.68, can act as an intrinsic buffer against loss of genetic diversity
Frontiers in Genetics | www.frontiersin.org 6 July 2021 | Volume 12 | Article 669350Barragán-Ruiz et al. Genetic Diversity of Giant Anteater FIGURE 2 | Genetic structure of 107 Myrmecophaga tridactyla specimens assessed by different approaches based on 10 microsatellite loci. (A) Population structure results (K = 2) based on the 1K statistic (Evanno et al., 2005). (B) Graphical representation of K = 2 from structure results based on 1K statistic (Evanno et al., 2005). Each vertical bar represents an individual and each color (light gray and dark gray) represents the posterior probability of the individuals belonging to that cluster. (C) Graphical representation of K = 1 from structure result based on the Ln value (Pritchard et al., 2000). (D) The number of clustering among the chain from GENELAND. (E) Plot of the number of populations simulated from the posterior distribution with GENELAND, indicating K = 1 as the most frequent result. (F) Results of the discriminant analysis of principal components (DAPC) showing the scatterplot of the first two principal components and DA% for each axis. (Hailer et al., 2006), resulting in a delayed detection of genetic studied area, a relatively high effective population size potentially diversity loss. The giant anteater lives from 20 to 30 years in extant in the studied region, highlighting the importance of this captivity and has a long generation time (Nowak, 1991) and population for the conservation of giant anteaters. However, generation time (Desbiez et al., 2020); both biological features our demographic analyses suggested that the current giant can explain a putative slow reduction in the genetic diversity anteater population has already suffered a recent bottleneck. found here. In species showing 1-year generation time, it is Furthermore, the demographic history of the giant anteater believed that Ne = 50 is enough to avoid the negative effects population, inferred by a scenario test model and for the of inbreeding in the short term and Ne = 500 to prevent first time addressed here, also found a past reduction of the loss of variability by genetic drift in long term (Franklin, 1980; population size. Our inference from ABC analysis predicted past Soulé and Wilcox, 1980). population size reduction. An effective population size Ne ≥ 1,000 was indicated for Overall, our results showed a single and large population of retaining the evolutionary potential for fitness in perpetuity giant anteaters inhabiting the southern edge of its geographical (Frankham, 2015). Our results found Ne = 375 individuals in the distribution, therefore already presenting negative genetic Frontiers in Genetics | www.frontiersin.org 7 July 2021 | Volume 12 | Article 669350
Barragán-Ruiz et al.                                                                                                                   Genetic Diversity of Giant Anteater

  FIGURE 3 | Possible demographic history scenarios for the Myrmecophaga tridactyla population. (A) Representation of three demographic scenarios evaluated by
  DIYABC. Legend: the areas of the figures represent changes in population size through time. Effective population size (Ne) is represented by Na (ancestral effective
  population size) and Nr (recent effective population size). The time, t, in number of generations. Scenario 1 without a change in an ancestral population experiencing
  (null hypothesis); scenario 2 with a change in Na at time t, representing a bottleneck event, Nr < Nr; and scenario 3 with a change in Ne at time t, representing an
  expansion event, Nr > Na. (B) Posterior probabilities of the three scenarios obtained by logistic regression of 1% of the closest simulated datasets. The most
  probable demographic scenario for M. tridactyla population was a historical bottleneck. Posterior probability of each scenario in the y- and x-axes indicates the
  number of simulated data closest to observed data. (C) Graphic of principal components analysis (PCA) generated in DIYABC displaying the fit between scenarios
  simulated and our dataset.

  FIGURE 4 | Predicted genetic diversity in Myrmecophaga tridactyla over next 100 years when retained 100% (blue), 75% (red), 50% (gray), 25% (yellow), and 10%
  (green) of the current effective population size using BOTTLESIM program. (A) Number of alleles. (B) Number of effective alleles. (C) Expected heterozygosity.
  (D) Observed heterozygosity.

signals, as bottleneck and inbreeding, potentially caused by                            CONSERVATION IMPLICATIONS
impacts of the increased human activities in the region. Of note,
this work represents the study with the largest microsatellite set                      For hundreds of years, the continuous impact of humans has been
used in a Myrmecophagidae species, with a high polymorphic                              noticed in a decrease in the abundance and richness of organisms
information content (PIC > 0.5), and the largest population                             (Galetti and Dirzo, 2013). Our results suggest that the genetic
genetic study thus far carried out in giant anteater, considering                       consequences of these actions threaten the long-term population
both the sampling area and number of individuals analyzed,                              viability of M. tridactyla in the next 100 years. Despite the wide
reinforcing the importance of these results.                                            distribution of the species and the constant reports of threats

Frontiers in Genetics | www.frontiersin.org                                         8                                              July 2021 | Volume 12 | Article 669350
Barragán-Ruiz et al.                                                                                                                          Genetic Diversity of Giant Anteater

for this animal, populations of giant anteater have been poorly                               FUNDING
studied in Brazil. It is important to highlight that conservation
strategies should be urgently adopted to guarantee the species                                This study was funded by the Conselho Nacional de
persistence. These strategies should be focused on reducing giant                             Desenvolvimento Científico e Tecnológico (CNPq, 308385/2014-
anteater mortality, by reducing the impacts such as road kills,                               4 and 303524/2019-7), Coordenação de Aperfeiçoamento de
hunting, and habitat loss (Bertassoni, 2012; Ascensão et al., 2016,                           Pessoal de Nível Superior (CAPES, 88882.426405/2019-01),
2019). Effective strategies would avoid population size reduction                             Fundação de Amparo à Pesquisa do Estado de São Paulo
and ensure the maintenance of genetic diversity and the long-                                 (FAPESP, 2013/24453-4), Natural Environment Research Council
term viability of its populations that have been suffering mainly                             (NERC, NE/S011811/1), and Idea Wild BARRBRAZ0518.
for the habitat loss.

                                                                                              ACKNOWLEDGMENTS
DATA AVAILABILITY STATEMENT
                                                                                              PG thanks Conselho Nacional de Desenvolvimento Científico e
The raw data supporting the conclusions of this article will be                               Tecnológico (CNPq, 303524/2019-7). BS received scholarship
made available by the authors, without undue reservation.                                     from FAPESP (2013/24453-4) and Natural Environment
                                                                                              Research Council (NERC, NE/S011811/1). CB-R thanks
                                                                                              Coordenação de Aperfeiçoamento de Pessoal de Nível Superior
ETHICS STATEMENT                                                                              (CAPES, 88882.426405/2019-01) and IdeaWild for grant the
                                                                                              Geneious software license. We thank the giant Anteaters &
The animal study was reviewed and approved by the Ethics                                      Highways Project, funded by Foundation Segre and 20 other
Committee on the Animal Experimentation (CEUA/UFSCar)                                         institutions, mostly zoos in North America and Europe listed
protocol number 1584280817.                                                                   at http://www.giantanteater.org/. We are also thankful for the
                                                                                              constructive comments of the two reviewers who improved the
                                                                                              manuscript for publication.
AUTHOR CONTRIBUTIONS
CB-R, PG, and AD designed research and data acquisition. CB-R,                                SUPPLEMENTARY MATERIAL
RS-S, BS, and PG contributed to new reagents or analytical tools.
CB-R, RS-S, BS, AD, and PG analyzed the data, wrote, and                                      The Supplementary Material for this article can be found
review the manuscript. All authors contributed to the article and                             online at: https://www.frontiersin.org/articles/10.3389/fgene.
approved the submitted version.                                                               2021.669350/full#supplementary-material

REFERENCES                                                                                    Braga, G. F. (2010). Ecologia e Comportamento de Tamanduá-Bandeira. Brazil:
                                                                                                 Universidade Federal do Paraná.
Ascensão, F., Mata, C., Malo, J. E., Ruiz-Capillas, P., Silva, C., Silva, A. P., et al.       Clozato, C. L., Miranda, F. R., Lara-Ruiz, P., Collevatti, R. G., and Santos,
   (2016). Disentangle the causes of the road barrier effect in small mammals                    F. R. (2017). Population structure and genetic diversity of the giant anteater
   through genetic patterns. PLoS One 11, 1–23. doi: 10.1371/journal.pone.                       (Myrmecophaga tridactyla: myrmecophagidae. Pilosa) in Brazil. Genet. Mol.
   0151500                                                                                       Biol. 40, 50–60. doi: 10.1590/1678-4685-gmb-2016-0104
Ascensão, F., Yogui, D., Alves, M., Medici, E. P., and Desbiez, A. (2019). Predicting         Clozato, C. L., Moraes-Barros, N., Santos, F. R. F. R., and Morgante, J. S. J. S.
   spatiotemporal patterns of road mortality for medium-large mammals.                           (2014). Historical and non-invasive samples: a study case of genotyping
   J. Environ. Manage. 248:109320. doi: 10.1016/j.jenvman.2019.109320                            errors in newly isolated microsatellites for the lesser anteater (Tamandua
Ball, M. C., Finnegan, L., Manseau, M., and Wilson, P. (2010). Integrating multiple              tetradactyla L. Pilosa). Mol. Ecol. Resour. 14, 531–540. doi: 10.1111/1755-0998.
   analytical approaches to spatially delineate and characterize genetic population              12214
   structure: an application to boreal caribou (Rangifer tarandus caribou) in                 Collevatti, R. G., Leite, K. C. E., de Miranda, G. H. B., and Rodrigues, F. H. G.
   central Canada. Conserv. Genet. 11, 2131–2143. doi: 10.1007/s10592-010-                       (2007). Evidence of high inbreeding in a population of the endangered
   0099-3                                                                                        giant anteater, Myrmecophaga tridactyla (Myrmecophagidae), from Emas
Barragán-Ruiz, C. E., Paviotti-Fischer, E., Rodríguez-Castro, K. G., Desbiez, A. L. J.,          National Park, Brazil. Genet. Mol. Biol. 30, 112–120. doi: 10.1590/S1415-
   and Galetti, P. M. (2020). Molecular sexing of Xenarthra: a tool for genetic and              47572007000100020
   ecological studies. Conserv. Genet. Resour. 13, 41–45. doi: 10.1007/s12686-020-            Cornuet, J., Ravigné, V., and Estoup, A. (2010). Inference on population history
   01168-2                                                                                       and model checking using DNA sequence and microsatellite data with the
Bertassoni, A. (2010). Behavioral repertoire of giant anteater (Myrmecophaga                     software DIYABC (v1.0). BMC Bioinformatics 11:401. doi: 10.1186/1471-2105-
   tridactyla, Linnaeus 1758) in nature at Serra da Canastra National Park, MG                   11-401
   and in captivity at Curitiba Zoo, PR, Brazil. Rev. Etol. 9, 21–30. doi: 10.5537/           Cornuet, J. M., and Luikart, G. (1996). Description and power analysis of two tests
   020.015.0108                                                                                  for detecting recent population bottlenecks from allele frequency data. Genetics
Bertassoni, A. (2012). Perception and Popular Reports About Giant Anteaters                      144, 2001–2014. doi: 10.1093/genetics/144.4.2001
   (Myrmecophaga tridactyla Linnaeus, 1758) by Two Brazilian Traditional                      Cornuet, J.-M., Pudlo, P., Veyssier, J., Dehne-Garcia, A., Gautier, M., Leblois,
   Communities. Edentata 13, 10–17. doi: 10.5537/020.013.0113                                    R., et al. (2014). DIYABC v2.0: a software to make approximate Bayesian
Bertassoni, A., Miranda, F., and Abba, A. (2014). Myrmecophaga tridactyla. IUCN                  computation inferences about population history using single nucleotide
   Red List Threat. Species 2014 e. T14224A47441961. United Kingdom: IUCN Red                    polymorphism, DNA sequence and microsatellite data. Bioinformatics 30,
   List.                                                                                         1187–1189. doi: 10.1093/bioinformatics/btt763

Frontiers in Genetics | www.frontiersin.org                                               9                                               July 2021 | Volume 12 | Article 669350
Barragán-Ruiz et al. Genetic Diversity of Giant Anteater Desbiez, A. L. J., Bertassoni, A., and Traylor-Holzer, K. (2020). Population viability Jombart, T., Devillard, S., and Balloux, F. (2010). Discriminant analysis of analysis as a tool for giant anteater conservation. Perspect. Ecol. Conserv. 3, principal components: a new method for the analysis of genetically structured 45–46. doi: 10.1016/j.pecon.2020.04.004 populations. BMC Genet. 11:94. doi: 10.1186/1471-2156-11-94 Do, C., Waples, R. S., Peel, D., Macbeth, G. M., and Tillett, B. J. (2013). NeEstimator Kearse, M., Moir, R., Wilson, A., Stones-Havas, S., Cheung, M., Sturrock, S., v2.0: re-implementation of software for the estimation of contemporary et al. (2012). Geneious Basic: an integrated and extendable desktop software effective population size. Mol. Ecol. Resour. 14, 209–214. doi: 10.1111/1755- platform for the organization and analysis of sequence data. Bioinformatics 28, 0998.12157 1647–1649. doi: 10.1093/bioinformatics/bts199 Earl, D. A., and vonHoldt, B. M. (2012). STRUCTURE HARVESTER: a website and Kimura, M., and Crow, J. F. (1964). The number of alleles that can be maintained program for visualizing STRUCTURE output and implementing the Evanno in a finite population. Genetics 49, 725–738. doi: 10.1093/genetics/49. method. Conserv. Genet. Resour. 4, 359–361. doi: 10.1007/s12686-011-9548-7 4.725 Eisenberg, J. F., and Redford, K. H. (1999). Mammals of the neotropics, the central Kuo, C. H., and Janzen, F. J. (2003). BOTTLESIM: a bottleneck simulation program neotropics Volume: 3. Chicago: University of Chicago Press. for long-lived species with overlapping generations. Mol. Ecol. Notes 3, 669–673. Evanno, G., Regnaut, S., and Goudet, J. (2005). Detecting the number of clusters of doi: 10.1046/j.1471-8286.2003.00532.x individuals using the software STRUCTURE: a simulation study. Mol. Ecol. 14, Leberg, P. L. (2002). Estimating allelic richness: effects of sample size 2611–2620. doi: 10.1111/j.1365-294X.2005.02553.x and bottlenecks. Mol. Ecol. 11, 2445–2449. doi: 10.1046/j.1365-294X.2002. Excoffier, L., and Lischer, H. E. L. (2010). Arlequin suite ver 3.5: a new series of 01612.x programs to perform population genetics analyses under Linux and Windows. Lino, A., Fonseca, C., Rojas, D., Fischer, E., and Ramos, M. J. P. (2019). A meta- Mol. Ecol. Resour. 10, 564–567. doi: 10.1111/j.1755-0998.2010.02847.x anaçusis of the effects of habitat loss and fragmentation on genetic diversity in Frankham, R. (1997). Do island populations have less genetic variation than mammals. Mamm. Biol. 94, 69–76. doi: 10.1016/j.mambio.2018.09.006 mainland populations? Heredity. 78, 311–327. doi: 10.1038/sj.hdy.6880980 Luikart, G., and Cornuet, J.-M. (1998). Empirical Evaluation of a Test for Frankham, R. (2015). Genetic rescue of small inbred populations: meta-analysis Identifying Allele Recently Data Bottlenecked Populations from Frequency. Soc. reveals large and consistent benefits of gene flow. Mol. Ecol. 24, 2610–2618. Conserv. Biol. 12, 228–237. doi: 10.1111/j.1523-1739.1998.96388.x doi: 10.1111/mec.13139 Luikart, P. S., and Cornuet, J. M. (1999). BOTTLENECK: a computer program for Franklin, I. R. (1980). “Evolutionary change in small populations,” in Conservation detecting recent reduction in the effective population size using allele frequency Biology - An evolutionary-ecological perspective, eds M. E. Soule and B. A. data. J. Hered. 90, 502–503. doi: 10.1093/jhered/90.4.502 Wilcox (Massachusetts: Sinauer Associates), 135-149. Lynch, M., and Ritland, K. (1999). Estimation of pairwise relatedness with Galetti, M., and Dirzo, R. (2013). Ecological and evolutionary consequences of molecular markers. Genetics 152, 1753–1766. doi: 10.1093/genetics/152.4.1753 living in a defaunated world. Biol. Conserv. 163, 1–6. doi: 10.1016/j.biocon.2013. Mantel, N. (1967). The detection of Disease Clustering and a Generalized 04.020 Regression Approach. Cancer Res. 27, 209–220. Garcia, J. E., Vilas Boas, L. A., Lemos, M. V. F. F., De Macedo Lemos, E. G., McManus, J. S., Dalton, D. L., Kotzé, A., Smuts, B., Dickman, A., Marshal, J. P., and Contel, E. P. B. B. (2005). Identification of microsatellite DNA markers et al. (2015). Gene flow and population structure of a solitary top carnivore for the giant anteater Myrmecophaga tridactyla. J. Hered. 96, 600–602. doi: in a human-dominated landscape. Ecol. Evol. 5, 335–344. doi: 10.1002/ece3. 10.1093/jhered/esi089 1322 Garza, J. C., and Williamson, E. G. (2001). Detection of reduction in population McNab, B. K. (1984). Physiological convergence amongst ant-eating and termite- size using data from microsatellite loci. Mol. Ecol. 10, 305–318. doi: 10.1046/j. eating mammals. J. Zool. 203, 485–510. doi: 10.1111/j.1469-7998.1984.tb 1365-294x.2001.01190.x 02345.x Goudet, J. (1995). FSTAT (version 1.2): a computer program to calculate Medri, ÍM., and Mourão, G. (2005). Home range of giant anteaters (Myrmecophaga F-statistics. J. Hered. 86, 485–486. doi: 10.1093/oxfordjournals.jhered.a1 tridactyla) in the Pantanal wetland, Brazil. J. Zool. 266, 365–375. doi: 10.1017/ 11627 S0952836905007004 Grilo, C., Coimbra, M. R., Cerqueira, R. C., Barbosa, P., Dornas, R. A. P., Gonçalves, Miranda, F., Chiarello, A., Rohe, F., Goss Braga, F., De Miranda, G., and Braga, L. O., et al. (2019). Brazil Road-Kill: a Dataset of Wildlife Terrestrial Vertebrate G. (2018). Myrmecophaga tridactyla Linnaeus, 1758, in Instituto Chico Mendes Road-Kills. Bull. Ecol. Soc. Am. 100:e01449. doi: 10.1002/bes2.1449 de Conservação da Biodiversidade. org. Livro Vermelho da Fauna Brasileira Guillot, G., Mortier, F., and Estoup, A. (2005). GENELAND: a computer package Ameaçada de Extinção: Volume II - Mamíferos. Brasília: ICMBio, 40–47. for landscape genetics. Mol. Ecol. Notes 5, 712–715. doi: 10.1111/j.1471-8286. Miranda, F., Chiarello, A. G., Rohe, F., and Mourão, G. (2015). Avaliação do Risco 2005.01031.x de Extinção dos Xenartros Brasileiros. Brazil: ICMBio. Guol, S. W., and Thompson, E. A. (1992). Performing the Exact Test of Hardy- Miranda, G. H. B. (2004). Ecologia e conservação do Tamanduá-bandeira Weinberg Proportion for Multiple Alleles. Biometrics 48, 361–372. doi: 10. (Myrmecophaga tridactyla, Linnaeus, 1758) no Parque Nacional das Emas. Tese 2307/2532296 (Doutorado em Ecologia). Tese (Doutorado em Ecol). Brazil: Universidade de Haag, T., Santos, A. S., Sana, D. A., Morato, R. G., Cullen, L., Crawshaw, P. G., et al. brasília, 73. (2010). The effect of habitat fragmentation on the genetic structure of a top Ng, J. W., Nielson, C., and Clair, C. C. (2008). Landscape and traffic factors predator: loss of diversity and high differentiation among remnant populations influencing deer – vehicle collisions in an urban enviroment. Hum. Wildl. Confl. of Atlantic Forest jaguars (Panthera onca). Mol. Ecol. 19, 4906–4921. doi: 10. 2, 34–47. 1111/j.1365-294X.2010.04856.x Nowak, R. M. (1991). Walker’s Mammals of the World. Johns Hopkins Haddad, N. M., Brudvig, L. A., Clobert, J., Davies, K. F., Gonzalez, A., Holt, R. D., University Press. Available online at: https://books.google.com.br/books?id= et al. (2015). Habitat fragmentation and its lasting impact on Earth’s ecosystems. ZmMvnoyjyYMC Sci. Adv. 1:e1500052. doi: 10.1126/sciadv.1500052 Oliveira, R. F., and Hannibal, W. (2017). Effects of patch attributes on the richness Hailer, F., Helander, B., Folkestad, A. O., Ganusevich, S. A., Garstad, S., Hauff, of medium and large sized mammals in fragmented Semi-Deciduous Forest. P., et al. (2006). Bottlenecked but long-lived: high genetic diversity retained Mastozool. Neotrop. 24, 401–408. in white-tailed eagles upon recovery from population decline. Biol. Lett. 2, Peakall, R., and Smouse, P. E. (2012). GenALEx 6.5: genetic analysis in 316–319. doi: 10.1098/rsbl.2006.0453 Excel. Population genetic software for teaching and research-an update. Hughes, A. R., Inouye, B. D., Johnson, M. T. J., Underwood, N., and Vellend, M. Bioinformatics 28, 2537–2539. doi: 10.1093/bioinformatics/bts460 (2008). Ecological consequences of genetic diversity. Ecol. Lett. 11, 609–623. Pritchard, J. K., Stephens, M., and Donnelly, P. (2000). Inference of population doi: 10.1111/j.1461-0248.2008.01179.x structure using multilocus genotype data. Genetics 155, 945–959. doi: 10.1111/ Brazilian Institute of Geography and Statistics (IBGE) (2020). IBGE. Available j.1471-8286.2007.01758.x online at: https://cidades.ibge.gov.br/brasil/ms/panorama (Accessed May 10, Queller, D. C., and Goodnight, K. F. (1989). Estimating Relatedness Using Genetic 2020). Markers. Evolution 43:258. doi: 10.2307/2409206 Jombart, T. (2008). Adegenet: a R package for the multivariate analysis of genetic R Core Team (2017) R: A Language and Environment for Statistical Computing. markers. Bioinformatics 24, 1403–1405. doi: 10.1093/bioinformatics/btn129 Available online at: https://www.R-project.org/ Frontiers in Genetics | www.frontiersin.org 10 July 2021 | Volume 12 | Article 669350
Barragán-Ruiz et al.                                                                                                                              Genetic Diversity of Giant Anteater

Raymond, M., and Rousset, F. (1994). GENEPOP (Version 1.2): population                          Storfer, A., Murphy, M. A., Spear, S. F., Holderegger, R., and Waits, L. P. (2010).
    Genetics Software for Exact Tests and Ecumenicism. J. Hered. 68, 248–249.                      Landscape genetics: where are we now?. Mol. Ecol. 19, 3496–3514. doi: 10.1111/
    doi: 10.1093/oxfordjournals.jhered.a111573                                                     j.1365-294X.2010.04691.x
Reed, D. H., and Frankham, R. (2003). Correlation between Fitness and Genetic                   Van Oosterhout, C., Hutchinson, W. F., Wills, D. P. M., and Shipley, P. (2004).
    Diversity. Conserv. Biol. 17, 230–237. doi: 10.1046/j.1523-1739.2003.01236.x                   MICRO-CHECKER: software for identifying and correcting genotyping errors
Rice, W. E. R. (1989). Analyzing tables of statistical tests. Evolution 43, 223–225.               in microsatellite data. Mol. Ecol. Notes 4, 535–538. doi: 10.1111/j.1471-8286.
    doi: 10.2307/2409177                                                                           2004.00684.x
Ritland, K. (1996). Estimators for pairwise relatedness and individual inbreeding               Vynne, C., Keim, J. L., Machado, R. B., Marinho-Filho, J., Silveira, L., Groom,
    coefficients. Genet. Res. 67, 175–185. doi: 10.1017/s0016672300033620                          M. J., et al. (2011). Resource selection and its implications for wide-ranging
Sambrook, J., Fritsch, E. F., and Maniatis, T. (1989). Molecular Cloning: A                        mammals of the Brazilian Cerrado. PLoS One 6:e28939. doi: 10.1371/journal.
    Laboratory Manual, Volume 1. New York: Cold Spring Harbor Laboratory.                          pone.0028939
Sartori, R. Q., Lopes, A. G., Aires, L. P. N., Bianchi, R., de, C., de Mattos, C. C. B.,        Waples, R. S., and Do, C. (2010). Linkage disequilibrium estimates of contemporary
    et al. (2020). ). Identifying Priority Giant Anteater (Myrmecophaga tridactyla)                N e using highly variable genetic markers: a largely untapped resource for
    Populations for Conservation in São Paulo State, Brazil. Ecol. Evol. 11, 700–713.              applied conservation and evolution. Evol. Appl. 3, 244–262. doi: 10.1111/j.1752-
    doi: 10.1002/ece3.6809                                                                         4571.2009.00104.x
Schlaepfer, D. R., Braschler, B., Rusterholz, H.-P., and Baur, B. (2018). Genetic               Weir, B. S., and Cockerham, C. C. (1984). Estimating F-statistics for the analysis of
    effects of anthropogenic habitat fragmentation on remnant animal and plant                     population structure. Evolution. 38:1358. doi: 10.2307/2408641
    populations: a meta-analysis. Ecosphere 9:e02488. doi: 10.1002/ecs2.2488
Schuelke, M. (2000). An economic method for the fluorescent labeling of PCR                     Conflict of Interest: The authors declare that the research was conducted in the
    fragments A poor man ’ s approach to genotyping for research and high-                      absence of any commercial or financial relationships that could be construed as a
    throughput diagnostics. Nat. Biotechnol. 18, 233–234. doi: 10.1038/72708                    potential conflict of interest.
Slate, J., Marshall, T., and Pemberton, J. (2000). A retrospective assessment of the
    accuracy of the paternity inference program Cervus. Mol. Ecol. 9, 801–808.                  Copyright © 2021 Barragán-Ruiz, Silva-Santos, Saranholi, Desbiez and Galetti. This
    doi: 10.1046/j.1365-294x.2000.00930.x                                                       is an open-access article distributed under the terms of the Creative Commons
Smouse, R. P. P. E., and Peakall, R. (2012). GenAlEx 6.5: genetic analysis in                   Attribution License (CC BY). The use, distribution or reproduction in other forums
    Excel. Population genetic software for teaching and research—an update.                     is permitted, provided the original author(s) and the copyright owner(s) are credited
    Bioinformatics 28, 2537–2539.                                                               and that the original publication in this journal is cited, in accordance with accepted
Soulé, M. E., and Wilcox, B. A. (1980). Conservation Biology: An Evolutionary-                  academic practice. No use, distribution or reproduction is permitted which does not
    ecological Perspective. Oxford: Oxford University Press.                                    comply with these terms.

Frontiers in Genetics | www.frontiersin.org                                                11                                                 July 2021 | Volume 12 | Article 669350
You can also read