Impact of Inflation and the Current Economy on Valuations
←
→
Page content transcription
If your browser does not render page correctly, please read the page content below

7/25/2022

                                                         50th Annual Wichita Property Tax
                                                                   Conference

                                                               Impact of Inflation and
                                                                the Current Economy
                                                                    on Valuations                                                                                 July 2022

“Impact of Inflation and the Current Economy on Valuations”                                                                                                                1

• Roger Grabowski,
  FASA
 Roger Grabowski, FASA
                                                       Roger J. Grabowski, FASA, is a Managing Director with Kroll LLC and an Accredited Senior Appraiser and
                                                       Fellow (FASA) of the American Society of Appraisers (ASA) (their highest designation), Business Valuation.
                                                       He was formerly Managing Director of the Standard & Poor's Corporate Value Consulting practice, a partner
                                                       of PricewaterhouseCoopers LLP and one of its predecessor firms, Price Waterhouse (where he founded its
                                                       U.S. Valuation Services practice and managed the real estate appraisal practice).
                                                       He has directed valuations of businesses, interests in businesses, intellectual property, intangible assets, real
                                                       property and machinery and equipment. Roger has been recognized in various courts as an expert on
                                                       matters of solvency, the value of closely held businesses and business interests, valuation and amortization
Managing Director                                      of intangible assets and other valuation issues. His testimony in U.S. District Court was referenced in the U.S.
                                                       Supreme Court opinion decided in his client's favor in the landmark Newark Morning Ledger case.
Valuation Advisory Services
Chicago, IL                                            Roger is contributing author and co‐editor of Shannon Pratt’s Valuing a Business: The Analysis and Appraisal
roger.grabowski@kroll.com                              of Closely Held Companies, 6th ed. (McGraw‐Hill, 2022); contributing author to Lost Profits Damages:
                                                       Principles, Methods and Applications, 2nd ed. (Valuation Products and Services, 2022); co‐author Valuation
BBA - Bachelor of Business Administration              Handbook‐International Guide to Cost of Capital: 2021 Summary Edition (CFA Institute Research Foundation
in Finance                                             Books, 2021); co‐author with Shannon Pratt of Cost of Capital: Applications and Examples, 5th ed. (John
                                                       Wiley & Sons, 2014), The Lawyer's Guide to Cost of Capital (ABA, 2014), and Cost of Capital in Litigation:
                                                       Applications and Examples (John Wiley & Sons, 2010); author of numerous papers including: “Comparing
ABD- All Doctoral Work Except
Dissertation in Finance                                Growth Rates Used in Discounted Cash Flow Valuations,” Business Valuation Review (40(1) 2021).
                                                       Roger teaches courses for the American Society of Appraisers and lectures for professional associations
                                                       around the world.

“Impact of Inflation and the Current Economy on Valuations”                                                                                                                2

                                                                                                                                                                                       1
7/25/2022

    Disclaimer
    Any positions presented in this session are those of the panelists and do not represent the official position of Kroll, LLC. This material
    is offered for educational purposes with the understanding that neither the authors nor Kroll, LLC or its affiliates are engaged in
    rendering legal, accounting or any other professional service through presentation of this material.

    The information presented in this session has been obtained with the greatest of care from sources believed to be reliable, but is not
    guaranteed to be complete, accurate or timely. The authors and Kroll, LLC or its affiliates expressly disclaim any liability, including
    incidental or consequential damages, arising from the use of this material or any errors or omissions that may be contained in it.

       Name Change to Kroll
       As of January 1, 2022, Duff & Phelps, LLC has become, and will henceforth be known as Kroll, LLC.

“Impact of Inflation and the Current Economy on Valuations”                                                                                   3

        Current Economic Environment
        How did we get there?

“Impact of Inflation and the Current Economy on Valuations”                                                                                   4

                                                                                                                                                          2
7/25/2022

Where are we?
• The financial markets started 2022 with misalignments, incongruities, and divergences seeking
  normalization. The first six months of the year have shown investors and others affected by the financial
  markets just how swiftly markets can shift when conditions are vulnerable.
• A "rolling crash" has rippled into almost every market sector. The benchmark S&P 500 Index is down about
  20% from its early January peak. And the tech‐heavy Nasdaq Composite Index is down nearly 30% from its
  November 2021 peak.
• Why? Inflation‐‐ a measure of the change in purchasing power over time.
        Implicit in this definition are two key components:
                   • What prices are being measured?
                            Consumer prices OR consumer prices excluding food and energy, OR producer prices, OR
                            GDP price increases?
           • In which country are we measuring inflation?
• The Fed was late to exit ZIRP (zero interest rate policy)/QE (quantitative easing), so they have had to
  become more aggressive to address inflation. The consequence has been one of the most dramatic shifts
  in interest rates and bond yields in many decades.

“Impact of Inflation and the Current Economy on Valuations”                                                        5

Understanding inflation
Inflation is caused by the failure of aggregate supply to increase to meet increasers in aggregate demand‐‐
too much money chasing too few goods
• Even if demand increases, inflationary pressure may be countered by high unemployment (reducing
  wage pressure) or excess production capacity (reducing cost pressure)– these factors are important
  in dampening inflation pressure during periods of recession.
• “Structural changes” can reduce inflationary pressure. For example, following the period of extreme
  inflation in the U.S. during 1965‐1980, manufacturers in the U.S. moved aggressively to outsource
  production to low‐cost China. There goal was to better control and reduce operating costs.
• Innovation can dampen inflationary pressures. For example, the innovations in semi‐conductor
  capacity and semi‐conductor production have allowed for decreases in the cost of computing power.
  Substituting electric arc furnaces for coke fired blast furnaces, reduced the cost of producing a ton of
  steel.
• Changes in consumer/investor behavior can dampen inflationary pressures. For example, following the
  spiking of gasoline prices in 1973 and again in 1980 in the U.S., energy efficient cars made in Japan
  became popular substitutes for Detroit manufactured cars. These imports were priced lower than U.S.
  cars and worked to limit increases in U.S. auto price increases.

“Impact of Inflation and the Current Economy on Valuations”                                                        6

                                                                                                                               3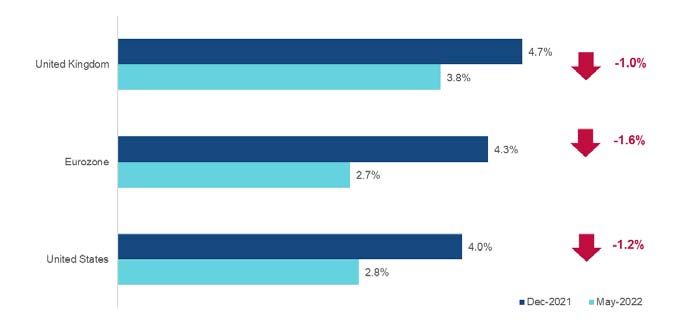
7/25/2022

Measuring inflation – not so simple or accurate
• Measuring the market “basket”: U.S. Bureau of Labor Statistics tries to get the basket of goods and
  services right, there are two fundamental problems: (1) the basket varies widely across consumers and
  identifying the representative consumer is inherently subjective; (2) the basket is not stable over time as
  consumers adjust to changing tastes and prices to alter what and how much they consume of different
  goods and services.
• Measuring the prices of goods and services: Even if you had consensus on the market basket, the prices for
    goods and services have to be estimated ‐ U.S. Bureau of Labor Statistics uses sampling techniques to
    obtain prices of goods and service from sellers, and double check them against consumer
    expenditures. But these are only samples.
• Adjusting for seasonal patterns: Some goods and services with pronounced seasonal patterns in prices.
    and U.S. Bureau of Labor Statistics tries to control for the seasonality when measuring changes in pricing
    power (i.e., estimate change in prices in excess of seasonal increase).

“Impact of Inflation and the Current Economy on Valuations”                                                      7

Why are we where we are?
“The current inflation episode is just the kind of event that the fiscal theory of
the price level can easily describe. It’s simple. The US government printed up
about $3 trillion of money and sent people checks. It borrowed an additional
$2 trillion of money and sent people more checks.”
John H. Cochrane, Senior Fellow, Hoover Institution, Stanford University

“Impact of Inflation and the Current Economy on Valuations”                                                      8

                                                                                                                             4
7/25/2022
Total Assets Held by Major Central Banks Over Time
December 31, 2007 – June 30, 2022
$25.0
% Change USD 24.7 Trillion
After COVID-19
Feb 2020 – Jun
2022
$20.0
Bank of England 77%
Assets Held by Central Banks (in USD trillions)
Bank of Japan 0%
European Central
Bank
82%
$15.0
U.S. Federal
Reserve
114%
$10.0
$5.0
$0.0
Sources: Capital IQ, FRED® Economic Data, Bank of England, Bank of Japan and European Central Bank
“Impact of Inflation and the Current Economy on Valuations” 9
U.S. Fiscal Policy Response to COVID‐19 as a Proportion of Nominal GDP
Size of Combined
COVID-19 Fiscal
Stimulus Packages:
27%
of 2019 Nominal GDP
Sources: U.S. Bureau of Economic Analysis, IMF
“Impact of Inflation and the Current Economy on Valuations” 10
57/25/2022
Global Supply Chain Pressure Index (GSCPI)
January 1998 – May 2022
5.0
4.0
3.0
2.0
1.0
0.0
-1.0
-2.0
May-2022
Jan-1998
Jun-2004
Jan-2005
Jun-2011
Jan-2012
Jun-2018
Jan-2019
Aug-1998
Mar-1999
Oct-1999
May-2000
Jul-2001
Sep-2002
Apr-2003
Aug-2005
Mar-2006
Oct-2006
May-2007
Jul-2008
Sep-2009
Apr-2010
Aug-2012
Mar-2013
Oct-2013
May-2014
Jul-2015
Sep-2016
Apr-2017
Aug-2019
Mar-2020
Oct-2020
May-2021
Dec-2000
Feb-2002
Nov-2003
Dec-2007
Feb-2009
Nov-2010
Dec-2014
Feb-2016
Nov-2017
Dec-2021
Source: Federal Reserve Bank of New York
“Impact of Inflation and the Current Economy on Valuations” 11
Unemployment Rate Holds at 3.6%...
As Job Openings Continue to Increase
428,000
400,000 390,000
April May
328,000 Unemployment Rate 6.1%
3.6% 3.6%
Change from Prior 0.0% 0.0%
Month
Apr-2022 May-2022
Actual Expected
Sources: Non‐farm payrolls by Bureau of Labor Statistics; CNBC “Payroll growth accelerated by 428,000 in April, more than expected as jobs picture stays strong” May 6, 2022; CNBC “Payrolls rose 390,000 in
May, better than expected as companies keep hiring” June 3, 2022
“Impact of Inflation and the Current Economy on Valuations” 12
67/25/2022
Job Openings vs Number of Employed (thousands)
January 2020 to April 2022
25,000
Job Surplus of
20,000 5.45 million
15,000
10,000
5,000
0
Job openings Unemployment
Source: U.S. Bureau of Labor Statistics
“Impact of Inflation and the Current Economy on Valuations” 13
Wages: CPI for All Urban Wage Earners and Clerical Workers
January 1960 – May 2022
Source: FRED, series from U.S. Bureau of Labor Statistics, Consumer Price Index for All Urban Wage Earners and Clerical Workers: All Items in U.S. City Average
“Impact of Inflation and the Current Economy on Valuations” 14
77/25/2022
Inflation (YoY%) over the last 5 1/2‐years
“Impact of Inflation and the Current Economy on Valuations” 15
Percent changes in CPI for All Urban Consumers
(CPI‐U): U.S. city average Source: U.S. Bureau of Labor Statistics, July 13, 2022
Seasonally adjusted changes from preceding month Un-
adjusted
Dec. Jan. Feb. Mar. Apr. May Jun. 12-mos.
2021 2022 2022 2022 2022 2022 2022 ended
Jun. 2022
Energy
0.3 2.9 -0.4 1.8 1.3 3.0 3.5 19.4
services
Electrici
0.5 4.2 -1.1 2.2 0.7 1.3 1.7 13.7
ty
Utility
(piped)
-0.3 -0.5 1.5 0.6 3.1 8.0 8.2 38.4
gas
service
“Impact of Inflation and the Current Economy on Valuations” 16
87/25/2022
12‐Month Percentage Change, CPI vs. Core Inflation (%)
December 1981 to June 2022
9.5%
40.6 years as of June 2022 9.1%
7.5%
39.6 years as of Mar 2022
5.5%
5.9%
3.5%
1.5%
-0.5%
-2.5%
CPI 12-Month % Change Core CPI 12-Month % Change
Source: U.S. Bureau of Labor Statistics, Non‐Seasonally Adjusted series
“Impact of Inflation and the Current Economy on Valuations” 17
12‐Month Percentage Change, Core Inflation by Major
Categories (%)
June 2022
41.6%
Last time Food Prices
were this High
Aug 1978
10.4%
Last time Energy Prices
10.4% were this High
9.1%
Jan 1980
5.9%
41.5%
Inflation (All Items) Core Inflation (Ex-Food Food Energy
& Energy)
Source: U.S. Bureau of Labor Statistics, Non‐Seasonally Adjusted series
“Impact of Inflation and the Current Economy on Valuations” 18
97/25/2022
Food Prices under Strain –
Ukraine Exports as Percent of Global Exports
2021/2022 Marketing Year
Sunflower Meal 58%
Sunflower Oil 47%
Rapeseed 20%
Barley 17%
Corn 14%
Wheat 10%
Sunflower 5%
Source: USDA, updated March 9, 2022
“Impact of Inflation and the Current Economy on Valuations” 19
S&P Global “The Global Food Shock Will Last Years, Not
Months”
June 1, 2022
Executive Summary
Rising food prices and diminishing supplies will last through 2024 and possibly beyond
Fertilizer shortages, export controls, disrupted global trade, and escalating fuel and
transport costs will all exert upward pressure on the cost of staples
The food shock will drag on GDP growth, fiscal performance, and social stability, and
could lead to rating actions, depending on the response by governments and
international organizations
“Impact of Inflation and the Current Economy on Valuations” 20
107/25/2022
Gasoline Prices (U.S. Dollar per U.S. Gallon)
June 6, 2022
Top 20 Countries
with most expensive
Gas at the pump
Source: www.globalpetrolprices.com. The prices for the countries with a * are updated weekly. The data for the remaining countries are updated monthly.
“Impact of Inflation and the Current Economy on Valuations” 21
12‐Month Percentage Chang (%) Consumer Price Inflation (CPI) Index
(YOY) – World, Advanced Economies, Emerging Markets
January 2000 – March 2022
10.0
Record High in this time
period for the World and
Advanced Economies
8.0
6.8
6.7
6.0 6.3
4.0
2.0
11-year record
for Emerging
Markets
0.0
-2.0
Mar-22
Jan-00
Jul-00
Jan-01
Jul-01
Jan-02
Jul-02
Jan-03
Jul-03
Jan-04
Jul-04
Jan-05
Jul-05
Jan-06
Jul-06
Jan-07
Jul-07
Jan-08
Jul-08
Jan-09
Jul-09
Jan-10
Jul-10
Jan-11
Jul-11
Jan-12
Jul-12
Jan-13
Jul-13
Jan-14
Jul-14
Jan-15
Jul-15
Jan-16
Jul-16
Jan-17
Jul-17
Jan-18
Jul-18
Jan-19
Jul-19
Jan-20
Jul-20
Jan-21
Jul-21
Jan-22
Emerging Markets World Advanced Economies
Source: IHS Markit, May 17, 2022
“Impact of Inflation and the Current Economy on Valuations” 22
117/25/2022
12‐Month Percentage Change (%) In Consumer Price Inflation (CPI)
Index (YOY)
May 2022 (%) Comments
United States 8.6% New 40-year record high.
April 2022 reading. Record in 31 years, largely driven by food, energy,
Canada 6.8% and transportation prices.
April 2022 reading. Record high CPI 12-month inflation rate in the
National Statistics series, which began in January 1997. Based on
United Kingdom 9.0% recently-published modeled consumer price inflation data for earlier
periods, inflation would have been higher in 1982, 40 years ago.
Record since the German reunification in 1990, 31 years ago. May 2022
Germany* 7.9% preliminary indication of 7.9%, if confirmed, would be the highest since
1973/1974, almost half a century ago.
Record since series creation in January 1997 (25 years ago), just prior
Eurozone 8.1% to the launch of the euro, driven primarily by unprocessed food and
energy prices. May 2022 is a preliminary indication
Source: U.S. Bureau of Labor Statistics, Statistics Canada, U.K. Office for National Statistics, Germany’s Destatis Statistisches Bundesamt, Eurostat.
* Non-harmonized measure.
Valuation, Inflation & Cost of Capital
“Impact of Inflation and the Current Economy on Valuations” 23
What can happen when inflation spirals out of control?
Inflation hit 5.97% in 1970. By 1974, inflation hit more than 11%. Inflation finally peaked at 13.5% in 1980.
From 1964 to 1980 the cumulative rate of inflation was 165.8% (Source U.S. Inflation Calculator)
“Impact of Inflation and the Current Economy on Valuations” 24
127/25/2022
Industry Trends
“Impact of Inflation and the Current Economy on Valuations” 25
2022 YTD Best and Worst Performing Industries Within the
S&P 500 Index
December 31, 2021 to June 30, 2022
S&P 500 - Energy Sector Index
80%
S&P 500 Index (Total Returns)
S&P 500 - Consumer Discretionary Sector
60% Index
40%
31.8%
20%
0%
-20% -20.0%
-32.8%
-40%
Source: CapitalIQ
“Impact of Inflation and the Current Economy on Valuations” 26
137/25/2022
2022 YTD Industry Performance in the S&P 500 Index (Total
Returns)
December 31, 2021 to June 30, 2022
Industry 2022 YTD (%)
Energy 31.8
Utilities -0.6
Consumer Staples -5.6
Healthcare -8.3
Industrial -16.8
Materials -17.9
Financials -18.7
Information Technology -26.9
Communications -30.2
Consumer Discretionary -32.8 Source: Capital IQ
“Impact of Inflation and the Current Economy on Valuations” 27
Impact of market drivers on beta
• The beta estimate for a specific company may underestimate that company's true beta if the market index
used during the look‐back period is overweighted by a specific industry. The theory is that the market index
should reflect the overall economy. But at times the market value for a particular segment of the economy
will take over the market index (e.g., FAANG stocks in recent years or in developing economies where one
or two stocks dominate the stock market capitalization).
• For example, if one computed beta estimates using historical returns over a look‐back period or obtained
beta estimates from data sources, the risks for basic manufacturing companies appeared to have gone
down in recent years because the beta estimates of these companies decreased. Prior to the run‐up in
prices of FAANG stocks, basic manufacturing companies represented significant weight in the stock indices.
Prior to the runup of technology and specifically FAANG stocks, the returns on basic manufacturing stocks
were highly correlated to the changes in the stock indices.
• As technology stocks began to dominate indices, the returns on the stocks of basic manufacturing
companies were significantly less correlated with returns in the market indices, making it appear that their
risks had been reduced. The underlying risks of basic manufacturing companies had not in fact changed.
But their observed betas then looked low compared with their long‐term average betas.
“Impact of Inflation and the Current Economy on Valuations” 28
147/25/2022
FAANG
December 31, 2021 to June 30, 2022
10% Apple Inc. Microsoft Amazon Meta (Facebook) Netflix
0%
-10%
-20%
-23%
-24%
-30%
-36%
-40%
-50%
-52%
-60%
-70% -71%
-80%
Source: CapitalIQ
“Impact of Inflation and the Current Economy on Valuations” 29
Projected Economic Growth
Short‐Term and Long‐Term
“Impact of Inflation and the Current Economy on Valuations” 30
157/25/2022
Real GDP Growth (%) Estimates (Median)
Data as of May 20, 2022
WORLD
2021
5.8
2022
2023
3.4 3.2
2020
-3.4
Sources: OECD, International Monetary Fund, World Bank, Blue Chip Economic Indicators, Consensus Economics, Economic Intelligence Unit, Fitch Ratings, IHS Markit, Moody's Analytics, Oxford Economics and S&P Global Ratings
“Impact of Inflation and the Current Economy on Valuations” 31
Real GDP Growth (%) Estimates (Median)
Data as of May 20, 2022
U.S. 2021
5.7
2022
2023
2.8
2.1
2020
-3.4
Sources: OECD, International Monetary Fund, World Bank, Blue Chip Economic Indicators, Consensus Economics, Economic Intelligence Unit, Fitch Ratings, IHS Markit, Moody's Analytics, Oxford Economics and S&P Global Ratings
“Impact of Inflation and the Current Economy on Valuations” 32
167/25/2022
2022 Real GDP Growth Rates of U.S., Eurozone, and UK
Median Estimates
Estimates as of December 1, 2021 and as of May 2022
Sources: OECD, International Monetary Fund, World Bank, Blue Chip Economic Indicators, Consensus Economics, Economic Intelligence Unit, Fitch Ratings, IHS Markit, Moody's Analytics, Oxford Economics and S&P Global Ratings
“Impact of Inflation and the Current Economy on Valuations” 33
Real GDP Growth (%) Estimates (Median)
Data as of May 20, 2022
CHINA
2021
8.1
2023
2022
5.3
4.6
2020
2.2
Sources: OECD, International Monetary Fund, World Bank, Blue Chip Economic Indicators, Consensus Economics, Economic Intelligence Unit, Fitch Ratings, IHS Markit, Moody's Analytics, Oxford Economics and S&P Global Ratings
“Impact of Inflation and the Current Economy on Valuations” 34
177/25/2022
Long‐term Projected Real GDP Growth (%)
Data as of June 30, 2022
SOURCE Long-Term Average (%)
Blue Chip Economic Indicators 2.5
Blue Chip Financial Forecasts 2.2
Consensus Economics 2.6
IHS Markit 2.5
Livingston Survey 2.2
Oxford Economics 2.6
Survey of Professional Forecasters 2.5
Range of Real GDP Growth Estimates
2.2% – 2.6%
Median 2.5%
“Impact of Inflation and the Current Economy on Valuations” 35
Long‐Term U.S. Inflation Expectations (5 to 10 Years Ahead)
Estimates as of June 30, 2022 (approximately)
SOURCES Long-Term Average (%)
What was the median
Aruoba Term Structure of Inflation Expectations 2.4 estimated long-term
Blue Chip Economic Indicators 2.8 inflation as of
Blue Chip Financial Forecasts 2.8 June 30, 2020?
Consensus Economics 3.0
Federal Reserve Bank of Cleveland 2.4
2.0%
IHS Markit 2.7
Livingston Survey (Federal Reserve Bank of Philadelphia) 2.5
Oxford Economics 2.6
Survey of Professional Forecasters (Federal Reserve Bank of
Philadelphia)
2.8
University of Michigan Survey 5-10 Year Ahead Inflation Expectations 3.1
Range of Inflation Estimates 2.4% – 3.1%
Median 2.8%
“Impact of Inflation and the Current Economy on Valuations” 36
187/25/2022
g = Long‐Term Growth Rate (Nominal)
Estimates as of early June 2022 (approximately)
The Long‐Term Growth Rate is calculated using the following formula:
1
Long-Term (1 + Long-
(1 + Long-
Growth Rate Term Real
Term Inflation
GDP
(Median) Forecast
Forecast)
5.4% = ( 1 + 2.5% ) ( 1 + 2.8% ) – 1
“Impact of Inflation and the Current Economy on Valuations” 37
Cost of Capital Ramifications
from Higher Inflation
“Impact of Inflation and the Current Economy on Valuations” 38
197/25/2022
Rising Inflation and Impact on Cost of Capital Inputs
“Impact of Inflation and the Current Economy on Valuations” 39
10‐Year Government Bond Yields for Canada, U.S., U.K., and
Germany
December 31, 2007 – June 30, 2022
6%
Canada Government Debt - 10 Year
5% United States Treasury Constant Maturity - 10 Year
United Kingdom Government Debt - 10 Year
Germany Government Debt - 10 Year
4%
3.2%
3% 3.0%
2.3%
2%
1.3%
1%
0.3%
0%
-1%
Sources: Capital IQ, NBER, ECRI
“Impact of Inflation and the Current Economy on Valuations” 40
207/25/2022
U.S. 20‐Year Treasury Yield, Including 10‐Year Trailing Average
December 31, 2007 – June 30, 2022
Spot 20-Year U.S.
Treasury Yield on
July 15, 2022
3.3%
Sources: Capital IQ, NBER
“Impact of Inflation and the Current Economy on Valuations” 41
Nominal vs Real Risk‐Free Rate
Conceptually, the risk-free rate can be illustrated as the return on the following two components:*
Risk-free Expected
Real Rate
Rate Inflation
* This is a simplified version of the “Fisher equation”, named after Irving Fisher. Fisher’s “The Theory of Interest” was first published by Macmillan (New York), in 1930. The Fisher
equation is formally expressed as (1 + Nominal Rate) = (1 + Real Rate) x (1 + Expected Inflation). When rates are low, there is very little difference between the simple form and the
Fisher equation. Various academic research papers show that the decomposition of the nominal rate into a real rate and expected inflation should include an additional component
excluded from the Fisher equation: the inflation risk premium. This premium reflects the risk that actual inflation may vary significantly from expected inflation, and it can be positive or
negative, with some academic estimates at close to 0%. In the current environment, the inflation risk premium could be a meaningful positive number.
“Impact of Inflation and the Current Economy on Valuations” 42
217/25/2022
Real Rate Estimates
Several academic studies have suggested the long-term real risk-free rate to be somewhere
in the range of -1.1% to 2.0% based on the study of inflation swap rates, yields on long-term
U.S. Treasury Inflation-Protected Securities (TIPS), OLG, DSGE and other econometric
models *
-1.1 % Long-term Real Rate 2.0%
* Based on academic studies issued between 2015 and 2021. In academic literature, this is also sometimes called the natural rate of interest, the neutral rate, or the equilibrium rate.
OLG = Overlapping Generational Model
DGSE = Dynamic Stochastic General Equilibrium Model
“Impact of Inflation and the Current Economy on Valuations” 43
Long‐Term U.S. Inflation Expectations (5 to 10 Years Ahead)
Estimates as of June 30, 2022 (approximately)
SOURCES Long-Term Average (%)
What was the median
Aruoba Term Structure of Inflation Expectations 2.4 estimated long-term
Blue Chip Economic Indicators 2.8 inflation as of
Blue Chip Financial Forecasts 2.8 June 30, 2020?
Consensus Economics 3.0
Federal Reserve Bank of Cleveland 2.4
2.0%
IHS Markit 2.7
Livingston Survey (Federal Reserve Bank of Philadelphia) 2.5
Oxford Economics 2.6
Survey of Professional Forecasters (Federal Reserve Bank of
Philadelphia)
2.8
University of Michigan Survey 5-10 Year Ahead Inflation Expectations 3.1
Range of Inflation Estimates 2.4% – 3.1%
Median 2.8%
“Impact of Inflation and the Current Economy on Valuations” 44
227/25/2022
Current inflation expectations measured by interest rates
(Source: Crestmont Research)
• Although short‐term interest rates are still incongruous with the current level of inflation, longer‐term
interest rates are closely tracking the overall market's expectation for future inflation.
• One of the best indications of intermediate‐term inflation is the 5‐Year, 5‐Year Forward Inflation
Expectation Rate. The measure is provided by the Federal Reserve Bank of St. Louis. The rate reflects the
market's expectation for average inflation over a five‐year period that starts five years ahead. Today, the
expected rate of inflation for 2028‐2032 is approximately 2.08%.
• Intermediate and long‐term bonds are aligned with inflation expectations, assuming that the market is
accurately assessing inflation risk. That's a significant assumption.
“Impact of Inflation and the Current Economy on Valuations” 45
Expected inflation
• Interest rates: The link between expected inflation and interest rates is explained by the Fisher equation,
where a nominal risk‐free interest rate (e.g., treasury bond rates) can be broken down into expected
inflation and expected real interest rate components:
(1 + risk‐free rate) = (1 + real interest rate) (1 + expected inflation rate + inflation risk premium)
where inflation risk premium = risk that inflation expectations are wrong – the greater the risk that
inflation measures are inaccurate, the greater the inflation risk premium
• Inflation surveys: Surveys (e.g., Michigan survey) report measures of expected inflation, obtained by
surveying economic experts or consumers.
• Exchange rates: Using a base currency where you can estimate expected inflation (e.g., U.S. dollar or Swiss
Franc) and forward exchange rates in the currency of another country, one can estimate inflation
embedded in that country’s currency.
“Impact of Inflation and the Current Economy on Valuations” 46
237/25/2022
Build up of Nominal Risk‐free Interest Rate
• The risk‐free rate reflects three components:
• Rental rate.
• Inflation.
• Maturity risk or investment rate risk.
• All three of these economic factors are embedded in the yield to maturity for any given maturity length.
• It is not possible to observe the market consensus about how much of the yield for any given maturity is attributable
to these factors.
• Exception is expected inflation, which can be estimated based on Treasury inflation‐protected securities [TIPS]).
• In the U.S., there are a number of well‐established surveys providing consensus estimates for expected inflation.
• Combining the range of long‐term real rates PLUS the range of expected inflation forecasts gives us an estimated build‐
up of the risk‐free interest rate.
“Impact of Inflation and the Current Economy on Valuations” 47
Issues with Risk‐free rate and ERP during times of crisis –
examining a build‐up of the risk‐free interest rate is
important
“Impact of Inflation and the Current Economy on Valuations” 48
247/25/2022
Risk‐Free Rate Normalization – United States
As of June 30, 2022
-1.1% Long-term Real Rate 2.0%
+ +
Spot 20-Year U.S.
2.4% Long-term Expected Inflation 3.1% Treasury Yield on
July 15, 2022
= =
3.3%
1.3% Long-term Normalized Risk-Free Rate 5.1%
• Fisher Equation: Midpoint = 3.2% / Median = 3.4%
• LT Average: 10-Year Trailing Average of 20-Year U.S. Treasury Yield = 2.5%
Concluded Normalized Rf = 3.5%
“Impact of Inflation and the Current Economy on Valuations” 49
Corporate Debt Spreads
U.S. High Yield Corporate Bond Yields over U.S. Investment Grade Corporate Bond Yields
December 2007 – June 2022
16.0%
December 15, 2008
14.4%
(Record High)
Series1 Longer Term Average Series2
14.0%
12.0%
March 25, 2020
6.6%
10.0%
February 11, 2016
(D&P increases
ERP to 6.0% from
July 15, 2022
6.2%
5.0%)
8.0% December 9, 2020
2.7%
(D&P lowers ERP to
5.5% from 6.0%)
3.8%
6.0% June 30, 2022
4.0%
4.0% 3.7%
2.0%
December 19, 2019
2.4%
(D&P lowers ERP to 5.0% from 5.5%)
0.0%
Sources of underlying data: FRED
“Impact of Inflation and the Current Economy on Valuations” 50
257/25/2022
Where are we?
• Despite inflation reaching multidecade highs and no clear end in sight for today's market
negativity, the U.S. government appears reluctant to declare that we're nearing a recession.
• But the government might not officially declare that we're in a recession for months.
• The term "recession" is a backward‐looking designation.
• U.S. GDP fell by an annualized 1.6% in the first quarter of 2022.
• Assume that the 1.6% decline carried through the entire year. That 1.6% loss would translate to
around $384 billion in lost economic activity.
“Impact of Inflation and the Current Economy on Valuations” 51
What’s Ahead?
“Recession looks very imminent… When you get spot commodity prices
dropping while the inflation rate is accelerating, you've got a recession on
your hands. The reason copper and gold and lumber and all those are
dropping is because the demand for them is going down. It's not like rents
and all these other things that are rising at high rate. So we've got the worst
of all possible worlds.”
Economist Art Laffer
“Impact of Inflation and the Current Economy on Valuations” 52
267/25/2022
U.S. Recessions since 1980
“Impact of Inflation and the Current Economy on Valuations” 53
What’s Ahead? U.S. Recessions since 1980
Time since Peak GDP decline
Period Duration
Name previous recession unemploy (peak to
Range (months)
(months) ment trough)
Jan 1980–July 4 years 7.8%
1980 recession 6 months −2.2%
1980 10 months (July 1980)
July 1981–Nov 1 year 10.8%
1981–1982 recession 1 year −2.7%
1982 4 months (Nov 1982)
July 1990–Mar 7 years 7.8%
Early 1990s recession 8 months −1.4%
1991 8 months (June 1992)
Mar 2001–Nov 6.3%
Early 2000s recession 8 months 10 years −0.3%
2001 (June 2003)
Dec 2007–June 1 year 6 years 10.0%
Great Recession −5.1%
2009 6 months 1 month (October 2009)
Feb 2020–April 10 years 14.7%
COVID-19 recession 2 months −19.2%
2020 8 months (April 2020)
“Impact of Inflation and the Current Economy on Valuations” 54
277/25/2022
What’s Ahead?
• From 1980 through today, all six recessions in the U.S. lasted less than two years. And
four recessions didn't even carry on for an entire year.
• In the second quarter, the stock market declined further. As a result, normalized P/E
decreased to 32.2. The Adjusted P/E (based upon Shiller's CAPE P/E10 method) is 28.2.
Both normalized values are significantly above the As Reported P/E of 18.8.
• The stock and bond markets appear to have accepted (for now) that the recent surge in
inflation will moderate back to near 2% within the next five years. Inflation at that level
would justify P/E in the low‐ to mid‐20s. (Source: Crestmont Research, July 11, 2011)
• Will Fed’s actions be sufficient to halt the increasing rate of inflation? Will we enter a
recession?
“Impact of Inflation and the Current Economy on Valuations” 55
Projecting Company Cash Flows
Potential Impact from Inflation
“Impact of Inflation and the Current Economy on Valuations” 56
287/25/2022
Projecting Company Cash Flows
• There is no “one size fits all” when understanding how inflation will impact a specific company
• What is the sensitivity of your company’s pricing to inflation? How easy is it for your company to raise prices?
• What is the sensitivity of your company’s operating costs to inflation? Can you control rising costs?
• The difference in these sensitivities will determine if your margins will be squeezed. Recession will likely cause
increased variance in operating profit margins which will result in increased cost of equity.
• Is your company in the midst of any large capital projects? Can you change the project timeline to stagger phases
of the project if inflationary costs spiral? What is your flexibility?
• Is your company planning any large capital expansions? Can you phase the project to better control required
investments as costs rise?
• As inflation increases, there is more uncertainty, which will further increase interest rates and equity premiums.
• Are your financing costs fixed or are they variable? When will refinancing of existing debt be required? The cost
of debt financing will go up as inflation continues/increases.
• The cost of equity will increase as interest rates increase and volatility of profit margins increase (see graph
showing relationship documented by the Kroll Risk Premium – Risk Study).
“Impact of Inflation and the Current Economy on Valuations” 57
Kroll Risk Premium Report – Risk Study
available via the Kroll on‐line Cost of Capital Navigator
Increasing risk premium as variability of operating margin increases
Smoothed Premium vs. Unadjusted Average
20%
18%
16%
14%
Equity Premium
12%
10%
8%
6%
4%
2%
0%
-1.8 -1.6 -1.4 -1.2 -1.0 -0.8 -0.6 -0.4 -0.2 0.0 0.2 0.4
Log of Median CV(Operating Income)
“Impact of Inflation and the Current Economy on Valuations” 58
297/25/2022
Questions?
Contact information:
Roger.Grabowski@kroll.com
“Impact of Inflation and the Current Economy on Valuations” 59
30You can also read