4.1 Set the Trigger Summary - Forecast ...
←
→
Page content transcription
If your browser does not render page correctly, please read the page content below
4.1 Set the Trigger

Summary

Setting triggers is one of the cornerstones of the Forecast-based Financing system. For a National Society
to have access to automatically released funding for their early actions, their Early Action Protocol needs
to clearly define where and when funds will be allocated, and assistance will be provided. In FbF, this is
decided according to specific threshold values, so-called triggers, based on weather and climate
forecasts, which are defined for each region.

During the last decades, forecasting of climate and weather-related hazards has improved significantly. In
parallel to this, our capacity to understand risks has increased, and more data has become available to
capture disaster impacts, exposure, and vulnerability. Such developments in hazard-prediction and
understanding risk are essential to setting up triggers, which in turn enable decision making and early
action before a disaster occurs.

FbF is designed for those weather-events that are predicted to have a severe humanitarian impact, e.g. it
is not enough to know what the forecasted windspeed will be, but we need to know whether the storm
will cause impact. Thus, in FbF, the trigger is the degree of forecast loss and damage (human, livelihoods,
infrastructure, environment etc.), or in other words the degree of humanitarian impact, of an extreme
event, that would initiate action. If more than a predetermined probability of a certain amount of
loss/damage is forecasted, we act.

For this reason, the Impact-based forecasting approach is the basis of the FbF trigger methodology. It
focuses on what the weather will do, rather than forecasting only what the weather be. Ultimately the
objective of setting up triggers in the humanitarian and development context is to provide decision makers
the necessary information to know when and where early action should take place and who and what is
likely to be impacted. In line with the impact-based forecasting approach, the trigger model is developed
based on a detailed risk analysis of relevant natural hazards, including impact assessments of past
disaster events, and analysis of exposure and vulnerability data.

The work for the identification of triggers can be very technical and require expert resources. Cooperation
among key actors and institutions is necessary, including the National Hydrom Meteorological services
(NHMS), Disaster Risk Management Agencies (DRM), risk information management experts, and
humanitarian and development actors among others. Development of a multi-disciplinary working group is
suggested to include all relevant stakeholders. In the case there is a technical lead or advisor for the
development of the trigger, specific steps could be researched and written up and the results presented
to the working group. The stakeholders in the group can provide occasional feedback to the process and
agree on the final recommended triggers ( see terms of reference of technical working group).

FbF Practitioners Manual
06/2022                                                                                                 1
Reasons to move towards Impact-based Forecasting

          Like humanitarian assistance in general, due to lack of funds and capacity FbF will not be
          able to help all populations at risk when an extreme event is approaching. Impact-based
          forecasting helps FbF identify those areas/communities for which the most severe
          humanitarian impact is expected and to prioritize those areas for the implementation of early
          actions. Similar to humanitarian response, which acts where disaster impact and needs are
          greatest, with the help of impact-based forecasting, FbF acts where the predicted impact
          and needs are greatest.
          Thus, impact-based triggers allow for evidence-based decision making. Deciding when and
          where to act based on the best possible information, rather than subjective information or
          judgment allows for transparent and accountable prioritization and decision-making.
          Impact-based forecast provides sector-specific and context-specific decision-making
          information to know who and what is more likely to be impacted by certain hazard. This can
          lead to more targeted and efficient sectoral early actions and response actions at the
          household and institutional levels.
          By focusing on communicating what could be the potential impacts of a forecast hazard, it
          is expected that the population at risk and the responding professionals (DM agencies, Red
          Cross Red Crescent, UN Agencies, NGOs, Civil society, etc) will be able to take more
          effective decision to activate Early Action Protocols, contingency plans and household level
          plans, and to act before a disaster happens.
          The development of Impact based forecast services, represents a radical shift in the way
          weather services are produced. Production of impact-based forecasts should therefore be
          a collaborative, participatory and inclusive process, in which triggers are co-produced
          among key agencies.

This chapter will guide you through the process of defining the trigger for your EAP. It will address the
following questions:

      What steps are required for the risk analysis?
      How can you assess the available forecasts and create an inventory of forecasts?
      How can you select the exposure and vulnerability indicators for your trigger model?
      How can you create an intervention map?
      How can you define and justify your impact level?

FbF Practitioners Manual
06/2022                                                                                                     2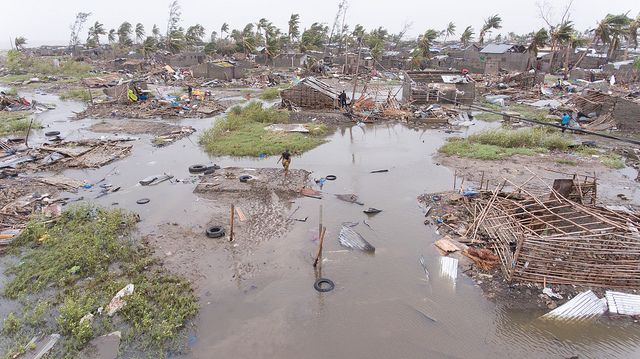
The steps below are not intended to be implemented in any particular order; different tasks may happen
in parallel in what is an iterative process.

Step 0: Establish coordination mechanisms

The co-production of the impact-based forecasting-trigger model with the relevant government agencies
(especially hydro-met) is a key aspect of the sustainability of the entire FbF system. For this, it is essential
to kick start the trigger development process by establishing and/or strengthening partnerships. An
advocacy strategy (see Engaging stakeholders chapter) and, depending on the context, an MoU to
facilitate data sharing should be in place. An understanding of the larger landscape of investments in
Hydro-Met modernization and risk information management systems will also help. In some cases, there
may be well-established work on IbF that needs to be tailored to the needs of the humanitarian sector, or
there may be existing risk information management platforms that could be used for the trigger model.

Key questions:

   1. Who are the key actors issuing forecasts and early warning messages? Are there stakeholders
      already working on Impact-based forecasting? Are there existing initiatives/investments in IbF?
   2. Are there existing agreements, or MoU between the key actors e.g. NHMS and DRM agencies,
      RCRC and NHMS?
   3. Are there existing risk information management systems that can be used for the trigger model? (e.
      g in Indonesia, the DRM agency has developed InaSAFE a risk information management system
      that has been used to develop an IbF/trigger model that the Indonesia Red Cross will be able to
      use for the Early Action Protocol.)
   4. Is there political will within the government to contribute to developing and potentially run the trigger
      model or, will the trigger model be developed by other actors?

Step 1: Start risk analysis

A risk analysis, in the context of FbF methodology, serves to understand what kinds of disaster impacts
can be expected from a particular type of hazard and to identify who and what is exposed and vulnerable
to this hazard and why.

For example, if wind-damaged roofs is a major impact of cyclones, an exposure map will indicate the
geographical areas where houses are most exposed to cyclones and a vulnerability map for cyclone wind
and/or storm surge can indicate those geographical areas where indicators such as as housing type,
literacy rate, and remoteness predict highest vulnerability and thus highest impact. When analysing risk,
the overall hazard (e.g. a storm) should be separated into its “sub-hazards” (e.g. wind, rain, storm surge)
to ensure that all exposed elements and their vulnerabilities are included and all potential impacts are

FbF Practitioners Manual
06/2022                                                                                                       3
considered.

A specialized government agency, the DRM agency or other experts in risk analysis and modelling (within
the Red Cross Red Crescent or outside) should be closely involved in the implementation of this step.

© GRC

Step 2: Select hazard and assess past impacts

The hazards to be tackled by the FbF system have usually already been decided during the feasibility
study based on historical impacts and a preliminary forecast analysis; however, if not covered by the
feasibility study, the following questions should be answered before developing the EAP for a given
hazard:

      Is this hazard forecastable?
      Are the disaster impacts caused by this hazard, severe enough to justify the development of an
      EAP for this hazard?
      Is avoiding and/or reducing disaster impacts due to this hazard a priority for the Government and
      the National Society?
      How is the nature and impact of the hazard expected to change in the future due to climate
      change, climate variability, and other external drivers?

The FbA by the DREF allocates funding for EAPs to reduce the impacts of extreme events of a strength or
magnitude that in the past have required humanitarian assistance. In order to demonstrate that the

FbF Practitioners Manual
06/2022                                                                                                   4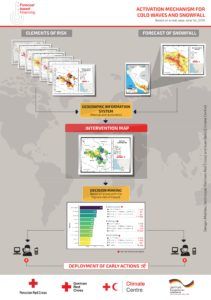
selected hazard has caused extreme humanitarian impacts in the past, information on the previous
impacts of the selected hazard in the country should be provided.
While it may be challenging to find quality information on historical impact for some hazard types in certain
areas, aim for the highest level of detail possible. Key information includes the date of the past event, its
severity, and impacts on sectors like health, infrastructure, agriculture, food security, and water. Ultimately
this will help you prioritize the impact your EAP will address, i.e. to understand, “what are the key disaster
impacts that can be tackled by the FbF system?” and “what are those impacts that can be avoided or
reduced with early action?”. (see also Step 2 Prioritize Impact in chapter “4.2. Select Early Actions”.
Gathering historical disaster impact data to conduct the risk analysis can be done using sources at the
local, regional, national, and sometimes even the international level. To an extent international databases
such as Desinventar, EMDat, HDXcan be used. Post-disaster Needs Assessments (PDNAs) are a crucial
source of information, as well as sectoral disaster impact databases (Ministries of Agriculture, Public
Works, Interior etc). Often data is managed by national statistical departments and/or the disaster risk
management agencies. Some countries are advancing their risk information management capabilities, so
you might find out that there is already an existing risk information management system that captures all
the historical disaster impact data across different sectors. Nevertheless, there are countries that do not
have appropriate system to gather and record such data. In such cases, other strategies (e.g. interviews)
should be identified to get the best possible picture about who and what has been impacted by the
selected hazard, how, when and why. Once all this data is gathered, it will be possible for the National
Society and partners to decide which are the priority disaster impacts that should be managed by the FbF
systems. Defining specific impacts is the basis for deciding which risk indicators could be used in the
trigger models (as well as for the selection of early actions).
For example, after an analysis of cyclones impact in Mozambique with data from 1990, it was decided
that the impact to be considered in the trigger model is the destruction of houses.
Key questions for data collection on past impacts:
What are the historical disaster impact databases available for the selected hazard? How confident
are we in the quality of the historical records?
What is the time and geographic distribution of impact for particular events? When did they
happen?
Where were the impacts observed?
What was the magnitude of the hazard?
What were the humanitarian impacts?
When the event happened, what vulnerabilities contributed to impact? In which ways did people
suffer most from the disaster?
What did people find most difficult to deal with in their daily lives?
Were their livelihoods jeopardized?
Which sectors were affected the most? For example, a typhoon can cause impacts on health,
shelter, agriculture, infrastructure etc.
FbF Practitioners Manual
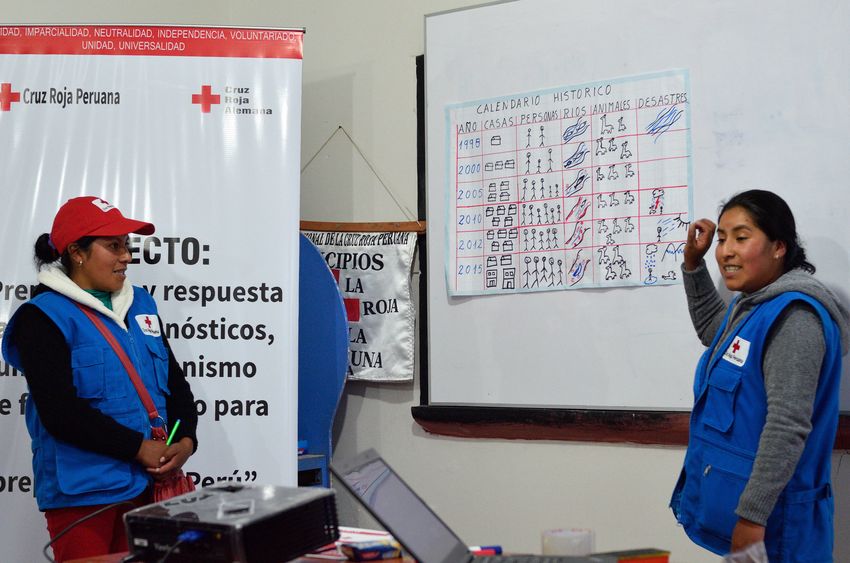
06/2022 5Peru Red Cross: Historical calendar for Coldwaves © GRC Step 3: Identify who and what is exposed? In line with the logic of impact-based forecasting, it is important to identify the main exposed elements on which the FbF intervention will focus. An analysis of exposure is required to determine who and what is located in the area where the hazard might occur. This will help to determine who and what is likely to be impacted. For example, if the prioritized impact of floods is the mortality of children under 5 due to water-borne diseases, then the exposed element will be the population of children under 5: or if the most frequently recurring and largest impact due to tropical storms is the damage to houses built with light materials, then the exposed element will be houses built with light materials; or, if the prioritized impact due to cold waves is the mortality of alpacas, then the exposed element will be the alpaca population. This step builds on the data already collected on past impacts of the hazard; however, more specific data on the prioritized impact(s) may need to be collected. This data will be filtered based on quality, accessibility, latest updates, scale, and granularity. Key questions: FbF Practitioners Manual 06/2022 6
In relation to the prioritized impact(s), who and what suffer the most?
      Which sub-groups of the populations are exposed?
      What elements of the built environment are most affected (e.g. houses, schools, cross, natural
      resources, water points, roads)?
      Where are those exposed elements located? (For example, households on at risk parts of
      embankments).

Step 4: Identify key vulnerability indicators

For an impact-based forecast/trigger model to function it is essential to know who and what is most likely
to be impacted. Once we know in general who and what is exposed to harm, then we need to know why
they are impacted negatively. The vulnerability (and capacity) analysis is the basis to help in the
prioritization of geographical areas, communities, households and even individuals who are more likely to
be impacted by a hazard.

We need to identify and agree on the indicators of vulnerability – down to the smallest administrative unit
possible – to be used in the trigger model. For example, if the morbidity and mortality of children under
five due to floods is the priority impact, children under five are the exposed element. We then need to
know the underlying causes of the problem and who amongst all the children are the most vulnerable.
Vulnerability indicators could be poverty, malnutrition, existing mortality and morbidity, and/or the number
of children per household. In some cases, coping capacity (e.g. access to health care) can also be
integrated into the trigger model. In some cases, data on certain indicators might not be available or may
be outdated or unavailable in sufficient granularity. In such cases, consider the use of proxy indicators
(e.g. high levels of poverty can imply that quality of housing is poor).

Key questions:

      How are impacts related to the underlying causes of vulnerability? For example, people with houses
      made from low-quality materials will be vulnerable to storms or earthquakes. However, more
      indirect vulnerabilities such as poverty, literacy and access to electricity might play a role in people’s
      ability to prepare for and cope with impact.
      What are the vulnerability indicators that are related to the identified disaster impact and exposed
      elements?
      Which vulnerability indicators can be used in the trigger model? What is their quality? Are they at a
      sufficient geographical scale to be used for decision-making? How often are they updated?
      Which vulnerability indicators are redundant (e.g. education levels and literacy), and which
      indicators provide new information?

Once the vulnerability and exposure indicators are defined, a composite updatable vulnerability index can
be developed as one layer of the impact-based forecasting trigger model. If you are developing a
composite index, be careful about which contributing layers you select and how much weight you assign
to each indicator, so as not to over-weigh certain patterns of vulnerability. Remember not all indicators

FbF Practitioners Manual
06/2022                                                                                                      7
have the same level of quality and granularity; therefore, sometimes using less indicators of better quality
for the index is a better option than many of poor quality.
© Peruvian Red Cross
The number of indicators can be narrowed by concentrating on those most relevant for the
specific hazard of interest. For example, building quality will be mapped for cyclones but may not
be relevant for droughts. For droughts ‘changes over time in school attendance’ is a relevant
vulnerability indicator, but less so for cyclones. It is important to reach agreement among the key
actors on the choice of indicator.
Step 5: Create an Inventory/Menu of Forecasts
What are the potential forecast products available? What is the most appropriate forecast product we can
use? What are the mandates around using various products?
In order for FbF to allocate funding when a trigger occurs, there must be a certain probability of the
extreme event taking place. To safeguard this, it is crucial to select the best-suited forecasts. An analysis
of forecast verification, type, reliability, lead times, and sources of data for forecasts should be presented
as an inventory, to allow the working group to decide which one to use. Note that this information does
not need to be analysed or calculated by the National Society, but can be obtained by working with
hydro-meteorological services, research institutions, experts etc.
Key questions:
FbF Practitioners Manual
06/2022 81. Which agency produces the forecast (NHMS, GloFAS, ECMWF, IRI, etc.)?
2. What kind(s) of forecast(s) are produced or how is the forecast produced? Choices include
observed data (e.g. gauged precipitation), statistical forecasts (e.g. extrapolation of an upstream
river flow to a downstream location, or an index based on El Niño sea-surface temperatures), and
dynamic models (e.g. numerical weather-prediction systems and large-scale hydrological
forecasting models).
3. What is the format of Issuance? Deterministic: Showing a single outcome without conveying
potential error and uncertainty, Probabilistic: Showing the probabilities of one of more discrete
outcomes or categories. Intervals: Showing an explicit upper and lower limit between which a value
is expected to occur.
4. How often is the forecast produced?
5. Is the forecast generated by a computer model or produced by human estimates?
6. What is the lead time for each forecast? I.e., what is the time between forecast issuance and the
shock?
7. What regions are covered by the forecast?
8. What is the skill of the forecast? How has the skill has been assessed (skill at a specific location, skill
at predicting extreme events)?
9. What is the resolution in space or time?
Lead times will vary according to the forecast used: observations (e.g. rainfall has already fallen), short-
range weather forecasting (12 to 72 hours), medium-range weather forecasting (above 72 hours and up
to 10 days), extended-range weather forecasting (up to 30 days), monthly, every three months, and
seasonal outlooks. Forecasts at different lead times tend to predict different variables (e.g. seasonal
rainfall vs 3-day rainfall totals). While forecasts with shorter lead times often are more accurate, in order for
early actions to be implemented a few days will be needed in most cases. This needs to be considered
when selecting the forecast.
Once decision-makers make a choice of forecast, a more detailed skill assessment may be needed.
Historical forecasts should be compared to historical observations and disasters to assess how often the
trigger would be reached and the probability of ‘acting in vain’ (see Guidelines on forecast verification).
FbF Practitioners Manual
06/2022 9Lead time
and "How
Sources/ often is it
Forecast Availability Forecast type / Spatial Resolution produced" Forecast skill
River SENAMHI River flows forecast based on rainfall Daily for Not verified
flow information of the ETA and WRF lead times
models (32 km and 22 km resolution up to 72
respectively). Available at specific hours
hydrological stations.
River GLOFAS – River flows forecast and return Daily for Verified 9 days lead time
flow JCR Global periods based on probabilistic outputs lead times 45% chance of false
Model Daily of ECMWF IFS at ~10 km grid scale up to 45 alarms for a forecast of
bias representation of the river, bias days exceeding the 1-in-10
correction by corrected using daily observations year return period
SENAMHI
River Deltares River flows forecast and return Daily for Not available due to
flow Global Model periods based in probabilistic outputs lead times lack of data for
of delayed ECMWF forecasts and up to 10 verification
GFS at the level of hydrological days
stations
River GLOFAS – River flows forecast and return Produced Available from GloFAS
flow JCR Global periods based in probabilistic outputs every team
Model of ECMWF at the level of hydrological season for
stations the
following 3
months
River SENAMHI Forecast trend based on the Produced Not available due to
level statistical model at the Enapu every lack of data for
station - Iquitos. season for verification
the
following 3
months
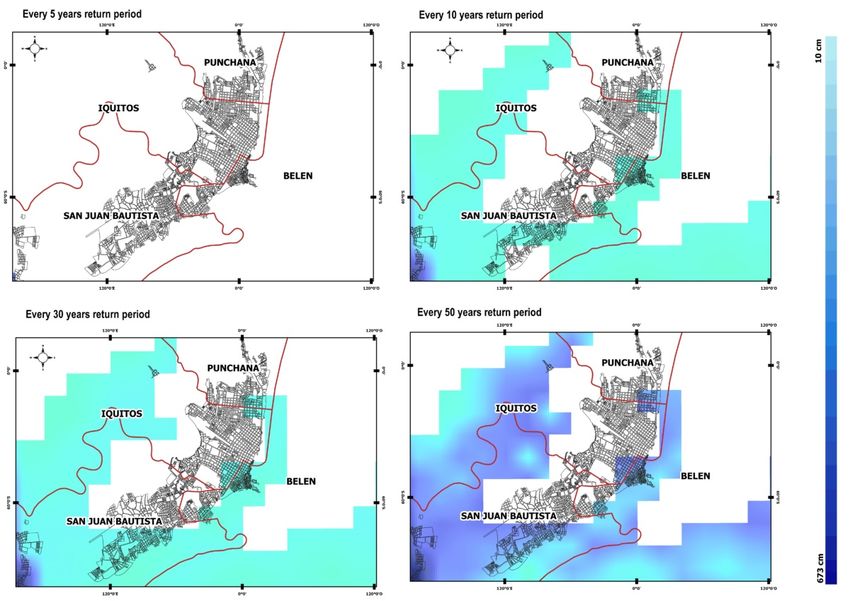
Table 1. Example of inventory of forecast for river floods in the Amazon.
Step 6: Define hazard magnitudes
FbF provides funding for early action for events of a strength and magnitude that has caused significant
humanitarian impact in the past; it focuses on extreme events and not, for example, on annual floods that
are better addressed by other interventions. One way of measuring the magnitude of the event is the
return period.
In this step, past hydrometeorological data should be gathered and used to build a picture of the climate.
This historical data is used to understand what is normal for each location and what is unusual or
“extreme”.
This historical data can be used to calculate the return period of the most extreme events. The return
FbF Practitioners Manual
06/2022 10period provides the probability of an extreme event happening in a given year. However, return periods are often misinterpreted: the correct definition of a 1-in-5-year rainfall event, for example, is the amount of rainfall that has a 20 percent chance of being exceeded in any given year. It is entirely possible to observe a 1-in-5-year event in two consecutive years, or even in the same year. Return period maps – showing distribution of inundated area (not necessarily impact on people) for events at increasingly rare occurrence levels – related to magnitude of inundation. Step 7: Analyse links between hazard magnitude and impact What impacts can we expect from hazards with a certain magnitude? Not every event with a return period of 1-in-5 years will be an extreme event with significant humanitarian impact. For this reason, it is necessary to demonstrate what impact a hazard of a magnitude that occurs for example every five years on average will have. This step – defines the relationship between impact and hazard magnitude that will be different for people of different vulnerabilities. Often called the impact- hazard curve or vulnerability function, it establishes expected impact hazard magnitudes and vulnerabilities. Ideally, this should be established for different sectors, impact types, and regions. For FbF Practitioners Manual 06/2022 11
example, the impact of a cyclone with a certain windspeed will look much different in a refugee camp
than in a nearby town.

    How does this look?

    Establishing the relationship between a hazard of a certain magnitude and the associated impact
    depends on data. For example, if the major impact of a given hazard is on shelter, then the
    impact-hazard curve in the context of FbF should be done for this sector. In places with very little
    data, the ‘curve’ may be a deterministic statement such as: “At 100 kph we expect 20 per cent of
    houses to be destroyed, and at 150 kph we expect all houses to be destroyed.”

    Development of the most simple impact-hazard curve would rely only on expert knowledge and
    qualitative categories rather than quantitative data from historical disasters. For instance, in the
    case of flood risk, this may involve expert judgment from water managers, irrigation experts, and
    dam operators, as well as disaster managers, DRR and hydrometeorological experts and others.
    When little data is available, another way of showing that hazards of a certain magnitude caused
    significant impact is to link them to past humanitarian response operations. E.g., in the past,
    whenever a cyclone hitting area X had a wind speed of more than 120km/h (1-in-x year return
    period), a DREF or emergency appeal was launched because the impact was so great that
    humanitarian assistance was necessary. The information can be created in a general sense for an
    entire region (river basin, coastal area, etc.), or be more geographically specific and targeted to
    specific groups, factoring in considerations like the different ways the hazard could play out in
    different parts of the country (e.g. in urban areas).

It is also important to consider, if data allows, how vulnerability and exposure change over time.

This step should provide decision-makers with a view of what impact can be expected for which people
(or livestock/assets) a given hazard magnitude; step 9 will show for which area the (most severe) impacts
can be expected.

Approaches to impact-hazard curves

   Expert knowledge

    This approach uses the expert judgement of people who work in the region and have an
    understanding of what kind of impacts can be expected when a hazard strikes. For example,
    experts can indicate that above 100km/hr winds, 20% of houses are likely to be destroyed, and
    above 150km/hr winds, all houses are likely to be destroyed. This expert view can be combined
    with a map of vulnerability information, to identify the most vulnerable administrative areas to be
    prioritized for early action according to budget available.

FbF Practitioners Manual
06/2022                                                                                                   12
Predictions of absolute impact levels can instead use historical quantitative data and not expert judgement. This is where the following approaches come in. Elementary modelling Historical data from observations (as opposed to modelling) can point to the relationship between hazard magnitudes and impact. A good example of this approach is the one used in the FbF project in Uganda. Impact data was collected, which recorded when there was impact of floods on the vulnerable population in the last couple of years. This impact was compared with forecasted water discharge levels for each day during those same years. A relationship was determined, which best discriminated the impact periods, from the non-impact periods. In this case, the project did not develop a full hazard-impact curve but selected a single level above which they could show there had been significant impact in the past. This is the simplest relationship that can be established. It only establishes a correlation with one indicator (water discharge) and distinguishes two levels: no impact or flood with impact. This approach can also be expanded to allow for different levels of impact and establish separate relationships for different levels of vulnerabilities. This could, for example, produce a chart like Figure 4. (Quantitative modelling should be adjusted by experts.) Note that establishing such a chart requires access to quality data, and the results should be verified against new data or expert judgement to ensure they make sense. From here, it is then only a small step to a formal statistical model. Statistical modelling Statistical modelling and machine learning, based on good impact data for past events, can test the potential of several explanatory indicators. These tools can create more complex relationships between the input information (e.g. vulnerability, hazard magnitude, exposure), and the predicted impacts. Impact differences between urban and rural areas might be explained through a statistical model of differences based on short-term forecast variables and others covering vulnerability and capacity. Crop models for agro-hydrometeorological forecasting are one example from the complex end of the spectrum. FbF Practitioners Manual 06/2022 13
Ultimately, whichever of these three approaches is used, the resulting model will give decision-makers
perspective on the degree of impact – in absolute or relative terms – expected for a specific magnitude of
hazard and given the vulnerabilities in different locations.

Machine Learning is an algorithm that can learn from data without relying on rules-based programming.

Statistical Modelling is formalization of relationships between variables in the form of mathematical
equations.

Step 8: Define and justify your impact level

Following the previous steps, determine the level of impact and corresponding hazard magnitude at which
your EAP should be triggered. In the EAP, explain how the impact level was defined and provide data
(from step 8) showing that the magnitude/strength of the event corresponding to your selected impact-
level has caused disastrous humanitarian impacts in the past. Always include the sources of your data.
You also need to indicate the return period to which the selected impact-level corresponds (minimum: 1-
in-5 years) and explain how the return period was calculated (step 6).

Step 9: Generate intervention map

Where and when should decision-makers carry out early actions?

Historically, vulnerability and exposure maps have been used primarily for planning and infrastructure, but
not routinely to contextualize forecasts and warnings.

When an impact level is reached, we combine vulnerability and exposure information with the real-time
forecast (selected from the inventory of forecasts) to identify which areas are likely to be most impacted.

How?

There are two main ways to do this. First, the most advanced form would digitally combine the forecast
with vulnerability and exposure maps, to predict the expected impact. By overlaying the maps, it will
become clear which areas are predicted to be most severely impacted. These areas can then be targeted
as priority areas for early action to ensure the most at-risk communities receive assistance before the
event happens. This first option will provide a map-based tool or a list of prioritized villages, municipalities,
or other geographical areas where the early actions will be activated. Where feasible, using existing risk
information management platforms can be a way to develop impact-based forecasting intervention maps.
For example, in Indonesia, an impact-based forecasting functionality has been added to the existing
InaSAFE platform which will allow the Indonesia Red Cross to use the platform for its trigger.

FbF Practitioners Manual
06/2022                                                                                                     14
However, in a second approach, at its simplest, vulnerability and exposure information can be combined
with forecasts using expert judgement to identify the places at highest risk. Where no digital system is
available, this could also be done manually, e.g. if flooding is forecasted for a certain area, the poorest
communities in the floodplain are selected. Or, if different weighted indicators are used to calculate a
vulnerability index, check on the index which of the communities in the area for which the event is
forecasted score highest.

Information technology capacity will vary between agencies and the design of tools needs to take this into
account. Likewise, forecast skill and stakeholder engagement will also vary, but it can be expected to
improve with engagement in the FbF process over time.

© Peruvian Red Cross

What could go wrong?

   Collecting data is often easier said than done. FbF National Societies are still learning, and it is
   important we share our experiences of what can and does go wrong.

   Here are some commonly occurring challenges National Societies have experienced with potential
   solutions.

   Data quality:

          Data quality can be a major hurdle. There may be gaps in existing data or the accuracy of
          values may be questionable.

FbF Practitioners Manual
06/2022                                                                                                   15
Data Access:
Sometimes government agencies wish for National Societies to pay for the data needed for
FbF impact-based mapping despite the added value of National Societies’ acting early in
disasters. In these cases, consult the IFRC and your cluster branch. Create FbF champions
within government (see chapter on Engaging stakeholders), and share your challenges (you
never know who knows someone who may help).
Data scale:
In many cases, risk data is only found at very high administrative level, not at lower levels,
which make the use of such data not useful. The smaller the size of the administrative unit
for which data is available, the better. Using data sets such as OpenStreetMap is in some
cases a way to mind this gaps.
Here you’ll find more examples of what can go wrong.
Video: https://www.youtube.com/watch?v=ADLjOXIeK1A
Toolbox
WMO Guidelines on Multi-hazard Impact-based Forecast and Warning Services
Terms of Reference for FbF thematic groups
Guidelines on Forecast Verification
What can go wrong
Forecast-based Financing and Early Action for Drought (RCCC, 2020)
Decision Tree - Questions and Pathways to FbA for Drought (RCCC, 2020)
Financement basé sur les prévisions et actions précoces en cas de sécheresse (RCCC, 2020)
Arbre de décision - Questions relatives aux ABP pour la sécheresse et marches à suivre pour les
concrétiser (RCCC, 2020)
FbF Practitioners Manual
06/2022 16FbF Practitioners Manual 06/2022 17
You can also read