In Search Of Equity Exploring Africa's Gender Gap in Startup Finance - October 2021 - World Bank Documents
←
→
Page content transcription
If your browser does not render page correctly, please read the page content below

Public Disclosure Authorized   Public Disclosure Authorized   Public Disclosure Authorized   Public Disclosure Authorized

                                                                                                                                                                                    September

BRITER
                                                                                                                                                                                              2021
                                                                                                                                                                                    October 2021

BRIDGES
                                                                                                                                                              In Search Of Equity
                                                                                                           Exploring Africa’s Gender Gap in Startup Finance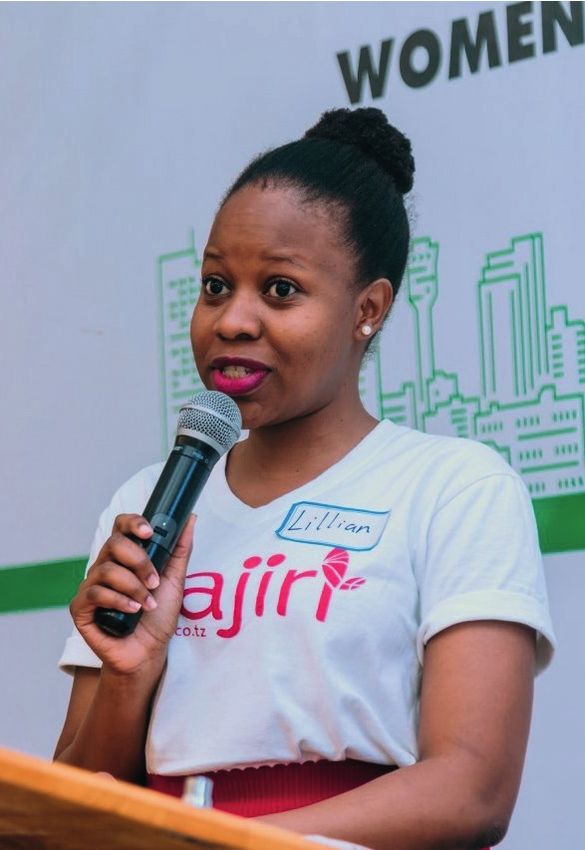
Acknowledgements
This report is a collaboration between the World Bank’s Africa Gender Innovation Lab (GIL) and Briter Bridges.
It was produced jointly by Lisa With and Dario Giuliani at Briter Bridges, and with Rachel Coleman, Menaal
Ebrahim, and Toni Weis at GIL. The authors are grateful for feedback provided by Niklas Buehren, Francisco
Campos, Chorching Goh, Markus Goldstein, Diego Ubfal, and Stephanie Vak-Stephens. Many thanks to all
founders who took time out of their busy schedules to complete the survey, respond to an interview, or provide
other inputs into the report.

                       BRITER
                       BRIDGES
Briter Bridges is a fast-growing market intelli-            The World Bank’s Africa Gender Innovation Lab
gence and research firm focused on underserved              produces rigorous research on what works, and
economies. Briter has built the largest collection          what does not work, for women’s economic
of visual publications on Africa and underserved            empowerment and translates these insights into
markets and regularly provides data and insights            advice to policy makers and development
to corporates, development finance institutions,            partners.
governments, and investors.

                                                                                                            I
Executive Summary
Is there a gender gap in financing Africa’s                 In our sample of 172 entrepreneurs, male and
early-stage ventures? And are there differences             female founders followed different financing
between female and male founders—such as the                paths. Female founders in our sample were less
sectors they choose, or the ambitions they                  likely to pitch for equity investments than male
have—that could explain divergent funding paths?            founders. Conversely, they were more likely to apply
As start-up financing in Africa keeps climbing to new       for bank loans, or to prefer growth from retained
records, these questions are becoming more                  earnings. Among companies that raised external
urgent. To find answers, we leveraged Briter Bridg-         financing, however, those with all-male founding
es’ leading industry platform to comb through years         teams received higher amounts of both equity and
of deal flow data and surveyed a random sample of           debt.
172 entrepreneurs operating across the continent.
                                                            A confidence gap separates female and male
Here is what we learned:                                    founders in our sample. Female survey respond-
                                                            ents showed less confidence in their ability to pitch
Female founders receive only a small fraction of            to investors and in their firms’ ability to grow. This
the total investment in African technology (tech)           confidence gap is despite the fact that women entre-
firms. Our analysis of start-up financing deals since       preneurs in the sample were more educated, had
2013 shows that only 3 percent of funding went to           the same amount of professional experience as male
all-female founding teams, compared with 76                 founders, and experienced similar revenue changes
percent of funding that went to all-male teams. The         in the previous year.
amount of funding they received is disproportion-
ately small because 11 percent out of the 2,400             Female entrepreneurs pay it forward. Companies
companies for which demographic information was             led by female founders in the survey were twice as
available are all-female teams. And, although invest-       likely to hire women, and four times as likely to
ment in the African tech space has skyrocketed              employ female managers.
since 2013, the proportion going to all-female
founding teams has changed very little.                     It is worth highlighting the limits of what our data can
                                                            show. Although Briter Intelligence is among the
Female founders are underrepresented in the                 most comprehensive and frequently updated data-
sectors that attract the most financing. This               bases on the tech industry in emerging markets, it
underrepresentation is partly because there are             cannot claim to be exhaustive. Demographic infor-
more male than female founders are also more likely         mation is available for a substantial subset of found-
to operate in subsectors that attract less investment,      ers, but not all, and financing deals are included only
such as edtech or healthtech. However, even when            if they have been publicly disclosed. In the founder
they work in sectors with high investor interest,           survey, a sample of 172 limited our analysis to report-
all-female teams are still less likely to receive financ-   ing key differences. Also, the analysis cannot differ-
ing than all-male teams, and they receive smaller           entiate in every case if the differences between
amounts if they do receive financing.                       female and male founders are a cause or a conse-
                                                                                                                II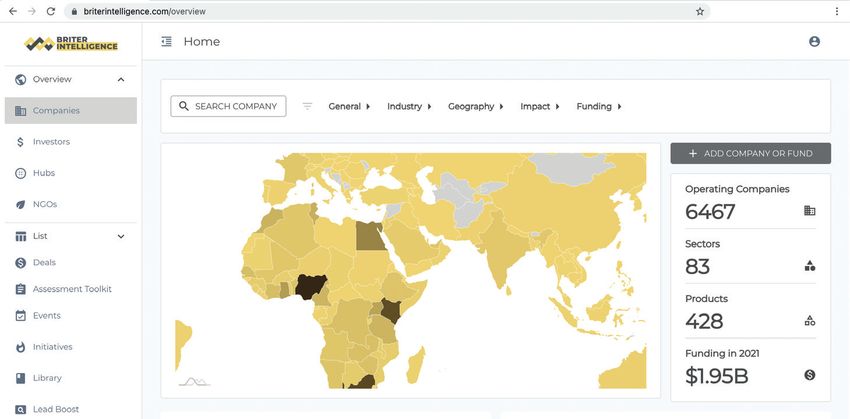
quence of the financing gap—or neither. Still, we     finance deserve to be at the top of everyone’s
believe that our results provide valuable insights    mind, given the size of the gender gap in start-up
into Africa’s start-up scene as a whole and prepare   finance at the moment.
the groundwork for additional research.

Our findings complement studies that have
shown a gender gap in access to start-up finance
in other parts of the world. And they point to
similar drivers: female founders are generally
underrepresented in the tech industry, they lead
smaller   firms,   they   are    concentrated    in
lower-growth sectors, and they have (or show)
less confidence in their abilities. However, the
report’s insights also raise important new ques-
tions. Are female founders less likely to seek
equity investments because they prefer organic
growth and greater control, or because they are
not adequately served by equity investors? Does
gender bias—an issue raised by some of the entre-
preneurs featured—play a role in this context? The
report does not answer these questions, but it is
hoped that future research—including some of
our own ongoing studies—will fill in these blanks.

In the meantime, our findings hold some initial
takeaways for practitioners who work to promote
gender equity in Africa’s start-up ecosystems.
Encouraging more women to launch entrepre-
neurial ventures may be at least as important as
supporting those who already do—but the choice
of sector matters. Traditional business training
does not appear to be a priority for female found-
ers who are already highly educated, while help
with raising funds and talking to investors might
close a gap. A more inclusive entrepreneurial
culture — as well as financing options that go
beyond traditional debt and equity — would help
accommodate the diverse backgrounds and
aspirations   of   founders.    Most   importantly,
perhaps, initiatives to increase women’s access to
                                                                                                     III
Industry data

                                                                     1,112
                                                                                                                     funded companies
                                                                                                                     operating in Africa.

                                                                     $1.7
                                                                                                                     billion raised
                                                                                                                     across 1,585 deals
                                                                                                                     January 2013 - May 2021
                                                                      * Excluding outliers (series B or $20 million above rounds)

FUNDING BY TEAM                                                       TOP FUNDED SECTORS                              TOP FUNDED AFRICA HQ

  Mixed                                        All-female                       Fintech                                           South Africa

                                                                                Cleantech                                         Nigeria

                                                                                Agriculture                                       Egypt, Arab Rep.

                                                     All-male                   E-commerce                                        Kenya

                  Survey data

 STUDY SAMPLE                                                                         CONFIDENCE WITH PITCHING
          Sampling frame       Survey participants                                             Female      Male
                                                                                                50

                                                                                                40
            80
                                                                                                30
            60
                                                                                     Percent
Percent

                                                                                                20
            40
            20                                                                                   10

             0                                                                                   0
                    All-male          All-female        Mixed                                           Very low    Low       Moderate       High      Very high
                                       Team                                                                                Confidence level

FINANCING MIX OF COMPANIES                                                            CONFIDENCE WITH PROFITABILITY
          Neither debt not equity      Equity only                                             Female      Male
          Debt and equity              Debt only

            100

                                                                                                50
             75
                                                                                                40
Percent

                                                                                      Percent

             50                                                                                 30
                                                                                                20
             25
                                                                                                 10

              0                                                                                  0
                        All-female             Mixed            All-male                                 Very low    Moderate        High           Very high
                                            Team                                                                          Confidence level

                                                                                                                                                                   IV
Table of Contents
Acknowledgements ...................................................................... I
Executive Summary ....................................................................... II
1 | Introduction .............................................................................. 2
2 | What We Know About Financing Female Founders ....................... 4
3 | Quantifying Africa’s Gender Gap in Startup Financing ................... 9
4 | Key Differences between Male and Female Founders .................... 17
5 | Conclusion .............................................................................. 32
Notes ......................................................................................... 37
References .................................................................................. 39
11 Introduction
Africa’s start-up scene is booming, fueled by a The report’s analysis shows that female founders
rush of new funds from local and international are underrepresented in the sectors that attract
investors alike. Yet, female founders risk losing the most financing; however, even those all-fe-
out. Previous analysis by Briter Bridges (2020) male teams that are working in sectors with high
suggests that male entrepreneurs accounted for a investor interest remain less likely to receive
disproportionate share of early-stage venture financing than all-male teams, and they receive
financing in Africa in 2019–20. This is in line with smaller amounts if they do. Male and female entre-
IFC (2019) estimates that only 7 percent of total preneurs in the report’s sample also followed
investment in emerging markets is going to different financing paths: female founders were
female-led businesses. less likely to pitch for equity investments;
conversely, they were more likely to apply for bank
Unequal access to start-up financing is problemat- loans, or to prefer growth from retained earnings.
ic for several reasons. Most immediately, it
presents an obstacle for female founders trying to The report leverages Briter’s leading industry
grow their firms to their full potential. It also platform and also draws on an online survey of 172
matters from the point of view of capital efficiency, randomly selected founders of African firms—fe-
with investors leaving money on the table when male and male, and at various points in their
they skip over female entrepreneurs who promise financing journeys. Additional context on the data
1
higher returns. And there are macroeconomic and what it can (and cannot) say can be found at
implications as well: given the key role of the beginning of sections 3 and 4. The analysis is
high-growth industries in the future economy of restricted to the demand side of start-up finance
the African continent, flawed investment deci- and does not discuss the ways in which finance
sions today are likely to contribute to greater providers—from angel investors to development
inequality down the road. These concerns are finance institutions—are already tackling the
particularly salient during the COVID-19 pandem- gender divide. In Search of Equity expands on
ic, with start-up finance peaking
1
at a time when Briter’s 2020 Gender and Demographics report
female-led businesses appear to be suffering and builds on the World Bank’s Africa Gender
disproportionally (Hyland et al. 2021). Innovation Lab’s (GIL) work under the Innovations
in Financing Women Entrepreneurs initiative.
In Search of Equity presents a first diagnostic of While further research awaits, these initial results
Africa’s gender gap in financing early-stage represent a useful resource for investors, policy
ventures in the digital economy (start-ups). The makers, and researchers—many of whom care
report’s findings indicate that since 2013, only 3 about gender equity in start-up financing but have
percent of total funding for Africa’s tech start-ups had little evidence to guide them so far. Just as
went to all-female founding teams, compared importantly, the report’s insights hopefully will be
with 76 percent of funding for all-male teams. of interest to the founders themselves.
2The report is divided into five parts. Section 2
provides the necessary context to interpret the
results, summarizing what is known (and what is
not known) when it comes to financing female
founders in Africa. Section 3 looks at Briter’s
industry data to establish how start-up financing
differs between male and female founders across
industries and over time. Section 4 then presents
the results of the founder survey, comparing the
financing journey of female and male founders
and highlighting similarities and differences
regarding professional backgrounds, financing
choices, and personal ambitions. Section 5 offers
concluding thoughts on how to tackle this gender
gap—and the additional data and analysis
required in the process.
3What We Know About Financing
2 Female Founders
Whether they are developing products, hiring ation Lab (GIL) research has documented large
talent, or expanding to new markets, most entre- gender differences in the size of outstanding
preneurs require outside capital to grow and loans for female entrepreneurs across Sub-Saha-
succeed. Founders who cannot—or do not want ran Africa, impacting women’s ability to use
to—rely on retained earnings can turn to a variety financing productively to grow their businesses
of external financing sources including bank (World Bank 2019).
loans, equity investments, and quasi-equity instru-
ments. However, studies show that globally, both By contrast, less is known about the gender
debt and equity financing disproportionally flow dynamics at play when African entrepreneurs try
to male-led firms, limiting the potential of female to access equity and other forms of early-stage
founders to grow their firms. The literature also venture capital. However, global data suggests a
highlights a number of likely causes for the highly unequal distribution of venture capital
uneven distribution of start-up capital. flows to male and female founders. A recent study
by the IFC (2019) concludes that about 7 percent
This section briefly reviews the evidence on this of private equity and venture capital in emerging
topic. Because little has been written about markets (and about 6 percent in Sub-Saharan
financing female start-up founders in Africa specif- Africa) goes to female-led firms. Furthermore,
ically, we draw instead on two other bodies of only 2 percent of female-led SMEs polled in a
research: the literature on financing African small recent global survey were found to use venture
and medium enterprises (SMEs), and the debate capital to fund their businesses, compared with 5
on gender and venture finance in other regions. percent of male-led SMEs (Facebook et al. 2018).
There exists a gender gap in financ- This gender gap in equity financing is observed
ing entrepreneurs, both in Africa and across all stages of investment financing and
beyond. appears to increase with subsequent funding
rounds. Pitchbook (2019), an aggregator for
Considerable research exists on the gender gap venture capital data, estimates that in 2019, the
in accessing conventional, debt-based finance in share of financing going to companies with at
Africa. Data from the World Bank’s 2018 Global least one woman on the founding team dropped
Financial Inclusion database (Findex) on Sub-Sa- from 11 percent at the seed capital stage to just 5
haran Africa shows that the share of women percent in later funding rounds. This drop is to be
receiving a loan from any source was five percent- expected because later-stage financing deals are
age points lower than that of men (43 percent of predicated on early-stage deals. However, it also
women versus 48 percent of men). Moreover, represents a concerning dynamic for female
women tend to have fewer assets and savings founders because investment amounts typically
than men, which limits the value of collateral increase over subsequent rounds.
against which they can borrow. Gender Innova-
4This gender gap appears to be driven Research points to a number of factors as potential
by a combination of firm characteris- drivers of the gender gap in business financing.
tics, founder attributes, and investor With outright legal discrimination — such as
bias. restrictions on women’s ability to run a firm or open
a bank account without a husband’s approval—on
The literature suggests that the gender gap in the decline, these explanatory factors can be divid-
entrepreneurial finance is not driven by a single ed into three groups. It is important, however, to
cause but rather by a combination of factors. An keep in mind that is it hard to disentangle which of
obvious starting point is the underrepresentation these factors could be drivers, be interconnected,
of women among founders of early-stage firms. be consequences of being underfunded, or be a
According to a study by the Silicon Valley Bank combination of all three of these.
(2019), only 28 percent of start-ups surveyed
across four major economies had one or more A first set of factors encompasses firm characteris-
female cofounders. African economies are known tics. Evidence from several countries highlights
for relatively high numbers of female entrepre- that male and female founders tend to lead differ-
neurs, yet many of these are microentrepreneurs or ent types of firms, and that these differences
own service businesses with limited potential for influence the extent to which the firms require—or
scale and appeal for venture capital. The share of are able to attract—outside financing. This
female cofounders of early-stage firms in evidence includes the following different firm char-
high-growth, technology-driven industries remains acteristics:
low: Briter Bridges (2020) found that women made
up 16 percent of founders across the firms for which Female-owned firms are smaller and
demographic information was available. more likely to be informal.
Research shows that firms with majority-female
The limited participation of women in Africa’s ownership account, on average, for 20 percent of
growing tech scene is a major constraint on the firms in the formal economy with 10 or fewer
“pipeline” of investable female-led start-ups, and employees, but that they account for only 17
the reasons for this imbalance warrant their own percent of firms with 100 employees. They are also
investigation (for an introduction, see Powell and more likely to operate informally: only one-third of
Chang 2016). However, there are indications that formal firms with five or more employees have any
the lower number of female founders is not the only female ownership, even though women own
factor at play. IFC (2019) data shows that female about half of firms in Sub-Saharan Africa (World
founders who receive financing tend to obtain Bank 2019).
smaller amounts than their male counterparts. A
separate IFC study, with support from GIL, finds Female-owned firms are more likely to
that female founders whose firms go through accel- finance their business with internal funds. In the
erator programs receive less equity financing than United States, female founders tend to be more
male founders in the same cohorts, and are more reliant on owner’s equity and retained earnings
likely to fall back on debt-based financing (IFC than male founders. Female entrepreneurs are
2020). more likely to “bootstrap” their firms to avoid
5raising debt, whereas male founders are more Women are less likely to be serial entre-
likely to use their own funds in addition to external preneurs, who are often favored by investors.
financing (Neely and van Auken 2010). Research in the United Kingdom found that only
about 19 percent of serial entrepreneurs are
Female-owned firms tend to cluster in women. Studies in other regions have determined
sectors that are generally less profitable. that firms started by experienced entrepreneurs
Evidence shows that female entrepreneurs in Africa raise more funding rounds compared with their
are more involved in the retail and services sectors, earlier ventures. Investors are likely to invest in
which are less capital-intensive and have fewer founders with previous exits because they feel
barriers to entry. On the other hand, female entre- those founders’ track records are an indicator of
preneurs are less involved in the transport, manu- the potential for future success (Centre for Entre-
facturing, and construction sectors than male preneurs 2016).
entrepreneurs—sectors in which firm profits tend
to be higher (Goldstein, Martinez, and Papineni Female business owners often show less
2019). confidence than male business owners.
Research has shown that female entrepreneurs
A second set of factors relate to characteristics of demonstrate less confidence in their abilities,
the founder. Research suggests that especially in which may make them less willing to compete
early-stage firms, the personal attributes and (Niederle and Vesterlund 2007). A study with
endowments of the entrepreneur can influence the entrepreneurs in Ghana, for example, showed that
firm’s level of effort to raise financing and its chanc- women are 14 percent less likely than men to think
es to be successful. In this regard, studies show the they would make a good leader (Zhang 2011).
following:
In addition to these characteristics, the literature
Women tend to have lower levels of on gender and entrepreneurship also emphasizes
secondary and tertiary education than men. societal and household constraints that dispropor-
Evidence points to gaps between male and female tionally affect female founders. Such constraints
entrepreneurs in formal education, management include social norms that discourage women from
skills, and socioemotional skills (World Bank 2019). setting up a business, home and childcare respon-
sibilities that limit the time they can spend on their
Women tend to have smaller networks companies, or competing claims over their finan-
than men, and their networks are mostly com- cial assets and autonomy (for an overview of this
posed of other women. Research on firms in research, see World Bank 2019). The report’s
Sub-Saharan Africa shows that business networks analysis does not dive into these contextual
are mostly segregated by gender and that men’s factors, although the authors acknowledge that
networks control more resources (World Bank they may influence both how men and women
2019). Furthermore, evidence shows that a close approach entrepreneurship and what types of
connection to a venture capital firm is more impor- firms they found and lead.
tant for female entrepreneurs than for male entre-
preneurs (Tinkler et al. 2015).
6Although the first two sets of factors consider the when talking to female founders. In addition,
firms and their founders, a third explanation focus- research suggests that demonstrating stereotypi-
es on the extent to which investor bias against cal feminine behavior during a pitch affects the
women — whether conscious or unconscious — outcome because it negatively affects the entre-
affects financing decisions. Unconscious bias preneur’s perceived business competence,
against female loan applicants has been shown to preparedness, and leadership (Balachandra et al.
result in higher rejection rates for female borrow- 2019).
ers (Montoya et al. 2020), lower amounts of credit
granted (Alibhai et al. 2019), and higher levels of Investors have been shown to value educational
collateral required (Brock and de Haas 2021). backgrounds differently for female and male
Although some authors find that the bias against founders; for example, male entrepreneurs with
female loan applicants is driven primarily by male nontechnical backgrounds were seen as having
employees, others find that bias is rooted in higher leadership abilities than men with techni-
institutional norms and it is common among both cal backgrounds, but concurrently, women with
female and male staff. nontechnical backgrounds were seen as less com-
petent than women with technical backgrounds
Gender bias also seems to be at play for equity (Huang 2020). Likewise, investors seem to doubt
investors—unsurprisingly perhaps, considering the ability of female founders to succeed in
the more subjective, less standardized deci- male-dominated industries, but not, conversely,
sion-making process involved. In particular, the ability of male founders to serve female-domi-
early-stage financing is an industry built on subjec- nated sectors—resulting in smaller investments
tive perceptions of the potential of founders, at a and lower valuations (Kanze et al. 2018). As in the
time when their firms rarely have a long track case of bank staff, there is evidence that the
record. This process creates a risk that investors gender of investors matters as well: IFC (2019)
will follow perception patterns and continue to be data suggests that female partners at investment
attracted to the same kinds of companies that firms are twice as likely to invest in female found-
have been supported before, leaving female ers as their male counterparts.
founders behind (Lefcourt 2021).
With early-stage financing for African starts-ups
Research on U.S. venture capital highlights ways having increased dramatically over the past
in which investors tend to favor male founders. A decade, it is worth investigating whether similar
study by Brooks et al. (2014), drawing on data gender dynamics are at play in this context. The
from pitch competitions as well as two controlled insights outlined previously guide the exploration
experiments, finds that investors prefer pitches by into the distribution of start-up finance between
male entrepreneurs to pitches by female entrepre- male and female founders. Therefore, the follow-
neurs, even when the content is identical. Kanze ing section uses comprehensive deal flow and
et al. (2018) observe that investors use different demographic data to quantify the gender gap and
framing for male-led and female-led start-ups, highlights a couple of aggregate-level factors,
asking male founders about the perceived poten- such as sector and geography, that may be
tial of their firm but posing questions about risk contributing to the gap.
7Section 4 then presents findings from a survey
completed by 172 cofounders that provides
important insights on firm and founder character-
istics. Because the report’s focus is on the entre-
preneurs rather than their funders, the report does
not say much about the prevalence of gender bias
among investors; however, short profiles of
female founders interspersed across the two
sections highlight that gender-based prejudice is
a common experience.
83 Quantifying Africa’s Gender
Gap in Start-up Financing
Do Africa’s technology (tech) start-ups experi- ing provided to male and female founders
ence a gender financing gap similar to the ones across the continent based on a comprehensive
observed in other regions? In the first empirical set of deal flow data collected by Briter Bridges
section of this report, we answer this question (box 3.1).
by uantifying the differential between the fund-
Box 3.1. Briter Intelligence
Briter Intelligence provides access to data on start-ups in the technology, digital,
and green space, as well as on hubs, investors, and ecosystem supporters. As of
September 2021, the database includes more than 6,500 companies with an
operational focus on Africa, more than 1,100 investors, 900 hubs, and counts 85
sectors and 430 subsectors. Briter Intelligence is the result of Briter's data collec-
tion efforts to map the start-up and support ecosystem in Africa. Data points
include the sectors that companies operate in, their geographic focus, funding
details from angel and pre-seed to initial public offering (IPO) stage deals, as well
as (for a subset of 2,397 firms) the gender and educational backgrounds of all
active cofounding members of the start-up teams. It is worth bearing in mind that
demographic information is available for a substantial subset of founders but not
for all, and financing deals are included only if they have been publicly disclosed.
Figure 3.1.1. Briter Intelligence Landing Page
9Funding for African tech firms
mostly goes to all-male founding Figure 3.1. Sum of Funding by Team
teams — by a wide margin Without controls With controls
Briter Bridges’ deal flow data shows that, 100
between January 2013 and May 2021, a total 75
Percent
of 1,112 start-ups operating across Africa
50
raised the combined amount of US$1.7 billion
in early-stage financing (angel investment to 25
2
Series A). Among these firms, 75 percent had 0
All-female All-male Mixed
all-male teams, 9 percent had all-female
Team
teams, and 14 percent had mixed founding
3; 4
teams. Investments into all-female teams
made up only 3 percent of the US$1.7 billion,
compared with 76 percent of investments
going to all-male founding teams (figure 3.1). Figure 3.2. Number of Deals by Team
In other words, for each US$1 going to all-fe-
Without controls With controls
male founding teams, all-male teams received
US$25. This discrepancy is mirrored in the
80
number of deals that involved female found-
60
Percent
ers—all-female teams accounted for 6 percent
and mixed teams accounted for 12 percent of 40
the number of deals (figure 3.2). 20
0
These numbers must be seen in light of the All-female All-male Mixed
lower number of female teams operating in Team
this space. However, all-female founding
teams still seem to be under-funded once the
general underrepresentation of female found-
Figure 3.3.
ers is factored into the analysis. Among all
Demographic Information for Teams
founding teams for which Briter Bridges has
collected demographic information, 77 100
percent are all-male, 11 percent are all-female,
5 75
and 12 percent are mixed (figure 3.3). This
Percent
implies that all-female founding teams receive 50
less investment than would be expected from 25
their share of the overall population, while
0
mixed teams receive more (see section 4 for a All-female All-male Mixed
discussion of mixed teams). Team
* Figure depicts sampling frame data
10There is little indication that this financing gap will A look at the sector distribution of the 1,112 firms
go away over time, despite the fact that funding that received early-stage financing since 2013
for African tech firms has increased steadily since shows that a few sectors (or verticals) account for
2013. While the financing received by all-female the lion’s share of total funding (see box 3.2 for a
founding teams has grown in absolute terms description of these subsectors). These subsectors
during this period, their share of total financing seem to be more male-dominated than the indus-
has remained marginal throughout (figure 3.4). try as a whole. All-female founding teams make up
All-female founding teams never received more just 3 percent of the investment into fintech com-
than 5 percent of total funds in any given year, and panies, and not even 1 percent of the investment
6
all-female and mixed founding teams together into cleantech (figure 3.6). Jihan Abass, founder of
never obtained more than 20 percent. In 2020, the Kenyan insurance platform Lami, suggests that
all-male founding teams captured 84 percent of female founders in fintech seem well aware of their
the funding, mixed teams captured 13 percent, pioneering role (see box 3.3.).
and all-female teams captured 3 percent. As of
May 2021, funding has already surpassed the On the other hand, verticals with an above-aver-
previous year’s levels, with allocation of funding age share of female founding teams—such as
standing at 88 percent to all-male teams, 10 education and health—received much less inves-
percent to mixed teams, and less than 1.5 percent tor interest. In addition, even in subsectors with a
to all-female teams. larger share of female founders, the gender financ-
ing gap remains: all-female founding teams do not
Female founders are underrepre- receive more funding compared with the industry
sented in the sectors that attract the average, even in sectors that see substantial
most financing engagement from female founders.
Figure 3.4. Distribution of Deals across the Years
All-female
All-male
500M
Mixed
All-male
400M 100
Deal sum ($)
Deal sum (%)
300M 75
200M 50
100M 25
Mixed
0 All-female
0
2018
2019
2020
2014 2016 2018 2020
2013
2015
2016
2017
2014
Deal year Deal year
11Box 3.2. Sector Distribution: Funding Funded sectors: sum with outliers
Entertainment
Jobs
Agriculture 1.7%
2.3%
Logistics
Companies using technology to improve efficiency, output and 3.4%
profitability of agricultural processes, for instance farm management Education
Fintech 3.9%
apps, weather and forecasting software, or online marketplaces. 33.1% Mobility
Cleantech 3.9%
Health
Designers, developers and distributors of green, sustainable and 4.5%
E-commerce
clean energy solutions, such as solar home systems or biofuel. 6.1%
Agriculture
9.4%
E-commerce Cleantech Other
Online platforms that facilitate the purchase and sale of products for 16.6% 15.2%
individuals and companies, for instance for general retail or
classifieds.
Education
Digital platforms, software and hardware that facilitate access and
quality of learning, such as e-learning tools or school management
Funded sectors: sum w/o controls
solutions.
Entertainment Mobility
2.2%
Platforms and online websites that offer streaming of TV, movies, Entertainment Insurance
videos, and music, or digital access to books and video games, as 0.8% 2.6%
well as social media solutions. Logistics
3.0%
Fintech
6
Agriculture
4.3%
Digital products and services that digitize financial processes, Education
including payment aggregators or personal finance and budgeting Fintech 4.6%
tools. 42% Other
4.8%
Health Health
5.2%
Platforms, software and hardware that connect healthcare
providers to patients, such as telemedicine solutions, appointment Cleantech
12.4%
booking websites, or wearables providers.
E-commerce
Jobs 18.2%
Online marketplaces and job boards that match jobseekers to
employers and recruiters, such as formal employment, blue collar
gigs or freelance work.
Logistics Funded sectors: number of deals
Companies offering the management, storage, and movement of
goods, such as delivery providers, supply chain management
Jobs
software or addressing systems.
3.3%
Mobility Logistics
4.3%
Platforms that connect individuals to transport services, such as Other Education
29.9% 6.3%
ride-hailing services, carpooling, or public transport ticketing Agriculture
solutions. 6.8%
Cleantech
Other 7.7%
Includes all sectors not included in the top funded sectors, such as E-commerce
big data and analytics, internet of things, legaltech, manufacturing, Fintech 9.1%
media, or waste management companies. 22.9%
Health
9.6%
12Figure 3.5: Figure 3.6:
Distribution of teams by sector Funding by sector and team
All-female Mixed All-male All-female Mixed All-male
Agriculture Agriculture
Cleantech Cleantech
E-Commerce E-Commerce
Education Education
Sector
Fintech Entertainment
Sector
Health Fintech
Jobs Health
Logistics Jobs
Mobility Logistics
Waste management Mobility
0 25 50 75 100 0 25 50 75 100
Percent Deal sum (%)
* Figure depicts sector data from the sampling frame, irrespective of funding data.
Box 3.3. Founder Profile: Jihan Abass
Jihan Abass is a female founder and the CEO of Lami, an insurance-as-a-service start-up
based in Kenya with an application programming interface platform that uses technology
to deliver insurance products to anyone, anywhere. Currently, less than 3 percent of the
population in Africa benefits from insurance. Lami is attempting to close this gap by
addressing the high cost involved in the distribution of insurance products for risk carriers,
the lack of variety of relevant and well-priced insurance products for end customers, and
the difficulty that digital platforms and banks face in embedding insurance products in
their offering.
Lami launched its insurance product in January 2020. The product had only been on the
market a few months before the COVID-19 pandemic struck, plunging the company into a
remote working culture from the get-go. Although company culture has needed some
additional care in 2021, its product has grown significantly.
13In May 2021, Lami made headlines when it raised its
first institutional round of US$1.8 million. Prior to the
fundraise, Lami had received a grant from the Catalyst
Fund and was otherwise funded by savings and contri-
butions from Jihan Abass’s family. As the company
grows, the next step in Lami’s funding journey will be a
larger round of equity financing.
The fundraise was a huge milestone for Abass and her
team. Abass is making strides in a sector primarily
founded by men, due in part, suggests Abass, because
there are less women in the space.
She explains: “I think although not many fintechs are founded by women, there are some
businesses (although still a small number) that have women in the leadership team, which
I think is positive. I think the lack of female founders is partially driven by the fact there
aren’t that many women in the finance and technology space in general.” Abass contin-
ues: “I think encouraging girls from a young age to enter the STEM field could be helpful
in addressing this gap. . . Abass continues: “I think encouraging girls from a young age to
enter the STEM field could be helpful in addressing this gap. . . . Having relevant work
experience and industry knowledge in the sector your start-up is tackling could play a key
role in understanding the problem you’re trying to solve. . . . Furthermore, I think entre-
preneurship isn’t really presented as an option to girls at an early age and doing so could
help improve the number of women in the space. . . . Having female entrepreneurs
mentor students and younger entrepreneurs could help them see that entrepreneurship is
a viable option and not as risky or scary as it may seem.”
14Where the company is headquar- players, start-up ecosystem growth, and support
tered matters, for both male and from local and global investors.
female founders
The analysis looks at funding to companies whose
operational focus is in Africa, and many of these
7
firms are headquartered outside the continent.
Excluding outliers, the United States (23
percent), South Africa (12 percent), Nigeria (11
percent), the United Kingdom (11 percent), the
Arab Republic of Egypt (9 percent), and Kenya (6
percent) are the top-funded headquarters across
the sample, receiving the highest values of deals
and number of deals over the period (figure 3.7).
Companies headquartered in the United States
and the United Kingdom thus make up about
one-third of all investments.
About two-thirds of all-female funded teams are
based in the United States and the United King-
dom, compared with 32 percent and 48 percent
of all-male and mixed teams, respectively, show-
ing that the number of all-female teams shrinks
considerably if companies headquartered in
Africa are considered. All-female teams make up
less than 1 percent of the total investment once all
internationally headquartered companies are
excluded.
With regard to the African headquarters, Egypt,
Kenya, Nigeria, and South Africa are leading the
funding race, with similar trends apparent for the
operational geographies of the companies that
have raised funding, suggesting that key areas of
expansion are selected nodes throughout the
region where digital and technological innova-
tions and funding go hand in hand. Beyond the
usual suspects, countries such as Côte d'Ivoire,
Ghana, Morocco, Senegal, and Uganda are on
the rise with regard to the expansion of global
15Figure 3.7. Headquarters: Sum of Funding
0 $390M
Chapter Takeaways
1 | All-male teams in Africa make up the vast majority of deals and overall volume invested.
2 | Even though there are far fewer all-female teams in Africa, they are disproportionately
underfunded compared with mixed or all-male teams.
3 | The financing gap between all-male and all-female teams appears to be unchanged in
recent years.
4 | The largest amount of financing goes to firms in fintech, an industry vertical that has a
greater share of all-male founding teams than the industry average.
5 | The financing gap widens when internationally headquartered companies are exclud-
ed because very few female-founded companies that received financing are headquar-
tered in Africa.
16Key Differences between
4 Male and Female Founders
Section 3 provided an overview of where funding Who are the founders in Africa’s technology (tech)
flows in Africa. Over the past nine years, invest- industry? To get a more detailed picture, the
ment has gone disproportionally toward founders of companies listed on Briter Intelli-
male-founded companies, companies working in gence were invited to participate in this study. To
financial technology (fintech), and those compa- find the right respondents, researchers consid-
nies headquartered abroad. However, important ered companies in the database that had an oper-
questions remain. Do female founders apply for ational focus on Africa and that had provided
financing at similar rates compared with male contact information, as well as demographic infor-
founders? Are female founders less qualified or mation, for the founding team. These criteria
experienced, and do they have different ambi- narrowed down the sample frame to 2,397 com-
tions for their businesses? This section aims to panies (figure 4.1). Of those firms, 1,112 had
8
provide answers to these more nuanced ques- disclosed funding information—the rest had not.
tions by highlighting responses from a survey of From the disclosed and undisclosed lists, 500
male and female founders. companies were randomly sampled from each,
for a total of 1,000 companies. From this list, a
For a better picture of Africa’s tech total of 172 respondents (each representing a
9
start-ups, 172 randomly selected unique company) completed the survey.
founders were surveyed
Figure 4.1. Sampling Data
Briter’s database of 6,500+ digital and green
companies in Africa
2,397 digital and green companies with
comprehensive demographic information
1,000 randomly selected companies invited
to take the survery
172 surveys completed
17Women and female-founded compa- The respondents’ companies are primarily small
nies are disproportionately repre- to medium-size start-ups that are on average 5
sented in the survey findings, but years old with an average of 25 employees, and
respondent companies represent they work in a variety of subsectors (figure 4.3)
companies from the larger database and headquarter countries (figure 4.4). They
to a reasonable extent in terms of represent companies from the larger database of
age, size, sector, and geography 2,400 well because most of the companies in that
database are early-stage, small to medium-size
From the 172 respondents that completed the companies, and they have similar distributions of
survey, 108 are men (63 percent) and 64 are sectors and headquarters.
women (37 percent). The respondents come from
63 all-male-founded companies (37 percent); 24 The following sections present differences
all-female-founded companies (14 percent); and between male-founded companies, mixed-team
85 female/male cofounded companies (mixed companies, and female-founded companies
teams, 49 percent) (figure 4.2). Therefore, female followed by differences between male and female
founders and their cofounding teams are overrep- founders. An important caveat is that any differ-
resented in the sample: out of the 2,397 compa- ences in the sample show a correlation and are
nies in the sampling frame, only 11 percent have not necessarily drivers of the gender gap in equity
all-female teams and another 11 percent have investment.
mixed cofounding teams, and only 16 percent of
the founders from the companies in the sampling
10
frame are females.
Figure 4.2. Sample Demographics of Survey Respondents
Sampling frame Survey participants Sampling frame Survey participants
100
80
75
Percent
Percent
60
50
40
25
20
0 0
All-male All-female Mixed Males Females
Team Team
18Figure 4.3. Sectors: Sample Comparison
Sampling frame Survey participants
30
20
Percent
10
0
Fintech
Education
Health
Marketing
Other
Jobs
Agriculture
E-commerce
Sector
Figure 4.4. Headquarters: Sample Comparison
Sampling frame Survey participants
30
20
Percent
10
0
Egypt, Arab Rep.
Ghana
Outside Africa
Uganda
Nigeria
South Africa
Kenya
Oth. African country
Headquarter country
Survey sample: Female-founded In addition, all-female teams are composed of two
companies have fewer employees founders on average, compared with three mem-
but tend to employ more women bers on an all-male team. Female-founded com-
overall and in management roles panies in the survey sample also seem to have
more female employees overall and in manage-
Male-founded companies in the survey sample are ment roles compared with mixed or male-found-
12
the largest in terms of employee count, with an ed teams (figure 4.6).
average size of 30 employees, which is twice the
11
size of female-founded companies (figure 4.5).
19Survey sample: Female-founded the need for it, or they had other reasons. Lillian
companies did not seek equity Madeje, founder of the Tanzanian talent manage-
investment as much as male-founded ment platform Niajiri (see box 4.1), suggests that
companies and they relied on debt or female entrepreneurs that prefer gradual growth
revenues for their financing needs. at present may still consider raising equity as a
long-term objective. For those female- founded
About 50 percent of all-female-founded compa- companies that did raise equity finance, friends,
nies in the survey sample tried to raise equity for family, and other individuals made up about 60
their companies, compared with 82 percent of percent of the investors, compared with 50
all-male-founded companies (figure 4.7). Respons- percent for male-founded companies and 44
es from female-founded companies indicate that percent for mixed-team founded companies, who
they either did not try to raise equity because they had a more diverse portfolio of investors (figure
preferred to reinvest earnings, they did not have 4.8).
Figure 4.5: Figure 4.6: Women
Co-founders and Employees Employees and Management
% of women employees % of women in management Number of co-founders Number of employees
80
30
60
Total number
Percent
20
40
20 10
0 0
All-female Mixed All-male All-female Mixed All-male
Team Team
Figure 4.7. Sought equity finance Figure 4.8. Investor Portfolio
Yes No, prefer bootstrapping Incubator/accelerator Development finance institution
No, other reason No, company had no need Venture capitalists Other indiviudals
Private equity firm Friends and family
100 100
75 75
Percent
Percent
50 50
25 25
0 0
All-female Mixed All-male All-female Mixed All-male
Team Team
20Box 4.1. Founder Profile:
Lillian Madeje
Lillian Secelela Madeje is the founder of and business
development lead at Niajiri Platform, an online talent
management company based in Tanzania. Niajiri
creates a streamlined and impactful process for
employers and recruiters to find talent, and for
jobseekers to gain soft skills and enhance employa-
bility. The company started as a passion project and
was part of Madeje’s master of business administra-
tion program.
The platform is primarily funded through bootstrapping, angel investment from family
and friends, and resources from Madeje’s previous company; however, in 2018, the
company was beneficiary of a grant that enabled the company to take the platform to the
next level. Madeje explains that while the influx of cash was vital to ensuring the develop-
ment and growth of the company, it was equally important to figure out how to build a
sustainable business. When the COVID-19 pandemic hit, the target market changed
because fewer companies were hiring. Although revenues took a hit, the crisis also
presented an opportunity for Madeje and the company’s team to look at their business
model from a new perspective. This opportunity spurred the development of a subscrip-
tion model that is being launched in the second half of 2021.
The team also recently joined an accelerator program, seizing every opportunity to learn
and to pivot its offering during an otherwise challenging time. “Being a female founder,
you have to be a go-getter,” explains Madeje. “It’s a big boys club, but once you get
there, it is also where I’ve found the most support. Put in the hard work, and let your work
speak for itself.”
21The medium- to long-term plan for the Niajiri team will be to actively seek out venture
capital (VC) funding, however, Madeje explains that for the moment, the company is
growing organically. With the launch of the model, it might seek out a loan for the first
time, and Madeje explains this is her preferred approach in the short term because it is
a faster process than pitching and waiting for funds. This approach will also enable the
Niajiri Platform to test assumptions of the new subscription model and to continue
growing while repaying the loan. Madeje suggests that this strategy will help prove
that the business model works, hence building a stronger business case before pitch-
ing to VCs for growth.
She also wants to be selective when possible. “With investment, I would prefer some-
one who offers funding and technical expertise as opposed to just funding. Money
gives financial security, but if I am to be serious about growth, I want to surround myself
with people who know more than I do in order to take it to the next level,” explains
Madeje.
13
About 50 percent of female-founded companies headquarter location) (figure 4.10). When asked
applied for debt financing, compared with 27 about how financing needs will be met in the next
percent of mixed-team founded companies and two years, 17 percent of all-female teams were
39 percent of male-founded companies (figure unwilling to disclose their plans (figure 4.11).
4.9). However, female-founded companies However, very few reported wanting to take out
received a small fraction of debt on average com- loans, and many hope to give away more equity
pared with male-founded companies, with or or rely on sales only.
without controls (such as age, company size, and
Figure 4.9. Applied for Debt Financing
Yes No, would be unsuccessful
No, other reason No, company had no need
100
75
Percent
50
25
0
All-female Mixed All-male
Team
22Figure 4.10. Total Debt Figure 4.11. Financing Needs in Two Years
Without controls With controls Unknown/undisclosed Require further loans
Require giving away more equity Require a first loan
Require giving away equity for first time Sales only
100
All-female
75
Team
Percent
Mixed 50
25
All-male
0
All-female Mixed All-male
0 1 2 3
Debt total (US$, millions) Team
Figure 4.12. Equity Investments
Without controls With controls
All-female
Team
Mixed
All-male
0 250K 500K 750K
Equity total (US$, millions)
Survey sample: Male-founded com- But factors such as the age, size, subsector, and
panies received about twice as much headquarter location of the company are impor-
in equity investment compared with tant determinants of investment amounts. After
mixed or female-founded compa- controlling for these factors, results showed that a
nies with similar characteristics male-founded team would on average receive
US$250,000 more in equity investments com-
When considering all companies in the survey pared with a female-founded or mixed-team com-
14
sample that tried to raise equity financing, compa- pany in the sample. Although this difference only
nies with all-female founding teams have a similar applies to a small number of respondents, it
average total investment compared with compa- echoes findings from the larger industry data in
nies with all-male founding teams (figure 4.12). section 3.
23Box 4.2. What about “Mixed” Founding Teams?
Research from the In Search of Equity survey shows that only 1 out of 10 founding teams in
Africa has both male and female cofounders (mixed). About 11 percent of Briter’s industry
data of 2,400 companies with complete demographic information are companies with
male and female cofounders, and women make up 60 percent of these mixed founding
teams on average. Among the survey sample, 40 percent of both employees and man-
agement teams are composed of women in the average mixed-team company. This data
suggests that mixed founding teams are more likely to hire women than all-male teams,
but they are less likely to do so than all-female teams.
Mixed teams do appear to get funded, and other studies show that they yield a higher
return on investment. Findings from Briter’s industry data show that mixed teams only
make up 11 percent of the teams in Africa, but that they do make up 14 percent of the
funded teams, and almost 20 percent of the total value of investment over the past eight
years, with funding toward them increasing over time. They appear to be clustered in
fintech, they are mostly headquartered outside of Africa, and they sought equity invest-
ment more often than debt—which may all be factors that contribute toward their over-
representation in deal flow data. However, it is likely that gender diversity in founding
teams could be a driving force, too. Studies outside of Africa show that gender-inclusive
founding teams have greater success in fundraising and innovation and have higher
profits than teams with lower percentages of women (Abouzahr et al. 2018; Hoogen-
doorn, Oosterbeek, and Van Praag 2013).
24Survey sample: Female founders Although there is not much rigorous research on
have better educational qualifica- the matter, the conventional wisdom in the tech
tions compared with male founders, industry seems to be that computer science or
but fewer female founders have software engineering is a more relevant degree
prior entrepreneurial experience for entrepreneurs in the field rather than business
studies. This thought may give male founders,
About 50 percent of male founders have a bache- who are overrepresented in these fields, an edge
lor’s degree as their highest educational degree, over female founders.
15
and 25 percent of them have a master’s degree.
On the other hand, about 34 percent of female Although both men and women in the survey
cofounders in the survey sample have a bachelor’s sample had an average of seven years of profes-
degree and 40 percent of them have a master’s sional experience, more men (69 percent) had
degree. This data is consistent with the larger been a founder previously compared with women
data set of 2,397 companies and their founders, (56 percent). In addition, 60 percent of women
in which more female founders have a master’s who have previous founding experience are still
degree compared with male founders (41 percent involved in those companies, compared with 53
16 17
versus 31 percent) (figure 4.13). Women and men percent of men (figure 4.15). In addition, 15
have similar degrees or specializations to some percent of women reported that their previous
extent, however, slightly more women have ness company closed, compared with 26 percent of
degrees whereas many more men have engineer- men. So, fewer women in the sample have previ-
ing or computer science degrees (figure 4.14). ous founding experience, and if they do have
previous experience, they are less likely to have
had failed ventures.
Figure 4.13.
Founders’ Level of Education
Female Male
50
40
30
Percent
20
10
0
No higher edu.
Unidentified
Certification
Diploma
Master’s
PhD
Bachelor
Level of education
25Figure 4.14.
Founders’ Academic Area of Study
Female Male
Accounting, actuarial studies, and finance
Agriculture
Art & design
Business
Computer science & software engineering
Computers, technology & information sciences
Construction, real estate & urban planning
Economics
Education
Engineering
Degree
Health & medical studies
High tech, mechanics & electronics
International relations & development
Languages & literature
Law
Logistics & supply chain
Marketing, media & communications
Mathematics & statistics
Sciences
Social sciences
Unidentified
0 10 20 30
Percent
Figure 4.15.
Founders’ Previous Start-Up Experience
Female Male
70
60
50
Percent
40
30
20
10
0
I exited the I sold the I’m still The company
company company actively closed down
involved
Involvement
26Survey sample: A confidence gap This finding suggests that men in the sample are
exists between female and male more optimistic about the future of their compa-
founders regarding their pitching nies in both the short- and long-term. To see if this
skills and their companies’ profita- reflects their companies’ performance, this gap
bility, despite similar performance was compared with the revenue change from the
over the past year previous year. Findings show that similar propor-
tions of both men and women reported a decrease
Survey respondents were asked to rate their level or an increase in the previous year’s revenue
of confidence in pitching to investors and in the indicating that their companies did not differ in
long-term profitability of their ventures—a clear performance the previous year as widely as the
confidence gap emerged. Only 5 percent of founders did with their expectations (figure 4.19).
women reported high confidence in their pitch- Although it is uncertain what drives the lower
ing skills, compared with 30 percent of men levels of optimism among female entrepreneurs, a
(figure 4.16). Similarly, men were about twice as profile of Gugulethu Siso, founder of Zimbabwean
likely as women to report very high confidence in logistics platform Thumeza, illustrates the addi-
the long-term profitability of their companies tional degree of doubt female entrepreneurs have
(figure 4.17). Also, respondents were asked about to face from male peers in sectors traditionally
their expectations for their companies’ revenue dominated by men (box 4.3).
growth over the next two years. Although most
founders have optimistic expectations, about 66
percent of women surveyed expect substantial
growth compared with 88 percent of men (figure
18
4.18).
Figure 4.16. Founders’ Confidence Figure 4.17. Founders’ Confidence
with Pitching to Investors in Profitability of Ventures
Female Male Female Male
50 50
40 40
Percent
Percent
30 30
20 20
10 10
0 0
Very low Low Moderate High Very high Very low Moderate High Very high
Confidence level Confidence level
27You can also read