WP/20/236 - Still Not Getting Energy Prices Right: A Global and Country Update of Fossil Fuel Subsidies - IMF ...
←
→
Page content transcription
If your browser does not render page correctly, please read the page content below
WP/20/236

        Still Not Getting Energy Prices Right:
A Global and Country Update of Fossil Fuel Subsidies

                       by Ian Parry, Simon Black, and Nate Vernon
2

© 2021 International Monetary Fund                                                                     WP/21/236

                                               IMF Working Paper

                                            Fiscal Affairs Department

Still Not Getting Energy Prices Right: A Global and Country Update of Fossil Fuel Subsidies

                           Prepared by Ian Parry, Simon Black, and Nate Vernon 1

                                   Authorized for distribution by James Roaf

                                                 September 2021
    IMF Working Papers describe research in progress by the author(s) and are published to elicit
    comments and to encourage debate. The views expressed in IMF Working Papers are those of the
    author(s) and do not necessarily represent the views of the IMF, its Executive Board, or IMF
    management.

                                                      Abstract

This paper provides a comprehensive global, regional, and country-level update of: (i) efficient
fossil fuel prices to reflect supply and environmental costs; and (ii) subsidies implied by charging
below efficient fuel prices. The methodology improves over previous IMF analyses through more
sophisticated estimation of costs and impacts of reform. Globally, fossil fuel subsidies were $5.9
trillion in 2020 or about 6.8 percent of GDP and are expected to rise to 7.4 percent of GDP in
2025. Just 8 percent of the 2020 subsidy reflects undercharging for supply costs (explicit
subsidies) and 92 percent for undercharging for environmental costs and foregone consumption
taxes (implicit subsidies). Efficient fuel pricing in 2025 would reduce global carbon dioxide global
carbon dioxide emissions 36 percent below baseline levels, which is in line with keeping global
warming to 1.5 degrees, while raising revenues worth 3.8 percent of global GDP and preventing
0.9 million local air pollution deaths per year. Accompanying spreadsheets provide detailed
results for 191 countries.

JEL Classification Numbers: Q31; Q35; Q38; Q48; H23

Keywords: fossil fuel subsidies; efficient fuel prices; supply costs; climate change; local air
pollution mortality; revenue gains; spreadsheet tools.

Author’s E-Mail Addresses: IParry@imf.org; Sblack@imf.org; NVernon@imf.org.

1   The authors are grateful to Danielle Minnett for excellent research assistance and to Paddy Blewer, Michael
Fulwood, Tatiana Khanburg, Antonio Peciccia, James Roaf, Paulina Schulz and Karlygash Zhunussova for helpful
comments and suggestions.
3
I. Executive Summary
Getting fossil fuel prices right is critical for efficiently allocating an economy’s scarce resources and
investment across sectors and activities- the efficient price includes both the supply and
environmental costs of fuel use. Underpricing leads to overconsumption of fossil fuels, which
accelerates global warming and exacerbates domestic environmental problems including losses to
human life from local air pollution and excessive and road congestion and accidents. This has long
been recognized, but globally countries are still a long way from getting energy prices right.
This updated analysis for 191 countries finds:
• Gaps between efficient prices and user prices for fossil fuels remain large and pervasive. No
country is fully pricing all fuels in line with their full supply and environmental costs. The largest
price gaps are generally for coal, followed by natural gas, diesel, and gasoline (Figure ES1).
Figure ES1. Gaps between efficient prices and user prices for fossil fuels by country, 2020
Source. IMF staff.
• Globally, fossil fuel subsidies are were $5.9 trillion or 6.8 percent of GDP in 2020 and are expected
to increase to 7.4 percent of GDP in 2025 as the share of fuel consumption in emerging markets
(where price gaps are generally larger) continues to climb (Figure ES2). Just 8 percent of the 2020
subsidy reflects undercharging for supply costs (explicit subsidies) and 92 percent for
undercharging for environmental costs and foregone consumption taxes (implicit subsidies).4
Figure ES2. Global Fossil Fuel Subsidies Over Time
Source. IMF staff.
Note. 2019 and 2021 onwards use projections for fuel use and fuel prices, respectively.
• Underpricing for local air pollution costs is the largest contributor to global fossil fuel subsidies
(Figure ES3), accounting for 42 percent, followed by global warming costs (29 percent), other local
externalities such as congestion and road accidents (15 percent), explicit subsidies (8 percent) and
foregone consumption tax revenue (6 percent).
Figure ES3. Global Fossil Fuel Subsidies by Component, 2020
Source. IMF staff.5
• Efficient fuel pricing by 2025 would reduce global carbon dioxide (CO2) emissions 36 percent
below baseline levels, equivalent to a 32 percent cut below 2018 levels. This is in line with
keeping global warming to ‘well below’ 2 degrees and towards 1.5 degrees (Figure ES4).
Figure ES4. Global CO2 Pathways for Temperature Targets
40
35
30
25
Billion tons CO2
20
2°C
1.8°C
15
1.5°C
10 Baseline
Historical
5 NDCs (as of Sept 23, 2021)
Efficient fuel pricing
0
2015 2020 2025 2030
Source. IMF staff and IPCC (2021).
Note. Warming pathways assume energy-related national CO2 emissions are reduced in proportion to total
greenhouse gas emissions. NDCs = Nationally Determined Contributions.
• Efficient fuel pricing would raise substantial revenues, worth 3.8 percent of global GDP (Figure
ES5), while averting 0.9 million premature deaths per year from local air pollution.
Figure ES5. Global Fossil Fuel Subsidies by Component, 2020
Source. IMF staff.II. Introduction
Getting fossil fuel prices right is critical for efficiently allocating an economy’s scarce resources
and investment across sectors and activities. The right price is the socially-efficient price that
reflects the full societal costs of fuel use—not just the supply costs (e.g., labor, capital, and raw
materials) but also the environmental costs, including carbon dioxide (CO2) emissions, local air
pollution, and broader externalities associated with fuel use (e.g., road congestion), as well as
general taxes applied to household products. Underpricing fossil fuels not only undermines
domestic and global environmental objectives but is a highly inefficient policy for helping low-
income households 2 and has a sizable fiscal cost—too little revenue is raised from fuel taxes,
implying other taxes or government deficits must be higher or public spending lower.
Fossil fuel price reform could not be timelier. All 191 parties to the Paris Agreement are
submitting revised mitigation pledges ahead of COP26 in November 2021—many have made
substantial commitments for 2030 and have specified emissions neutrality targets for mid-
century (Table 1, third and fourth columns). Meanwhile, local air pollution concentrations remain
stubbornly high, often far above safe levels recommended by the World Health Organization
(PM2.5 below 10 µg/m3), and air pollution causes substantial premature mortality in many
countries (Table 1, fifth and sixth columns). Government debt, moreover, is now at historically
high levels—mostly around 50-100 percent larger (relative to GDP) in 2020 than in 2007 (Table 1,
seventh and eighth columns).
The principle that fossil fuel prices should be set efficiently, and that fiscal instruments must be
central in ‘correcting’ the major environmental side effects of fossil fuel use, is well established.
Underpinning the policy recommendations is the notion that taxation (or tax-like instruments)
can influence behavior—in much the same way that taxes on cigarettes discourage their overuse,
appropriate taxes can discourage overuse of environmentally harmful energy sources. Putting
this principle in practice, however, requires a practical methodology and associated tools for
quantifying the efficient price, fuel by fuel, and country by country. This methodology can then
be used to assess the:
• Extent of price changes needed to reach their efficient levels through corrective taxes;
• Environmental, fiscal, health, and economic impacts of price reform; and
• Magnitude of current fossil fuel subsidies, which helps to inform and sharpen domestic
and international dialogue on the need for fuel price reform.
Although environmental costs are subject to uncertainty and controversy, they are a key
component of the societal costs of fossil fuel use and therefore it is important to factor an
unbiased estimate of them into fuel prices. A transparent and practical methodology enables
2 Across a wide range of countries, around 90 percent or more of the benefits from lower fuel prices accrue to
households in the top four income quintiles (e.g., Coady and others 2015).7
individual governments to infer efficient fuel prices, understand their key determinants, and
perhaps use their own judgement about some of the underlying parameter values.
Table 1. Climate, Air Pollution, and Fiscal Background, Selected Countries
Climate Targets Local air pollution Fiscal
Urban
Premature General
fine
deaths from government
Submission Neutrality particulate
Country Mitigation pledge for Paris Accordb fossil fuel debt (%
Rounda Target conc.
combustion, GDP)
(μg/m3),
2020 2007 2020
2020
Argentina Second Net emissions cap of 359 MtCO2e in 2030 2050e 12 18,319 62 103
Australia Second Reduce GHGs 26-28% below 2005 by 2030 na 7 5,129 10 63
Brazil Second Reduce GHGs 43% below 2005 by 2030 2050 12 84,043 64 99
Canada First Reduce GHGs 30% below 2005 by 2030 2050 7 9,779 67 118
China First Reduce CO2/GDP 60-65% below 2005 by 2030 2060 49 1,708,644 29 67
Costa Rica Second Net emissions cap of 911 MtCO2e in 2030 2050 18 1,491 27 68
e
Ethiopia Second Reduce GHGs 12.4%(41.1%) below BAU by 2030* 2050 34 78,247 42 55
France Second Reduce GHGs 55%c below 1990 by 2030 2050 11 22,793 65 113
Germany Second Reduce GHGs 55%c below 1990 by 2030 2045 11 43,407 64 69
India First Reduce GHG/GDP 33-35% below 2005 by 2030 na 78 1,664,565 74 90
Indonesia First Reduce GHGs 29%(41%) below BAU in 2030 na 19 196,831 32 37
Iran First Reduce GHGs 4%(12%) below BAU in 2030 na 38 52,474 14 43
c
Italy Second Reduce GHGs 55% below 1990 by 2030 2050e 15 36,570 104 156
d e
Jamaica Second Reduce GHGs 25.4%(28.5%)below BAU by 2030 2050 15 1,538 114 106
Japan Second Reduce GHGs 25.4% below 2005 by 2030 2050 13 59,266 173 256
Korea Second Reduce GHGs 24.4% below 2017 by 2030 2050 27 24,321 27 49
e
Mexico Second Reduce GHGs 22%(36%) below BAU in 2030 2050 19 61,749 37 61
Morocco First Reduce GHGs 17%(42%) below BAU by 2030 na 33 35,944 51 76
Russia Second Reduce GHGs 70% below 1990 by 2030 na 12 123,529 8 19
Saudi Arabia First Reduce GHGs 130 MtCO2e below BAU by 2030 na 67 18,510 17 32
South Africa First Reduce GHGs 398-614 MtCO2e in 2025 and 2030 na 28 34,900 27 77
Turkey First Reduce GHGs 20%(25%) below BAU by 2030 na 27 60,233 38 37
United Kingdom Second Reduce GHGs 68% below 1990 by 2030 2050 9 24,948 42 104
United States Second Reduce GHGs 50-52% below 2005 by 2025 2050 7 114,956 65 127
Vietnam Second Reduce GHGs 9%(27%) below BAU by 2030 na 21 71,755 32 47
Sources: UNFCCC (2021), IMF (2021), IMF staff calculations.
Notes: aFirst and second round are 2015/16 and 2020/21 new or updated NDCs. Targets conditional on international support are in brackets. cEU
b
wide target. Jamaica's reduction targets are limited to the energy sector (supply and end-use) and land-use change and forestry. eTarget has been
d
3
discussed but is not yet featured in policy documents. NDCs= Nationally Determined Contributions. na= not applicable. μg= micrograms. m = cubic
meters.
In a series of previous reports, IMF staff developed such a methodology by compiling, from
various sources, extensive country-level data on fuel prices, taxes/subsidies, fuel use, and a
diverse range of parameters underlying environmental costs (e.g., local air pollution emissions
rates, local population exposure to pollution). The first report (Parry and others 2014) found that
most fossil fuel products, in most countries, were underpriced, with the degree of underpricing
generally most severe for coal.
Subsequent papers (Coady and others 2015, 2019) updated data sources, refined the
methodology, and provided country, regional, and global estimates of fossil fuel subsidies.8 Importantly, Coady and others (2015) introduced the concepts of narrow or ‘pre-tax’ subsidies and broad or ‘post-tax’ subsidies where the former reflected (most importantly) underpricing for supply costs and (less importantly) subsidies for fossil fuel producers, while the latter also included underpricing for (most importantly) environmental costs and (less importantly) general consumption taxes. Coady and others (2019), for example, put global post-tax subsidies at a striking $4.7 trillion in 2015 3, or 6.3 percent of world GDP, with only 5 percent of this figure reflecting pre-tax subsides. This paper uses a slightly different terminology 4, referring to explicit subsidies as undercharging for supply costs and producer subsidies (i.e., pre-tax subsidies), and implicit subsidies as undercharging for environmental costs and general consumption taxes (i.e., post tax subsidies less pre-tax subsidies). In principle, fine-tuned instruments can more effectively address some of the environmental costs of fossil fuel use, compared with a per unit fuel charge 5—for example, fees on local air emissions from coal plants promote use of end-of-pipe abatement technologies as well as switching from coal to other fuels, while coal taxes promote only the latter response. Institutional capacity constraints (e.g., for monitoring emissions) may however limit the viability of fine-tuned instruments. In the interim, raising fuel prices provides a ‘second-best’ response and, moreover, may be combined with other measures (e.g., rebates for coal plants with abatement technologies) to better mimic the effects of fine-tuned instruments. 6 Increasing fossil fuel prices is also difficult politically, not least because of the burden it imposes on vulnerable groups. A comprehensive strategy, for example with measures to assist low- income households, displaced workers, trade-exposed firms/regions, and the use of revenues from price reform to boost the economy in an equitable way, can improve acceptability. 7 Most likely however, countries will need a balance between higher fossil fuel prices and reinforcing sectoral measures that are less efficient but avoid significantly higher energy prices (e.g., feebates to alter the relative price of clean/polluting vehicles or activities). Again, however, having some sense of the efficient set of fuel prices can guide the setting of implicit prices in these reinforcing instruments and it provides a benchmark for assessing the trade-offs involved in alternative packages of pricing and sectoral measures. This paper provides a comprehensive update of: (i) efficient fossil fuel prices by country; (ii) fossil fuel subsidies at the country, regional, and global level; and (iii) the environmental, fiscal, and economic impacts of fuel price reform. Selected results are presented below, while a full set of 3 In 2015 US$. All other monetary figures below are expressed in 2021 US$. 4 Based on the suggestions of colleagues at the IMF and other international organizations. 5 To efficiently price a fuel, the per-unit tax is set at the gap between supply costs and the efficient price. 6 The effect of regulations and other non-pricing policies is incorporated in efficient fuel price estimates through, for example, data on emission rates and supply costs. 7 Clements and others (2013), Coady and others (2018).
9

country-level results is available from accompanying spreadsheets. 8 Besides utilizing all the latest
data, the paper improves over prior methodologies by:

       •   Using more refined, country-specific estimates of fuel prices and supply costs, including
           prices disaggregated by end-use sector, more granular, country-specific import and
           export-parity prices (with less reliance on international reference prices), and additional
           fuels such as liquified petroleum gas (LPG);
       •   Making use of new of methodologies for quantifying local air pollution damages by
           country that account for meteorological factors affecting local air quality;
       •   Integrating the analysis into the Carbon Pricing Assessment Tool (CPAT)—see Annex A—
           which enables future projections of efficient prices, fuel consumption, and impacts of
           subsidy reform (projections have greater salience for prospective policy reforms); and
       •   Expanding coverage to 191 countries.

The main results of the discussion can be summarized as follows:

       •   Underpricing of fossil fuels is still pervasive across countries and is often substantial,
           especially for coal. Coal has high carbon and local air pollution damages (though the
           latter vary considerably across countries). At the global level, 99, 52, 47, and 18 percent of
           coal, (road) diesel, natural gas, and gasoline consumption is priced at below half of its
           efficient level in 2020, respectively.
       •   At the global level, total (explicit plus implicit) fossil fuel subsidies are $5.9 trillion in 2020,
           or 6.8 percent of GDP. Assuming current policies, projected (total) subsidies rise to 7.4
           percent of GDP in 2025 with the growing share of global fossil fuel consumption in
           emerging market economies (EMEs), where local pollution costs tend to be larger. Explicit
           subsidies were $0.45 trillion in 2020 (and are larger than reported in prior IMF studies
           due to methodological improvements) 9 but implicit subsidies remain by far the most
           important component accounting for 92 percent of the total.
       •   Underpricing for local air pollution and climate damages are the two biggest sources of
           subsidies, accounting for 42 and 29 percent of the global total in 2020, respectively. Other
           components include undercharging for broader externalities (15 percent), supply costs (8
           percent), and general and consumption taxes (6 percent).
       •   The power generation sector is the largest recipient of subsidies, receiving 61 and 33
           percent of coal and natural gas subsidies, respectively. Electricity subsidies are evenly
           split across industrial and residential users (due to retail prices that are below cost-
           recovery levels).
       •   By region East Asia and the Pacific accounts for 48 percent of total energy subsidies. And
           by country, China remains the biggest subsidizer in absolute terms, followed by the US,
           Russia, India, and the EU.

8   See www.imf.org/en/Topics/climate-change/energy-subsidies.
9   For example, electricity subsidies reflecting end-user prices below cost-recovery levels were estimated for all
countries, rather than relying on third-party estimates that covered a narrow set of countries.
10
• With efficient fuel prices in 2025, projected global CO2 emissions are reduced 36 percent
below baseline levels, fossil fuel air pollution deaths 32 percent (saving 0.9 million lives
annually), tax revenues are higher by 3.8 percent of global GDP, and there are net
economic benefits (environmental benefits less economic costs) of 2.1 percent of global
GDP.
The rest of the paper is divided into two main sections, the first covering conceptual and
measurement issues and the second presenting the main findings.
III. Conceptual and Measurement Issues
This section first provides a brief recap of efficient fuel prices and fossil fuel subsidies from a
conceptual perspective, 10 and then discusses the measurement of environmental costs.
Computational procedures and other data are discussed in Annex A and B.
A. Conceptual Issues—a Quick Recap
(i) Defining Efficient Fuel Prices
The efficient price per unit of a fossil fuel product is given by:
{[unit supply cost] + [unit environmental cost]} × [1 + general consumption tax rate, if applicable]
Each component is discussed below.
Supply costs. For a non-tradable product (which is largely the case for electricity), the supply cost
is the domestic production cost, inclusive of any transportation, processing, distribution costs,
and margins. In contrast, for an internationally tradable product the supply cost is the
opportunity cost of consuming the product domestically rather than selling it abroad—this is
measured here by the import- or export-parity price (for fuel importing and exporting countries
respectively), with adjustments for domestic margins.
Environmental costs. The environmental costs of coal, natural gas, and liquid fuel combustion
include global climate and local outdoor (‘ambient’) air pollution damages. For all fuels, the
climate damage is the fuel’s CO2 emissions factor times the damage per unit of CO2 emissions.
CO2 emissions factors for a given fuel vary only modestly across countries when expressed per
unit of energy, though the emissions factor is about 25 and 45 percent lower per unit of energy
for liquid fuels and natural gas than for coal, respectively. 11
10 For more detailed discussion see Parry and others (2014) on efficient fuel pricing and Coady and others (2015,
2019) on fossil fuel subsidy definitions.
11 EIA (2021).11 The major local air pollutants from coal include: (i) directly emitted fine particulate matter, with diameter less than 2.5 micrometers (PM2.5), which is small enough to enter to the lungs and bloodstream; (ii) sulfur dioxide (SO2) and nitrogen oxide (NOx), which react in the atmosphere to form PM2.5 indirectly; and (iii) (low-lying) ozone formed, for example, from volatile organic compounds (VOCs) like benzene. 12 The local pollution damage per unit of fuel use is the fuel’s emissions factor for each pollutant, times the damage per unit of emissions, and aggregated over all pollutants. Emissions factors can vary substantially across countries depending on the use of end-of-pipe control technologies and fuel quality (e.g., bituminous coal has higher sulfur content than lignite and anthracite). Burning natural gas produces only one local pollutant, NOx. For road fuels, CO2 emissions per liter are about 16 percent higher for diesel than for gasoline— for both fuels CO2 emissions can be moderately reduced by blending them with biofuels (our data accounts for this but not for partially offsetting land-use CO2 emissions). Combusting gasoline and diesel can also produces direct PM2.5, SO2, NOx and VOCs and again emission rates vary across countries depending on the stringency of (new and used) vehicle emission rate standards and fuel quality—emission rates are generally much lower for gasoline than diesel. More broadly, use of road fuels in vehicles is associated with other externalities, most importantly traffic congestion and accidents and (less importantly) wear and tear on the road network (the nature of these externalities is discussed below). In principle, all three externalities are most efficiently addressed through various km-based charging systems (e.g., km-based fees rising and falling over the rush hour on congested roads or that vary with driver/vehicle accident risk), however until such systems are comprehensively implemented (which no country has done to date) fuel taxes remain a valid (albeit blunt) second-best instrument. 13 Efficient fuel taxes are however lower to the extent tax-induced reductions in fuel use come from improvements in fleet average fuel economy and shifting to electric vehicles (EVs), rather than reduced vehicle km travelled. Externalities for non-road uses of other oil products and LPG (e.g., for home heating, off-road vehicles, petrochemicals) are limited to CO2 and local pollution and are calculated separately. For oil product consumption that could not be allocated to one of the four oil products analyzed—gasoline, on-road diesel, LPG and kerosene—the local air pollution and climate externalities are assumed to be equal to the average of the four oil products, weighted by consumption. Finally, environmental costs from electricity consumption are taken to be zero—global and local pollution are attributed to the fuel inputs, while only a tiny share of electricity consumption is 12 Fuel combustion causes other local pollutants, but their damages are relatively modest. For example, carbon monoxide does not harm human health when it is produced in open spaces. 13 Parry and others (2014). Indeed, excluding km-based externalities from efficient fuel tax computations leads to perverse policy implications (e.g., that EU countries should dramatically cut fuel taxes).
12

presently used for road vehicles (hence the associated congestion and accident externalities are
tiny when expressed relative to total electricity consumption). 14

General consumption taxes. Standard IMF guidance is to apply the same value added tax (VAT),
or general consumption taxes, to all household products as this avoids distorting relative
consumer prices—and the VAT should be applied to the full social cost (supply and
environmental cost). Under this approach, revenue is raised from general consumption taxes
without distorting relative prices and hence the choice between different goods (accounting for
the full social cost of producing them). 15

(ii) Defining Explicit and Implicit Fossil Fuel Subsidies

The explicit subsidy for a fuel, in a sector, in a country, is defined by:

           {[sectoral unit supply cost] - [price paid by fuel user]} × [sectoral fuel consumption]

And the total explicit and implicit subsidy is defined by:

          {[sectoral efficient fuel price] - [price paid by fuel user]} × [sectoral fuel consumption]

Given the focus here on underpricing, if a user price exceeds the supply cost the explicit subsidy
is counted as zero (rather than negative) and where the price exceeds the efficient level the total
subsidy is counted as zero. Subsidies are then aggregated across sectors (power generation,
industry, transportation, and residential), fuels (coal, natural gas, gasoline, diesel, kerosene, LPG,
and other oil products), and countries. Under the above definition, undercharging for VAT is
counted as an implicit subsidy. Producer subsidies (e.g., favorable tax treatment for fossil fuel
extraction) are included in explicit subsidies, though they play a relatively small role.

B. Measurement Issues—an Update

This subsection considers in turn the quantification of climate, local air pollution, and broader
externalities and some caveats—other data, including a new method for collecting prices and
supply costs are described in Annex B.

(i) Climate Change

14   There are a variety of other externalities associated with production and use of fossil fuels that are beyond the
scope of the analysis because: (i) they are generally small when expressed per unit of fuel consumption (e.g., de-
spoiling of the natural environment during fuel extraction, oil spills, emissions leakage during fuel distribution
and storage; (ii) in some cases the nature of the externality is not well defined (e.g., oil security, indoor air
pollution where those affected by the pollution also cause it); and (iii) some of these problems are better
addressed through policies other than fuel taxes. See NRC (2009), Ch. 2 and Parry and others (2014), Ch. 2.
15   See for example Crawford and others (2010).
13
Three alternative approaches have been used in the economics literature to value CO2 emissions:
• The social cost of carbon (SCC), which measures the present discounted value of the
worldwide damage (e.g., to agriculture, coastal activities, ecosystems, human health) from
future warming associated with an extra metric ton of CO2 emissions. Despite three
decades of study, however, SCC estimates remain contentious, not least because they are
highly sensitive to: (i) assumptions about intergenerational discounting; and (ii) the
modelling of low probability, but catastrophic climate change (e.g., due to possible
tipping points within the climate system). One recent assessment puts the SCC at $51 per
ton in 2021 in a central case, rising to $62 by 2030, 16 but others dispute this. 17
• The price on global CO2 emissions consistent with a least-cost trajectory to meet global
temperature stabilization goals. Again, there is a sizable modelling literature, but with
uncertainties reflecting alternative scenarios for: (i) the growth of global CO2 emissions in
the baseline; and (ii) the price responsiveness of CO2 emissions. A widely cited review put
the value of CO2 emissions consistent with a 2oC warming target at $40-80 per ton in
2020, rising to $50-100 per ton by 2030. 18
• The prices implicit in national mitigation pledges. These have been estimated on a
country level basis, though: (i) estimates vary substantially across countries from well over
$75 per ton in 2030 in some countries, to between $25-75 in others, and well below $25
in some cases; and (ii) national mitigation pledges currently fall well short of what is
needed at the global level to be on track with temperature stabilization goals. 19
For the purposes of this study, which presents cross-country comparisons, it is helpful to have a
common carbon price across countries, and the second approach above seems the more solid
for this purpose given that it is grounded in temperature goals that are the centerpiece of the
Paris Agreement, which was signed by 195 parties. The analysis below assumes a carbon price of
$60 per ton in 2020—a lower bound value given the goal to limit warming to well below 2oC
(prices for intervening or earlier years are inferred assuming prices rise annually at $1.5 per ton).
(ii) Local Air Pollution
The dominant component of local air pollution costs, and the focus here, is elevated mortality
risks for exposed populations inhaling (direct and indirect sources of) PM2.5. 20
16 US IAWG (2021).
17 Notably on the modelling underlying these estimates – see Pindyck (2017), Stern (2006), Weitzman (2011).
18 Stern and Stiglitz (2017). Updated estimates in Parry and others (2021) suggest little change in the needed
global prices for 2030.
19 For example, IMF (2019a, b), Parry and others (2021).
20 Mortality risks typically account for 85 percent or more of the total estimated damages from outdoor air
pollution (e.g., NRC 2009, Ch. 2). Other damage categories include, for example, non-fatal illness, impaired
visibility, crop damage, building corrosion.14 The Global Burden of Disease (GBD) regularly reports estimates of premature deaths from local air pollution by country and risk—the most recent global total was 4.5 million for outdoor air pollution in 2019 with 92 and 8 percent due to PM2.5 and ozone respectively and two-thirds of deaths among people aged 65 and over (who have higher prevalence of pre-existing conditions). 21 In aggregate, about 60 percent of outdoor air pollution deaths are attributed to fossil fuels, but (unlike the approach below) GBD does not decompose the contribution from individual fuels. 22 Estimates of air pollution costs by fuel product used below are based on several sources of information. First, the baseline rates of mortality for illnesses that are worsened by exposure to local air pollution. This is available by type of illness, age class (25-64 and 65 and above), and region (urban/rural) for 204 countries and county groupings from GBD. These illnesses include ischemic heart disease (28 percent of the global total premature deaths in 2019), stroke (26 percent), chronic obstructive pulmonary disease (20 percent), lower respiratory infections (11 percent), and trachea/bronchitis/lung cancers (6 percent), with the remainder attributed to other sources. Baseline mortality rates vary significantly across countries—they can be relatively high in countries with higher prevalence of heart and lung disease (e.g., from alcohol and cigarette abuse) and lower in countries where people are relatively less likely to live long enough to suffer from pollution-related illness. Second, the emissions factors for local air pollutants from use of fossil fuels in different sectors. These are obtained from the International Institute for Applied Systems Analysis for years 2020 onwards.23 There is extensive cross-country documentation of emission rates for the power and transport sector (where there are data gaps they are filled using comparable countries), but this is less true of the industrial and residential sectors—where there are data gaps for these sectors power sector emission rates are used. 24 The emission rates for power and transport represent an average over newer sources (that may have advanced emissions control technologies) and older sources (that do not). In general, these emissions factors tend to decline over time as older capital is retired, though on-road emission rates for diesel vehicles have been revised upwards (given recent evidence that these rates exceeded new vehicle standards). 21 IHME (2020). Indoor air pollution caused another 2.3 million deaths. 22 See for example Karagulian and others (2015)—other sources include burning crop residue and natural dust. Considerable uncertainties surround local air pollution deaths however, for example, Vohra and others (2021) estimated global outdoor air pollution deaths from fossil fuels at 10 million in 2012. 23 Based on the Greenhouse Gas—Air Pollution Interactions and Synergies (GAINS) model. See Wagner and others (2020). 24 This likely gives conservative emission rate estimates as control technologies for the industrial and household sectors are less common than for the power sector.
15

The third source of information is a measure of population exposure to local pollution. This study
averages results from two different methodologies—one based on ‘intake fractions’, and the
other local air quality modeling—where each have their own strengths and weaknesses.

The intake fraction is the proportion of (direct and indirect) PM2.5 emitted from a fuel product
that, on average, is inhaled by exposed populations—estimates here use intake fractions from
Parry and others (2014). For coal and natural gas plants, these fractions are from spatial data on
the location of power plants in different countries 25 matched to granular data on population
density at different distances from each plant (up to 2,000 km away, within and across borders),
and regression coefficients indicating how intake fractions at different distances vary with
population density. For vehicle and building emissions (which generally remain close to ground
level rather than being transported through the atmosphere), intake fractions were extrapolated
nationwide from a database of (ground-level) intake fractions for over 3,000 urban areas. Intake
fractions tend to be high in densely populated countries and where emissions sources are
located inland, and lower on the coast as a large portion of emissions dissipate without harming
local populations. Fixed coefficients are used to translate intake fractions into increased rates of
mortality from pollution-related illness based on linearizing concentration response functions. 26

The local air quality modelling approach involves computational modelling of how emissions
released from a particular location affect air quality (from PM2.5 and ozone) and mortality risk in
other regions. The results here are based on TM5-FASST, a downscaled ‘source-receptor’ model
applied at the country level. 27 The air quality modelling approach is more sophisticated than the
intake fraction approach in that it accounts for: (i) local meteorological and topographical factors
influencing ambient pollution concentrations; and (ii) possible non-linearities in concentration
response functions. On the other hand, air quality modelling is less granular for the application of
fossil-fuel related sources like power plants—this implies less precision in measuring population
sizes potentially exposed to fossil fuel-related pollution.

The final source of information is attaching a monetary value to health risks which is contentious,
but necessary to factor health risks into energy prices. The approach draws on the OECD (2012)
meta-analysis of several hundred stated preference studies on health risk valuations in different
countries which (after updating for inflation and real per capita income growth) implies a value of
around $4.6 million per death avoided for 2020 in the average OECD country. This figure is

25   Data was available for 110 countries—intake fractions for other countries were inferred from those for
comparable countries in the region.
26   These functions indicate how mortality rates for illnesses increase with higher pollution concentrations.
27   TM5-FASST (the TMF-FAst Scenario Screening Tool, see Van Dingenen and others 2018) is based on a
linearized version of TM5, a detailed model of emissions transport and atmospheric chemistry leading to
pollution formation. The original source-receptor matrices in TM5-FASST are separated into 56 regions which are
downscaled to obtain country-specific matrices and supplemented with local source apportionment studies
which estimate the contribution of sources such as fossil fuels to baseline concentrations.
16

extrapolated to other countries based on their per capita income relative to the OECD average
and an assumed unitary elasticity for the mortality value with respect to per capita income. 28

(iii) Broader externalities for transportation 29

As regards road congestion, it is standard to assume that motorists factor average delays into
their driving decisions but not marginal delays (i.e., their impact on adding to congestion,
slowing speeds, and adding to delays for other road users). Assessing how much fuel taxation is
warranted by congestion requires a nationwide measure of marginal congestion costs. In the
absence of a consistent cross-country database on nationwide delays, the analysis here relies on
an earlier rudimentary set of average delay estimates per vehicle km extrapolated from a city-
level database. Average delays are then multiplied by: (i) estimated relationships between
marginal and average delays; (ii) vehicle occupancy (averaging over cars and buses); (iii) people’s
value of travel time (VOT) (assumed to be 60 percent of the nationwide average market wage in
2020); (iv) fuel economy (to express costs on a per liter basis); and (v) the portion of the fuel
demand elasticity that comes from reduced driving (and therefore affects congestion) versus the
portion that comes from improved fuel economy/shifting to EVs (that does not affect
congestion). 30

With regards traffic accidents, a portion of the costs are commonly viewed as internal to drivers
(e.g., own-driver injuries in single vehicle collisions) while other costs are external (e.g., injury risks
to pedestrians, elevated risks to occupants of other vehicles from multi-vehicle collisions,
property and medical costs borne by third-parties). Externalities are measured 31 by apportioning
country-level data on traffic fatalities into external versus internal risks, monetized them using
the above approach for mortality valuation, extrapolating non-fatality accident costs to other
countries from several country case studies, and expressing the result per unit of fuel use
(making adjustments for the km-based portion of fuel price elasticities). Coady and others (2019)

28   See Robinson and others (2018), Tables 3.1 and 3.3. and Viscusi and Masterman (2017). Extrapolations are
based on purchasing power parity income, which takes local price levels into account to more accurately reflect
people’s willingness to pay for risk reductions out of their own income. Mortality valuations may also differ across
countries with differences in life expectancy, health, religion, culture, economic and social support and so on,
however the effects of these factors are not well understood (Robinson and others 2018).
29   Where data is unavailable for quantifying the externalities below (e.g., for many African countries) values are
inferred from an average of countries with a similar per capita income level in the region.
30   Checks against more reliable estimates from detailed data on travel delays by road class, which are available
for the UK and US, suggests the average delay estimates are broadly reasonable. Further adjustments are made
to account for the relatively weaker responsiveness of driving on congested roads (which is dominated by
commuting) to fuel taxes than driving on free flowing roads and the share of buses and trucks in the vehicle fleet
(which contribute more to congestion per vehicle km). See Parry and others (2014), Ch. 5.
31   See Parry and others (2014), Ch 5.
17

updated accident externalities with more recent traffic fatality data and these estimates are used
after updating to 2020 for fatality/injury valuations.

Finally, externalities from wear and tear on the road network imposed by high axle-weight
vehicles are taken from the update in Coady and others (2019), which are based on highway
maintenance expenditures and an assumption that half of these expenditures are attributed to
vehicle use as opposed to weather and natural deterioration.

(iv) Caveats

The significant uncertainties surrounding the valuation of environmental costs should be borne
in mind—for example, each of the sequential linkages between the burning of a fuel and
changes in the mortality rates for exposed populations all involve plenty of data uncertainties
and there are differing views on how to value the associated health risks. Nonetheless,
environmental costs are just as real as supply costs, and undercharging for an unbiased (albeit
uncertain) estimate of them is tantamount to undercharging for the true social costs of
consumption. The estimates presented here should be viewed as indicative—the implications of
alternative views on underlying parameters should be largely transparent from the discussion
and the online spreadsheet tools.

                                                   IV. Results

Three sets of results are presented below: (i) a comparison of current and efficient prices for fossil
fuel products for selected countries; (ii) the size of fossil fuel subsidies over time and by product,
component, and sector at global and regional level; and (iii) the environmental, fiscal, and
economic welfare impact of fuel price reform at global and regional level. Results are mostly
presented for 2020, the last year of available price data, 32 though historical and future trends and
reform impacts projections are also presented. Full country results are available online.

                          A. Comparing Current and Efficient Fossil Fuel Prices

Figure 1 shows estimates of current and efficient fuel prices, with the latter broken down by
component, for coal, natural gas (averaged over uses by power, industry, and households,
weighted by consumption), gasoline, and (road) diesel (the latter averaged over light- and heavy-
duty vehicles) for 25 countries, including all the Group of Twenty (G20) countries, and for year
2020. Figure 2 indicates the cumulative fraction of global fuel consumption (aggregating over
191 countries) that is underpriced at or below a given ratio of the current fuel price to the
efficient price. Estimates of fuel taxes include carbon taxes and emissions trading systems (ETSs).
Some noteworthy points from both figures are discussed below.

32   The last year for observed fuel consumption is 2018 so fuel use for 2020 is projected, though subsidy estimates
are not very sensitive to year-to-year variation in fuel consumption.
18
Figure 1. Current and Efficient Fuel Prices, 2020
Coal Natural gas
$/GJ $/GJ
0 5 10 15 20 25 30 35 40 0 5 10 15 20 25
Argentina Argentina
Australia Australia
Brazil Brazil
Canada Canada
China China
Germany Germany
France France
India India
Indonesia Indonesia
Italy Italy
Japan Japan
Mexico Mexico
Russia Russia
Saudi Arabia Saudi Arabia
South Africa South Africa
Korea Korea
Turkey Turkey
United Kingdom United Kingdom
United States United States
Jamaica Jamaica
Costa Rica Costa Rica
Vietnam Vietnam
Ethiopia Ethiopia
Iran Iran
Morocco Morocco
Gasoline Road Diesel
$/liter $/liter
0.00 0.50 1.00 1.50 2.00 2.50 3.00 0.00 0.50 1.00 1.50 2.00 2.50 3.00
Argentina Argentina
Australia Australia
Brazil Brazil
Canada Canada
China China
Germany Germany
France France
India India
Indonesia Indonesia
Italy Italy
Japan Japan
Mexico Mexico
Russia Russia
Saudi Arabia Saudi Arabia
South Africa South Africa
Korea Korea
Turkey Turkey
United Kingdom United Kingdom
United States United States
Jamaica Jamaica
Costa Rica Costa Rica
Vietnam Vietnam
Ethiopia Ethiopia
Iran Iran
Morocco Morocco
Supply cost Global warming Local pollution Congestion Accidents Road damage VAT Retail price
Source. IMF staff.
Notes. Prices for coal and natural gas average over fuel consumption in the power generation, industrial, and
residential sectors, while prices for gasoline and diesel are for road fuel consumption only (diesel averages over
uses in light- and heavy-duty vehicles). Congestion, accident, and road-damage externalities are scaled by the
fraction of fuel price elasticities reflecting changes in driving (as opposed to changes in fuel economy).19 (i) Coal and Natural Gas Even when coal is compared on an energy equivalent basis, supply costs (averaged across sectors) differ significantly across counties (e.g., with local productivity, labor costs, accessibility of extraction sites, transportation costs to end users) from around $1.5 per gigajoule (GJ) in Russia and the United States to $7 per GJ (e.g., Jamaica, Ethiopia). This variation is largely irrelevant for our purposes, however, as fuel user prices are typically at least as large as supply costs, implying no explicit subsidies. Generally, the pricing of environmental costs for coal use is modest at best, as indicated by the generally small difference between coal prices and supply costs in Figure 1. This largely reflects a lack of coal excises 33 and carbon pricing—though pricing in Canada, the EU, and Korea amounted to coal taxes of $2.1, 3.1, and 2.3 per GJ in 2020 (and prices, especially in Europe, have risen since 2020). Nonetheless, global warming damages alone are equivalent to $6.3 per GJ or around 100-300 percent of supply costs. Local air pollution damages can also be large, but there is substantial variation across countries due to differences in local emission rates, population exposure to pollution, and health risk valuation—local air pollution damages exceed 150 percent climate of damages in 4 cases in Figure 1 (e.g., China, Russia) but are less than 50 percent of climate damages in 6 cases (e.g., Australia, Canada, Mexico). Coal is mostly an intermediate product, so the VAT component to the efficient coal price is modest at best. Supply costs for natural gas (again averaged across sectors) also vary significantly by country (given the fragmented global market for natural gas), from around $5 per GJ in the US to around $12 per GJ in (gas-importing) Japan and Korea. Prices fall short of supply costs in nine countries in Figure 1 (most prominently in Canada, India, Russia, and Saudi Arabia) and exceed supply costs in another seven cases (most prominently Australia, China, France, Italy, Japan, and South Africa) 34 and in two of those cases prices (moderately) exceed their efficient levels. Carbon damages are around one third to one half of supply costs for natural gas, much lower than for coal, reflecting both higher supply costs per GJ for gas and lower emission rates per GJ. And unlike for coal, local air pollution damages from natural gas are generally modest (below $1 per GJ in all but four cases). The VAT component of efficient natural gas prices is also modest when averaged over electricity, industrial, and household uses (though for household consumption alone it contributes around 10-20 percent of the efficient price). 33 22 out of the 191 countries in our database impose excises on coal, but at generally modest rates. 34 42 countries in our full database impose excises on natural gas, but again at generally modest rates.
20

                                                                    Figure 2. Fossil Fuel Pricing and Consumption Relative to Efficient Prices

                                                          120
     ratio of current price to efficient price, percent

                                                          100

                                                           80

                                                           60

                                                           40

                                                           20

                                                            0
                                                                0        10       20      30        40         50     60       70          80         90           100
                                                                                               Percent of global consumption
                                                                Coal                             Natural gas                        Gasoline
                                                                Road Diesel                      Priced efficiently                 Priced 50 percent efficienty

 Source. IMF staff.
 Note. The flat portion of the gasoline curve is consumption for China and the US (47 percent of the global
 total) where the gap to efficient prices for both countries is about the same. The flat portion for coal is China.

In short, there is substantial and pervasive underpricing for the environmental costs of coal use,
and to a lesser extent, natural gas. Taking a consumption-weighted average across all countries
in our database (Figure 2), 99 and 47 percent of coal and natural gas consumption respectively is
priced at below half of its efficient level.

Going forward, carbon damages per GJ of fuel use will rise (given the rising price on CO2
emissions on trajectories consistent with least-cost global temperature stabilization). More likely
than not, local air pollution damages per GJ may decline over time with declining emission rates
(e.g., as dirtier plants with laxer regulations are retired) 35 though this trend may be partially offset
with growth in urban population exposure and in real per capita income (the latter increases
mortality risk valuations).

35   Local air pollution damages in China and India would be 60 and 80 percent lower respectively if air emission
rates in these countries were comparable to those in Australia and the US.
21 (ii) Gasoline and Diesel There is little variation in supply costs for road fuels across countries, given the integrated world market for petroleum products—supply costs in 2020 were around $0.50 per liter for both fuels across countries illustrated in Figure 1 in 2020. Road fuel prices exceed supply costs in all but two countries (Iran and Saudi Arabia), as most countries impose excises on road fuels. Indeed, for gasoline, prices exceed supply costs by around 50 percent or more in all but five countries in Figure 1, and by over 100 percent in 13 countries (France, Germany, Italy, UK, etc.). Most countries impose lower taxes per liter on road diesel than gasoline 36—indeed road diesel prices exceed supply costs by 50 percent or more in only 12 countries in Figure 1. Carbon damages amount to $0.15 and $0.17 per liter for gasoline and diesel respectively, about one third of supply costs. Local air pollution damages are generally small relative to carbon damages for gasoline. In contrast, for diesel vehicles local air pollution damages were typically 1- 3 times as large as carbon damages in 2020. Congestion and accident externalities combined are relatively large for gasoline, together warranting charges of around $0.5-$1.0 per liter— congestion tends to be the larger externality in densely populated advanced countries (partly because of high VOTs) and accidents in developing countries (partly because of high incidences of pedestrian fatalities). For diesel, combined congestion and accident externalities per liter are somewhat smaller as a significant portion of diesel fuel is used in heavy-duty vehicles which are driven fewer km on a liter of fuel (though a partially offsetting factor is the higher congestion costs per km for these vehicles as they take up more road space). The VAT component of the efficient fuel price is significant for gasoline (around $0.2-0.4 per liter) but less so for road diesel (where a substantial portion of consumption is an intermediate product). Across all countries (Figure 2), underpricing of road fuels is pervasive—for example, 70 percent of global gasoline consumption is priced at less than 60 percent of efficient levels, while 50 percent of diesel fuel is priced at less than half the efficient level. Going forward, local pollution damages for gasoline and diesel vehicles will likely decline as newer vehicles subject to stricter emissions standards permeate the fleet—more importantly however, transportation tax systems will need to be overhauled in many countries as they progressively phase out gasoline and diesel vehicles. 36 One reason is to limit fuel costs for commercial users and another is that diesel vehicles are more fuel efficient—the latter is misplaced however, because carbon and local air emission rates per liter are higher for diesel than gasoline.
22
B. Fossil Fuel Subsidies
(i) The Global Picture
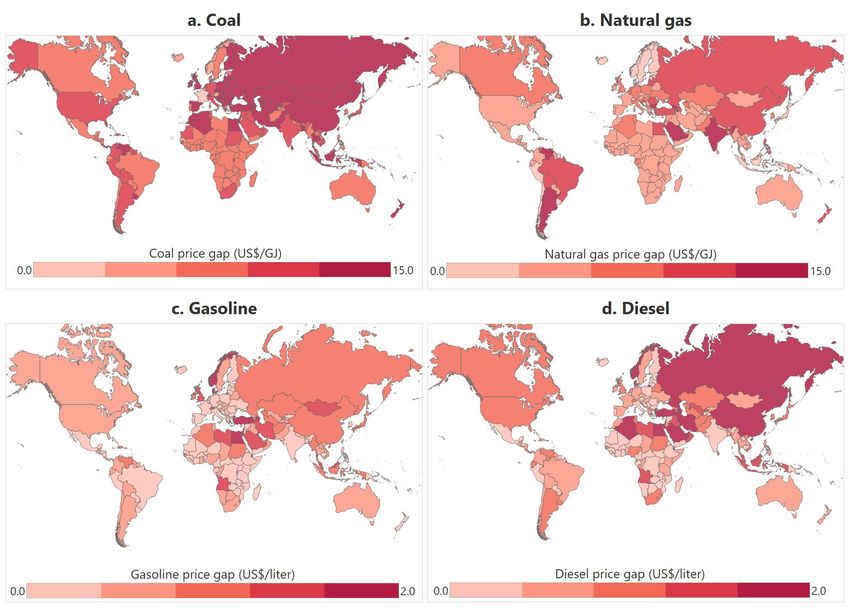
At the global level (see Figure 3), fossil fuel subsidies amounted to $5.9 trillion in 2020, or 6.8
percent of GDP, rising (on current policies) to 7.4 percent of GDP in 2025. In 2020, explicit and
implicit subsidies accounted for 8 and 92 percent of the total respectively.
Figure 3. Global Fossil Fuel Subsidies
8,000 8
7,000 7
6,000 6
global GDP, percent
5,000 5
US$ billion
4,000 4
3,000 3
2,000 2
1,000 1
0 0
2015 2016 2017 2018 2019 2020 2021 2022 2023 2024 2025
Explicit subsidies (lhs) Implicit subsidies (lhs)
Explicit subsidies (rhs) Implicit subsidies (rhs)
Source. IMF staff.
Note. Figures from 2019 and 2021 onwards use projections for fuel use and fuel prices, respectively.
In absolute terms, explicit subsidies peaked in 2018 at $760 billion, then fell to $450 billion in
2020, but are projected to rise and then remain at about $600 billion from 2021 to 2025. These
fluctuations are largely driven by changes in international oil and natural gas prices—as
international prices fall (as they did in 2019 and 2020 before rising after that) this lowers the gap
between supply costs (which depend on international prices for traded products) and domestic
prices in countries regulating domestic fuel prices. Estimates of explicit subsidies are larger than
in previous IMF studies37 due to methodological improvements (a larger number of countries for
which price data are collected rather than assumed equal to supply costs and electricity supply
costs are estimated using the CPAT model—see Annex A and B).
Implicit subsidies are projected to mildly increase in absolute terms, and as a percent of global
GDP, out to 2025. Although fuel use/GDP and local air emission rates are generally falling over
37 For example, for 2017 explicit subsidies are $575 billion in Figure 3 above compared with $295 billion in Coady
and others (2019), Figure 2.23
time, 38 emerging market economies (EMEs) account for a progressively rising share of global fuel
consumption and local environmental costs per unit of fuel use tend to be larger in these
countries. 39 Annex C compares energy subsidy estimates with those form other studies.
(ii) Breakdown by Fuel Product
Petroleum, natural gas, and electricity accounted for 28, 27 and 42 percent of the explicit global
subsidy in 2020 (Figure 4), while coal accounted for just 3 percent (as coal prices generally cover
supply costs). For petroleum and natural gas, explicit subsidies primarily reflect the setting of
domestic prices below international prices in energy exporting countries, while the subsidy for
electricity largely reflects the failure to fully reflect generation costs in domestic tariffs. Globally,
only 8 percent of the explicit subsidy in 2020 reflects support for fossil fuel producers (92 percent
is consumer-side subsidies).
The breakdown by fuel product looks dramatically different for total (explicit plus implicit)
subsidies in 2020. Here coal accounts for 41 percent of the global total in 2020, reflecting
underpricing for carbon and local air pollution damages. Petroleum accounts for 46 percent of
the global subsidy, largely reflecting the failure of excises on petroleum products to fully reflect
environmental costs and broader externalities. Natural gas (where environmental costs are more
moderate) and electricity (where environmental costs are attributed to fuel inputs) account for 9
and 4 percent of the global subsidy, respectively.
Figure 4. Global Fossil Fuel Subsidies by Fuel
2.0 9
1.8 8
1.6
global GDP, percent
global GDP, percent
7
1.4 6
1.2
5
1.0
4
0.8
0.6 3
0.4 2
0.2 1
0.0 0
2017 2020 2025 2017 2020 2025
Explicit (lhs) Implicit (rhs)
Coal Petroleum Natural gas Electricity
38 The former due to improving energy efficiency and, for the most part, below unitary income elasticities for
energy products.
39 For example, the share of global subsidies from EMEs increases from 60 to 69 percent between 2015 and 2025,
and for BRICs (Brazil, Russia, India and China) from 44 to 54 percent.24
(iii) Breakdown by Component
Broken down by component (see Figure 5), undercharging for local air pollution, global warming,
broader externalities from road use, supply costs, and general consumption taxes account for 42,
29, 15, 8, and 6 percent respectively of total (explicit and implicit) subsidies in 2020. For coal,
local air pollution and global warming account for 58 and 40 percent of total subsidies
respectively, while for petroleum underpricing for local air pollution and broader externalities
account for 39 and 33 percent of the total subsidy respectively, and global warming a smaller 16
percent. In contrast, for natural gas global warming is 59 percent of the total subsidy.
Figure 5. Global Fossil Fuel Subsidies by Component
(iv) Breakdown by End-Use Sector
Breaking down subsidies by end use sector (Figure 6), coal use in power generation (about 2/3 of
total coal use) is the most significant, accounting for 25 percent of global subsidies in 2020,
followed by use of diesel and gasoline in transportation (19 and 12 percent respectively), and
coal use in industry (12 percent). Natural gas consumption and subsidies are concentrated in the
power generation and industrial sectors, while electricity subsidies are nearly evenly split
between the industrial and residential sectors. Producer subsidies are relatively small across fuels.
Figure 6. Global Fossil Fuel Subsidies by End-User, 2020You can also read