An Analysis of New York Domestic Insurers' Exposure to Transition Risks and Opportunities from Climate Change
←
→
Page content transcription
If your browser does not render page correctly, please read the page content below
An Analysis of New York Domestic
Insurers’ Exposure to Transition Risks
and Opportunities from Climate Change

                  Published June 10, 2021

                                            1
Table of Contents
Executive Summary ....................................................................................................................................................5
1.     Introduction ..................................................................................................................................................... 19
     1.1.     The Low-Carbon Transition Is Accelerating ............................................................................................. 19
       1.1.1.         Transition Risk Driver – Policy and Regulation Change ................................................................... 20
       1.1.2.         Transition Risk Driver – Low-Carbon Technology Advancement .................................................... 21
       1.1.3.         Transition Risk Driver – Changes in Public Sentiment and Demand Patterns ................................. 21
       1.1.4.         Transmission Channels of Transition Risks to Insurers’ Assets ....................................................... 23
       1.1.5.         U.S. and Global Financial Regulators Increase Their Focus on Climate Change.............................. 24
     1.2.     Purpose of the Study ............................................................................................................................... 26
2.     Methodology ................................................................................................................................................... 29
     2.1.     Insurers’ Asset Holding Data ................................................................................................................... 29
     2.2.     PACTA – Transition Risk Exposure and Scenario Analysis ....................................................................... 30
     2.3.     Inputs and Outputs of the PACTA Model ................................................................................................ 30
       2.3.1.         Inputs of the PACTA Model ............................................................................................................. 30
       2.3.2.         Outputs of the PACTA Model .......................................................................................................... 32
3.     Transition Risk Exposure of New York Domestic Insurers ............................................................................... 34
     3.1.     Insurers’ Exposure to High-Carbon Sectors ............................................................................................. 34
     3.2.     Peer Comparison of Insurers’ Holdings in High-Carbon Sectors and Technologies ................................ 36
     3.3.     Insurers’ Alignment with Climate Scenarios............................................................................................ 37
       3.3.1.         Fossil Fuels ....................................................................................................................................... 37
       3.3.2.         Power Generation ........................................................................................................................... 40
       3.3.3.         Automotive ...................................................................................................................................... 43
     3.4.     Individual Insurers Reports – A Mock Example ....................................................................................... 47
4.     Strategies for Mitigating Transition Risks ........................................................................................................ 48
5.     Conclusion ....................................................................................................................................................... 51
6.     Appendix .......................................................................................................................................................... 51
     6.1.     Parts of Value Chains Covered by the PACTA Methodology ................................................................... 51
     6.2.     Limitations of the Study .......................................................................................................................... 52

                                                                                                                                                                           2
List of Figures
Figure 1. Transmission Mechanisms of Transition Risk Drivers to Financial Stability ............................................. 23
Figure 2. Data Coverage of the Study ...................................................................................................................... 29
Figure 3. High and Low-Carbon Technology Mix for the Power Sector in Insurers’ Corporate Bond Portfolios .... 32
Figure 4. Alignment of Coal Production in the Corporate Bond Portfolios Relative to the IEA Transition Scenarios
................................................................................................................................................................................. 33
Figure 5. Percentage of Investments in the PACTA Sectors for Corporate Bonds and Listed Equities Holdings .... 35
Figure 6. Percent Distribution of Investment Value in the PACTA Sectors ............................................................. 35
Figure 7. Peer Comparison of Insurers’ Holdings in Fossil Fuel Production (Coal, Oil, and Gas Production) as a
Percentage of the Corporate Bond and Equity Portfolios (Each Vertical Line Represents an Insurer)................... 36
Figure 8. Peer Comparison of Insurers’ Holdings in Coal, Oil, and Gas-Fired Power Generation as a Percentage of
the Corporate Bond and Equity Portfolios (Each Vertical Line Represents an Insurer) .......................................... 36
Figure 9. The Coal Mining Production Volume Trajectory Relative to Climate Scenarios ...................................... 38
Figure 10. The Oil Production Volume Trajectory Relative to Climate Scenarios ................................................... 39
Figure 11. The Natural Gas Production Volume Trajectory Relative to Climate Scenarios ..................................... 39
Figure 12. High-Carbon and Low-Carbon Technology Mix for the Power Sector ................................................... 40
Figure 13. Coal-Fired Power Production Volume Trajectories Relative to Climate Scenarios ................................ 41
Figure 14. Oil-Fired Power Capacity Trajectories Relative to Climate Scenarios .................................................... 42
Figure 15. Gas-Fired Power Capacity Trajectories Relative to Climate Scenarios ................................................... 42
Figure 16. Renewable Power Capacity Trajectories Relative to Climate Scenarios ................................................ 43
Figure 17. High-Carbon and Low-Carbon Technology Mix for Light-Duty Vehicles in the Automotive Sector ....... 44
Figure 18. Production Volume Trajectories of Internal Combustion Engine-Based Light-Duty Vehicles (LDV)
Relative to Climate Scenarios .................................................................................................................................. 45
Figure 19. Production Volume Trajectories of Hybrid Light-Duty Vehicles (LDV) Relative to Climate Scenarios ... 46
Figure 20. Production Volume Trajectories of Electric Light-Duty Vehicles (LDV) Relative to Climate Scenarios .. 46
Figure 21. A Mock Example of Automotive Technology Mix of Investee Companies ............................................. 48
Figure 22. The Parts of Value Chains Covered by PACTA Model (Shaded in Blue) (Source: 2DII)........................... 52

List of Tables
Table 1. Insurers’ Corporate Bond Portfolio as a Percentage of the Full Bond Portfolio........................................ 29
Table 2. Summary of Technology Mix and Production Volume Trajectory Alignment Relative to the Paris
Agreement Goal and Market Benchmarks .............................................................................................................. 47

Acronyms
AuM         Assets Under Management
2DII        2 Degrees Investing Initiative
2DS         2 Degrees Scenario; ~2°C
B2DS        Beyond the 2° Scenario; 2.7°C
DFS         Department of Financial Services
ESG         Environmental, social, and governance
ETP         Energy Technology Perspectives

                                                                                                                                                                                  3
EV      Electric Vehicle
GDP     Gross Domestic Product
HDV     Heavy duty vehicles
ICE     Internal Combustion Engine
IEA     International Energy Agency
IPCC    Intergovernmental Panel on Climate Change
IRENA   International Renewable Energy Agency
LDV     Light duty vehicles
NAIC    National Association of Insurance Commissioners
NGFS    Network for Greening the Financial Systems
OECD    Organization for Economic Co-operation and Development
PACTA   Paris Agreement Capital Transition Assessment
PRI     Principles for Responsible Investment
RTS     Reference Technology Scenario
SBT     Science Based Target
SDS     Sustainable Development Scenario; 1.75 – 2°C (this is Paris Agreement-aligned)
STEPS   Stated Policy Scenario; 2 – 2.7°C
TCFD    Task Force on Climate-related Financial Disclosures
WEO     World Energy Outlook

                                                                                         4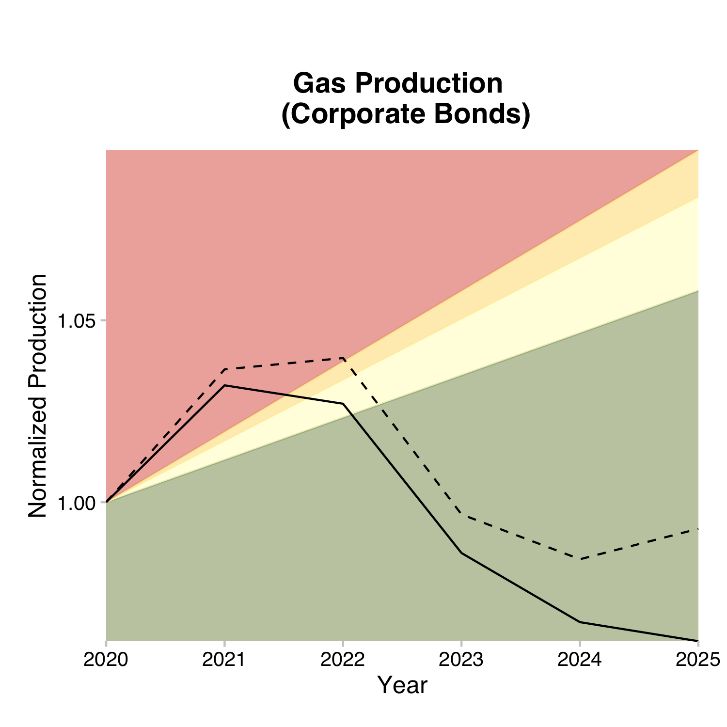
Disclaimer
This report reflects a study (the “Study”) performed by 2 Degrees Investing Initiative (“2DII”), an independent,
non-profit think tank working to align the financial sector with international climate goals, at the request of the
New York State Department of Financial Services (“DFS”). The Study uses certain methodologies to analyze data
from the 2019 Schedule D of 250 New York domestic insurers. The purpose of the report is to provide an example
of a tool that insurers can use to assess their transition risks, as well as investment-related strategies that insurers
can implement to mitigate those risks. DFS expressly disclaims legal liability and/or responsibility for reliance on
information or data contained in this report. If DFS receives a Freedom of Information Law (“FOIL”) request for
an individual insurer’s data in the report that DFS considers subject to FOIL under the New York State Public
Officers Law, DFS will assert exemptions under FOIL that DFS deems applicable in response to that request to
protect the confidentiality of the data, and notify the insurer of such request.

Executive Summary
Climate change poses wide-ranging and material risks to the financial system. This is especially true for the
insurance industry, where the physical and transition risks resulting from climate change affect both sides of
insurers’ balance sheet—assets and liabilities—as well as their business models. Climate change also presents
tremendous opportunities for insurers, which play a critical role in the management of climate-related financial
risks (“climate risks”) in their capacity as risk managers, risk carriers, and investors.
DFS recently issued proposed Guidance for New York Domestic Insurers on Managing the Financial Risks from
Climate Change, which highlights the importance for insurers to consider the impact of both physical and
transition risks on their assets and liabilities. As a general matter across the industry, the impact of climate change
on insurers’ investments receives less attention than the impact of climate change on insurers’ liabilities, and low-
carbon transition risks are less understood than climate-related physical risks.
To support insurers in their efforts, DFS asked 2DII to analyze the transition risk exposure of New York domestic
insurers (“insurers”) based on the equity and corporate bond holdings from their 2019 Schedule D data. Based
on the methodologies used in the Study, the data shows that, in the aggregate, insurers’ assets were
meaningfully exposed to transition risks. There are several tools available to help insurers analyze their transition
risks and inform actions that they can take to mitigate them.1 The Study provides one example and also outlines
investment-related strategies that insurers can consider to mitigate their transition risk exposure. DFS recognizes
that climate risks are one of many factors, including financial returns and risk controls, that an insurer should
consider when making investment decisions.

Physical and Transition Risks from Climate Change Are Accelerating
Climate-related natural disasters have continued to worsen in recent years. The number of billion-dollar disasters
in 2020 was twice the average number of annual billion-dollar disasters for the 2010s, and more than three times
the corresponding figure for the 2000s.2 At the current rate, we are likely to reach the 1.5oC warming limit, the
preferred goal set forth in the Paris Agreement, in less than a decade.3
While the physical risks from climate change continue to worsen, risks arising out of the low-carbon transition
are also accelerating as a result of three primary transition risk drivers: policy and regulation changes, low-

1
  Climate scenario analysis, Principles for Responsible Investment, accessed on May 25, 2021.
2
  National Oceanic and Atmospheric Administration, Billion-Dollar Weather and Climate Disasters: Overview, accessed on
March 15, 2021.
3
  Hausfather, Z., Analysis: When might the world exceed 1.5C and 2C of global warming?, December 4, 2020.

                                                                                                                         5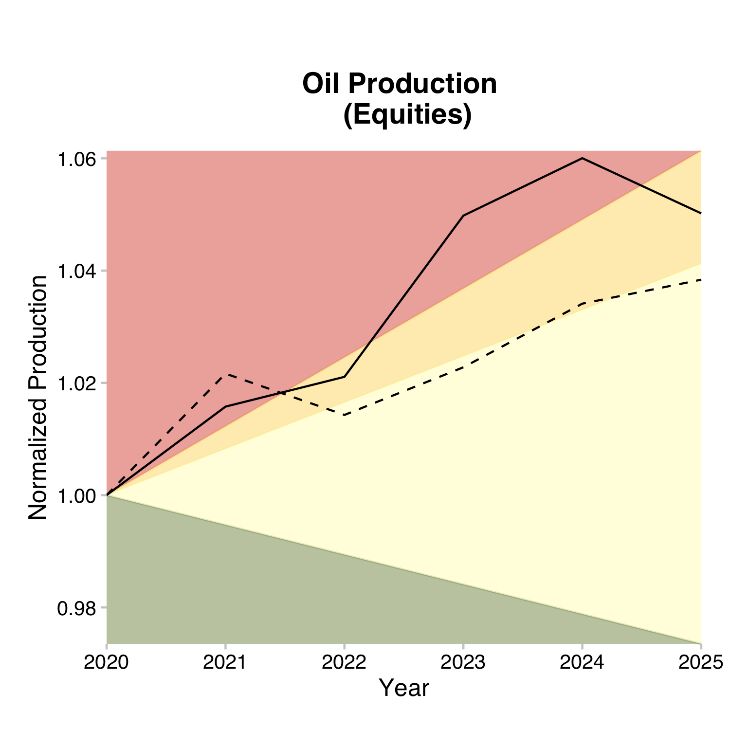
carbon technology advancement, and changing public sentiment and demand patterns. The most recent global
energy roadmap of the International Energy Agency (“IEA”), which is used by countries and corporations to plan
for energy investments,4 forecasts that coal, oil, and gas demand will fall by 98%, 75%, and 55%, respectively,
between 2020 and 2050.5 Examples of key milestones in the IEA pathway to net-zero emissions include ensuring
that all new buildings are zero-carbon-ready and that 60% of global car sales are electric by 2030.
Insurers may be exposed to these transition risks, as well as the opportunities presented by these risks, on the
asset side through their holdings of corporate bonds and equities. On the policy and regulation front, the U.S. has
rejoined the Paris Agreement, whose goal is to keep global temperature rise in this century to well below
2°C above pre-industrial levels. As of March 2021, ten G20 jurisdictions have announced net-zero greenhouse gas
emission targets.6 Multiple countries and the State of California have plans to ban gasoline car sales in the coming
decades.7 Further policy changes are likely in the pipeline, such as the introduction of a national carbon pricing
system in the U.S. and more countries banning fossil fuel cars and vans.8
Innovation in low-carbon technologies is also growing rapidly. The IEA expects renewables to overtake coal and
become the largest source of electricity generation worldwide, supplying one-third of the world’s electricity, by
2025.9 The lifetime ownership cost of electric vehicles for most models in the market right now is approximately
$6,000-$10,000 less than the cost of owning gasoline cars. 10 Public sentiment on climate change has shifted
significantly over time as well. According to a 2020 Yale University survey, 63% of U.S. adults are worried about
global warming compared to 52% in 2014. 11 There has also been a proliferation in climate-related lawsuits
worldwide, with 1,763 cases pending as of March 2021.12
Responding to the change in public sentiment, many corporations have made net zero carbon emission pledges.
As of September 2020, more than 1,100 businesses with a combined revenue of over $11.4 trillion (equivalent to
more than half of the U.S. GDP) have pledged to be net zero by the end of the century, with the majority aiming
for 2050.13 Asset owners, asset managers, and banks have made similar pledges. The Net Zero Asset Owner
Alliance is comprised of 35 institutional investors, including several insurers, with assets under management of
$5.5 trillion that have committed to transition their investment portfolios to net zero by 2050.14 While net zero
commitments are not the same as actions, they are a good indication of where the market is headed.

4
  Rathi., A., et. al., The World’s Top Energy Agency Reckons With Net-Zero Emissions, Bloomberg Green, May 18, 2021.
5
  Net Zero by 2050 – A Roadmap for the Global Energy Sector, the International Energy Agency, May 2021.
6
  The Inevitable Policy Response 2021: Policy Forecast, Principles for Responsible Investment, March 17, 2021. These
countries are Argentina, Brazil, Canada, China, France, U.K., Germany, South Africa, Japan, Korea, and the E.U. As of 2020,
more than 900 cities have net zero targets as well.
7
  Calma, J., The UK moves up deadline to ban the sale of combustion-engine vehicles, The Verge, November 17, 2020.
Governor Newsom Announces California Will Phase Out Gasoline-Powered Cars & Drastically Reduce Demand for Fossil
Fuel in California’s Fight Against Climate Change, CA.gov, September 23, 2020.
8
  The Inevitable Policy Response 2021: Policy Forecast, Principles for Responsible Investment, March 17, 2021.
9
  Renewables 2020 - Analysis and forecast to 2025, International Energy Agency, November 2020.
10
   Harto, C., Electric Vehicle Ownership Costs: Today’s Electric Vehicles Offer Big Savings for Consumers, Consumer Reports,
October 2020.
11
   Yale Climate Opinion Maps 2020, Yale Program on Climate Change Communication, September 2, 2020. Yale Climate
Opinion Maps – U.S. 2014, Yale Program on Climate Change Communication, April 6, 2015.
12
   Climate Change Litigation Databases, Sabin Center for Climate Change Law at Columbia Law School and Arnold & Porter,
accessed on March 23, 2021.
13
   Net Zero Asset Managers Initiative Triples in Assets Under Management as 43 New Asset Managers Commit to Net Zero
Emissions goal, NET ZERO ASSET MANAGERS INITIATIVE, accessed on March 29, 2021.
14
   UNITED NATIONS-CONVENED NET-ZERO ASSET OWNER ALLIANCE, UN Environment Programme Finance Initiative,
accessed on March 29, 2021.

                                                                                                                           6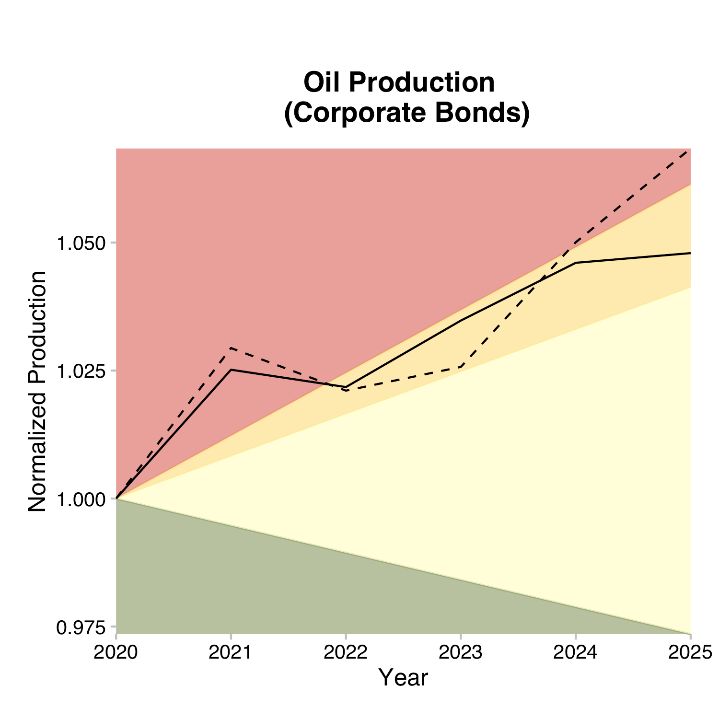
Climate Risks have Manifested in the Financial Market and Drawn Regulators’ Attention
These transition risk drivers can lead to stranded assets, which “turn out to be worth less than expected as a
result of changes associated with the energy transition.”15 The total value of stranded assets across upstream
energy, power generation, industry and buildings under a delayed policy action scenario has been estimated at
$20 trillion.16 The impacts of transition risk drivers have manifested themselves in the financial market. Fossil
fuel companies’ stocks have significantly underperformed relative to renewable companies in the past few years,
while loan spreads for new coal mines have risen by 65% in the last decade compared to the previous one.17
Rating agencies have taken notice, with S&P downgrading several oil producers because of “growing risks from
energy transition due to climate change” and those companies’ insufficient actions to mitigate these risks. 18
Institutional investors like BlackRock,19 the largest U.S. pension fund CalPERS,20 and the largest U.K. corporate
defined benefit pension scheme BT Pension Scheme21 also view climate risks as investment risks.
U.S. federal financial regulators have started to focus on the financial risks from climate change. The Federal
Reserve Board recently created a Supervision Climate Committee and a Financial Stability Climate Committee.22
Globally, central banks and financial supervisors have continued to strengthen their work on climate change. The
Network of Central Banks and Supervisors for Greening the Financial System (“NGFS”) has 90 members and 14
observers as of April 2021. 23 The U.K. and New Zealand governments have mandated that large financial
institutions and listed companies provide climate-related financial disclosures in accordance with the
recommendations of the Task Force on Climate-related Financial Disclosures (“TCFD”).24 Financial supervisors like
the Bank of England and the European Central Bank are also increasingly turning to scenario analysis and stress
testing to gauge firms’ exposure to the financial risks from climate change.25

Methodology
2DII analyzed the equity and corporate bond investment portfolios of 250 insurers, including health, life, and
property and casualty insurers, based on their 2019 Schedule D data. Insurers that held only asset-backed
securities, government bonds, and/or mortgage securities as of 2019 were not covered by the analysis. While

15
   Carbon Tracker Initiative, Stranded Assets, August 23, 2017.
16
   STRANDED ASSETS AND RENEWABLES - How the energy transition affects the value of energy reserves, buildings and
capital stock, International Renewable Energy Agency, July 2017.
17
   Calculated with data from Google Finance and Renewable Energy Producers ETF, Global X by Mirae Asset, accessed on
March 24, 2021. Webb, D., Cost of capital for coal soars as renewables debt costs continue to fall, Responsible Investor,
April 19, 2021.
18
   The Big Picture on Climate Risk, S&P Global, accessed on March 24, 2021.
19
   BlackRock’s Global Executive Committee, Net zero: a fiduciary approach, BlackRock Client Letter, accessed on March 22,
2021.
20
   Climate Change, California Public Employees' Retirement System, accessed on May 19, 2021.
21 BT Pension Scheme, Responsible Investment Transparency Report 2020.

22
   Kevin Stiroh to Step Down as Head of New York Fed Supervision to Assume New System Leadership Role at Board of
Governors on Climate, Federal Reserve Bank of New York, January 25, 2021. Governor Lael Brainard, Financial Stability
Implications of Climate Change, Board of Governors of the Federal Reserve System, at "Transform Tomorrow Today" Ceres
2021 Conference, Boston, Massachusetts (via webcast), March 23, 2021.
23
   Membership of NGFS, Network for Greening the Financial System, accessed on May 19, 2021.
24
   Holger, D., et. al., U.K. Requires Companies to Report on Climate Change by 2025, Wall Street Journal, November 9,
2020; Azizuddin, K., New Zealand becomes world’s first country to introduce mandatory TCFD disclosure, Responsible
Investor, September 15, 2020.
25
   The Bank of England is restarting the Climate Biennial Exploratory Scenario (CBES), Bank of England, November 13, 2020.
de Guindos, L., Shining a light on climate risks: the ECB’s economy-wide climate stress test, the ECB Blog, March 18, 2021.

                                                                                                                              7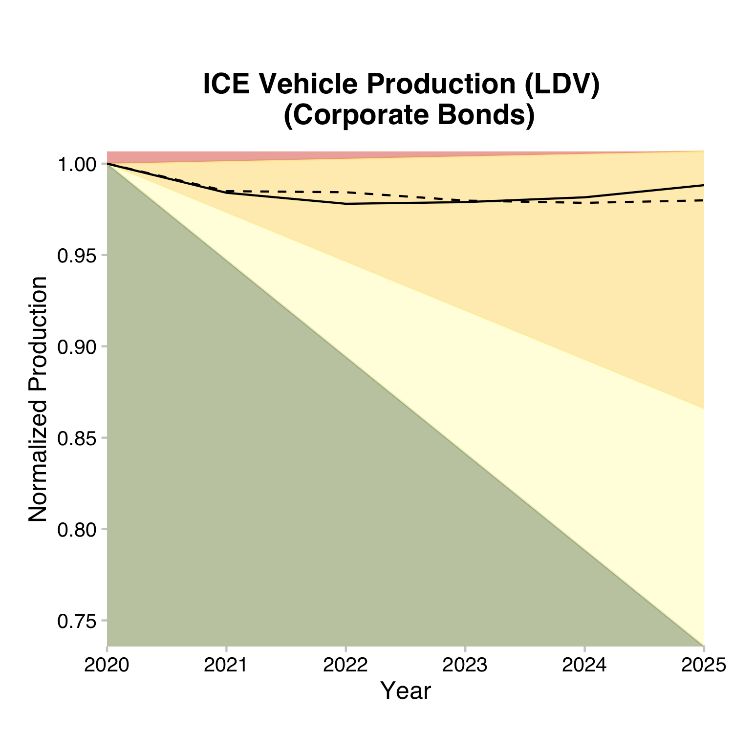
those three types of fixed income securities are not immune to transition risks,26 their transition risks are much
less severe than those affecting the energy, utilities, manufacturing, and transportation sectors that are the focus
of the Study. Of the more than 130,000 individual securities analyzed, nearly 125,000, or 95%, were successfully
matched with 2DII’s financial data.
The Study provides an example of a tool that can be used to analyze insurers’ transition risks and inform actions
that insurers can take to mitigate them. As the data is from 2019, the results are not intended to reflect the
current transition risk exposure of insurers. The exposure and scenario analysis in the Study is based on the open-
source Paris Agreement Capital Transition Assessment (“PACTA”) model, which has been used by more than 3,000
financial institutions, governments, supervisory authorities, and industry associations. The model assesses the
alignment of investors’ and banks’ portfolios with different climate scenarios, ranging from business-as-usual to
alignment with the Paris Agreement (“Paris-aligned”),27 and helps us understand the extent to which financial
portfolios may be exposed to transition risks arising from those scenarios. Not preparing for the transition
today may increase future losses.
PACTA provides a five-year forward-looking, bottom-up analysis that looks at the investment and production
plans of investee companies at the physical asset level, and consolidates that information to identify the energy
transition profile of the companies and their related financial instruments. The model measures what
companies are doing in terms of their capital planning for the next five years, not what they have pledged to
do. PACTA compares what needs to happen in specific sectors to decarbonize in accordance with the Paris
Agreement with the companies’ plans in those sectors over the next five years. The results are given by sector
and sometimes by technology within a sector. For example, the transition risk exposure of an insurer’s
investments in the oil and gas industry depends on the amount of oil and gas that companies in the insurer’s
portfolio plan to produce. For the power sector, the exposure depends on the amount of renewables relative to
the amount of coal or oil or gas-based electricity that the investee companies plan to produce.
The PACTA model is available for corporate bonds and listed equity portfolios, and covers eight of the most
carbon intensive sectors in the economy – oil and gas, coal mining, power generation, automotive, aviation,
shipping, cement, and steel (the “PACTA sectors”). Together, they are responsible for over 75% of all
CO2 emissions by companies represented in the global equity and corporate bonds markets.28 In each of these
sectors, PACTA focuses on the part of their value chain with the highest impact in terms of CO2 emissions. For
example, in the oil and gas sector, the focus is on upstream activities related to production, while in the power
sector the focus is on power generation and related sources of energy.

Climate Scenarios Used in the Study
The scenarios used in the PACTA analysis are:
       a. For Fossil Fuel Production and Power Generation:
            The following scenarios are taken from the IEA’s World Energy Outlook (“WEO”) 2020 publication.29
               i.   Current Policy Scenario (CPS): This is a business-as-usual scenario based on policies that
                    currently exist. It equates roughly to a ≥ 3.2°C global average temperature rise by 2100.

26
   For more information on the transition risks of these securities, see Cevik, S., et. al., This Changes Everything: Climate
Shocks and Sovereign Bonds, IMF Working Paper, June 5, 2020; Schwartzkopff, F., et. al., Sovereign Rating Cuts Coming to
Those Who Ignore the Climate, Bloomberg Green, March 17, 2021; St. Peter, E., Climate-Related Muni Bond Risk: A Q&A
with Breckinridge Capital Advisors, University of Pennsylvania Wharton Business School, January 8, 2020; and Reid, B.,
Measuring Climate Risk in Real Estate Portfolios, MSCI, July 8, 2020.
27
   PACTA / Climate Scenario Analysis Program, 2-Degrees Investing Initiative, accessed on May 19, 2021.
28
   This high-level estimate by 2DII is based on the World Resources Institute’s greenhouse gas emissions data.
29
   World Energy Outlook 2020, International Energy Agency, October 2020.

                                                                                                                                8
ii.  Stated Policy Scenario (STEPS): This scenario assumes that announced policies will be
                    implemented in the future. It equates roughly to a 2.7°C global average temperature rise by
                    2100.
             iii.   Sustainable Development Scenario (SDS): This scenario looks to achieve the goals set out in
                    the United Nations Sustainable Development Goals. It equates roughly to a 1.75 – 2°C global
                    average temperature rise by 2100. This scenario is Paris-aligned.
         b. For Automotive:
            The following scenarios are taken from the IEA’s Energy Technology Perspectives (“ETP”) 2017
            publication.30
                i.   Reference Technology Scenario (RTS): This is a business-as-usual scenario. It equates roughly
                     to a ≥ 3.2°C global average temperature rise by 2070.
               ii.   2 Degrees Scenario (2DS): This scenario aims to limit global average temperature rise to 2°C
                     by 2100.
              iii.   Beyond 2 Degrees Scenario (B2DS): This scenario aims to limit global average temperature to
                     ≤ 1.75°C by 2100. This scenario is Paris-aligned.

Low-carbon technology pathways to achieve the 2 Degrees Scenario have not been established for the steel,
cement, aviation, and shipping industries. As a result, the Study merely analyzes insurers’ holdings in these
industries as a percentage of their overall equity and corporate bond portfolios.

Analysis Findings
The Study shows that:
     •   New York domestic insurers’ investments in 2019 had meaningful exposure to carbon intensive
         sectors.

     •   The five-year forward-looking capital plans of most insurers’ investee companies in these sectors
         were not Paris-aligned, except for natural gas production, natural gas-fired power generation, and
         electric vehicle production.

     •   In many cases, insurers’ portfolios were less Paris-aligned than market benchmarks (i.e. Bloomberg
         Barclays Global Aggregate Corporate Bond Index31 for corporate bonds and MSCI All Country World
         Index32 for equities).
Carbon intensive sectors make up about 11% of all insurers’ assets in equities and fixed income (inclusive of
government bonds and other fixed income securities), or 17.2% of their holdings in equities and corporate bonds.
Life insurers’ exposure to these sectors in their corporate bond portfolios was 20%, which was much larger than
the corresponding exposure of P&C and health insurers. This is due in large part to life insurers’ greater exposure
to power generation. This is not surprising given that electric utility companies have long-dated assets funded
through the issuance of long-dated bonds, which match the long duration of life insurers’ liabilities. This can be
seen in Figure 0.1 and Figure 0.2.

30
   Energy Technology Perspectives 2017, International Energy Agency, June 2017.
31
   Bloomberg Barclays Global Agg Corporate Total Return Index, Bloomberg.
32
   MSCI ACWI, MSCI.

                                                                                                                 9
Figure 0.1. Percentage of Investments in the PACTA Sectors for Corporate Bonds and Listed Equities Holdings

                    Figure 0.2. Percent Distribution of Investment Value in the PACTA Sectors
Exposure to high-carbon technologies varies dramatically among individual insurers. Figure 0.3 shows insurers’
holdings in fossil fuel production as a percentage of their corporate bond and equity portfolios. Each vertical line
represents one insurer. The color of the line reflects the insurance segment – Health, Life, or P&C. While most

                                                                                                                 10
insurers had single-digit exposures to the fossil fuel sector, multiple P&C insurers and a few Life insurers had
exposures that were significantly higher. One Life entity was exposed more than 50% and one P&C entity was
exposed more than 40% in their corporate bond portfolios, while one P&C insurer had all its equity investments
in the fossil fuel sector.
Corporate Bonds Equities
Figure 0.3. Peer Comparison of Insurers’ Holdings in Fossil Fuel Production (Coal, Oil, and Gas Production) as a
Percentage of the Corporate Bond and Equity Portfolios
Going beyond the percentage holdings of carbon intensive sectors, the picture of insurers’ investments in high-
and low-carbon technologies (“technology mix,” see Table 0.1) and their alignment with the Paris Agreement was
somewhat mixed. For fossil fuel production, while the five-year capital plans of gas production by the
companies that insurers invested in were Paris-aligned, the five-year capital plans of coal and oil production
were not. For example, the alignment of coal production in the insurers’ corporate bond portfolios relative to the
various climate scenarios is shown in Figure 0.4.
Figure 0.4 depicts the production volume trajectory metric, which measures the alignment of a portfolio’s
projected production volume over the next five years with the production volume ranges set as targets in different
climate scenarios. The Y-axis shows the normalized production capacity planned for the next five years, with the
current capacity represented as 1. The solid line in the figure represents the change in production volume of the
insurer’s portfolio, while the dotted line represents the change in production volume of the market benchmark
(i.e., Bloomberg Barclays Global Aggregate Corporate Total Return Index for corporate bonds and MSCI All Country
World Index for equities), between 2020 and 2025. The colored areas represent the production volume ranges
that are compatible with different climate scenarios. The colored area(s) that any given production volume
trajectory falls in indicates the climate scenario with which that production volume is aligned. As shown in Figure
0.4, the five-year capital plans of coal production by insurers’ investee companies were aligned with a >3.2oC
scenario.
High-Carbon Technologies Low-Carbon Technologies
Power Generation Coal, oil, and gas-fired power plants Renewable power (solar, wind)
Transportation Internal combustion engine vehicles Hybrid and electric vehicles
Table 0.1. Technology Mix – High- and Low-Carbon Technologies for Carbon Intensive Sectors
11The amount of coal production
allocated to the insurers’
corporate bond portfolios
based on their holdings, based The production volume
on the five-year capital plan of range that is compatible
the investee companies. with the >3.2oC scenario
CPS: 3.2oC
The amount of coal production STEPS: 2.7oC
of the market benchmark.
The production volume
Colored areas denote the range that is compatible
production volume ranges that with the 2 – 2.7oC
are compatible with different scenario
climate scenarios.
SDS: 1.75-2oC
SDS STEPS CPS
Insurers’ portfolio
≤2°C 2°C-2.7°C 2.7°C-3.2°C ≥3.2°C
Market benchmark
Figure 0.4. Alignment of Coal Production in the Corporate Bond Portfolio Relative to the IEA Transition Scenarios
For power generation, the technology mix and the projected trajectories of production volume for high- and low-
carbon technologies over the next five years (“production volume trajectories”) tell a similar story. Insurers were
overinvested in coal and oil-fired power generation and underinvested in renewables, while their investments
in gas-fired power generation were Paris-aligned (see Figure 0.5). For coal-fired power generation, while the
rate of reduction by the utility companies that insurers invested in was fast enough to be Paris-aligned (see
Figure 0.6), the size of coal-fired power generation relative to other forms of power generation was too large
to be Paris-aligned (see Figure 0.5). See the box below for a comparison of the different metrics used to measure
climate scenario alignment.
12Figure 0.5. High-Carbon and Low-Carbon Technology Mix for the Power Sector
SDS STEPS CPS
Insurers’ portfolio
≤2°C 2°C-2.7°C 2.7°C-3.2°C ≥3.2°C Market benchmark
Figure 0.6. Coal-Fired Power Production Volume Trajectories Relative to Climate Scenarios
For transportation, although insurers invested sufficiently in electric vehicles to be Paris-aligned, they
underinvested in hybrid vehicles and overinvested in internal combustion vehicles.
When insurers underinvest in low-carbon technologies, they miss out on many of the opportunities that arise
from the transition. This means that the potential loss in returns from carbon intensive technologies are unlikely
to be offset by the potential increase in returns from low-carbon technologies.
13Table 0.2 summaries insurers’ investments in high- and low-carbon technologies and their alignment with the
Paris Agreement. For example, for coal power generation under “Technology Mix Relative to Paris
Goal”/“Corporate bonds,” “too much” means that the ratio of coal power generation to low-carbon power
generation planned by the investee companies in insurers’ corporate bond portfolios was too high to be Paris-
aligned. The “3.2oC >3.2oC Worse Worse
2.7-
Oil production 2.7-3.2oC Better Worse
3.2oC
Natural gas
3.2 C Similar Similar
Internal
Slightly Slightly 2.7-
combustion Too much Too much 2.7-3.2oC Similar Similar
less less 3.2oC
engine vehicles
Table 0.2. Summary of Technology Mix and Production Volume Trajectory Alignment Relative to the Paris
Agreement Goal and Market Benchmarks
14DIFFERENT METRICS OF MEASURING CLIMATE SCENARIO ALIGNMENT
The technology mix metric and the production volume trajectory metric both provide an indication of how
aligned the investee companies’ capital plans are with the Sustainable Development Scenario. However, they
differ in that the technology mix metric is a measure of the relative amounts invested in different climate-
relevant technologies within an investor’s portfolio, while the production volume trajectory measures
whether the rate of change in the production amount is sufficient to meet the Sustainable Development
Scenario. For example, it is possible that renewable power generation makes up a large portion of an
investor’s portfolio relative to carbon intensive power generation, resulting in a portfolio that is aligned with
the Sustainable Development Scenario from a technology mix perspective. Yet the rate of increase of
renewable power generation may be too small to meet the same scenario from a production volume
trajectory perspective.
Translating this to monetary terms, if the economy were to follow the Sustainable Development Scenario,
then the power generation portion of the insurer’s investment might not be negatively affected but the
upside from the investment in renewable power generation would be limited. In other words, there would
be an opportunity cost as the investor is not financing the required increase in renewables.
The global economy reflected by the equity and bond markets is not yet Paris-aligned. In that case, how much
room is there for insurers to adjust their investments and reduce their transition risk exposure? This can be
analyzed by comparing the alignment of their investments with those of market benchmarks. On power
generation, insurers underinvested in renewables compared to the market benchmark for corporate bonds.
Therefore, even the simple act of bringing their portfolios in line with market benchmarks would reduce insurers’
transition risk exposure. This is especially true for coal production in both corporate bond and equity investments,
where the production volume trajectories were aligned with a >3.2oC world and worse than the market
benchmarks.33
To help insurers assess, and develop strategies to mitigate, their exposure to transition risks, DFS also requested
that 2DII generate individual reports for insurers covered by the Study, which will be shared with each such insurer.
Any insurer can create its own report by uploading its bond and equity positions into the open-source PACTA
model. In addition to the analysis set forth in the Study, individual reports include information on investee
companies that have the biggest influence on an insurer’s portfolio’s technology mix and production volume
trajectory. This information could help an insurer in its efforts to mitigate its exposure to transition risks, such as
identifying priority investee companies that are most misaligned with a 2oC scenario for potential engagement, as
described below.
Strategies for Mitigating Transition Risks
Insurers can use several investment-related strategies to mitigate their exposure to transition risks, including:
- Divestment: selling instruments from issuers in carbon intensive sectors who are not making the low-
carbon transition or are not transitioning fast enough.
33
Obviously, an investment decision requires many considerations, including price, liquidity, and asset-liability matching,
which may prevent insurers from matching the market benchmark.
15- Investment: investing in issuers whose businesses support the low-carbon transition, such as renewables
and electric vehicles, or in their suppliers. Green bonds are one type of fixed income instrument whose
proceeds are earmarked for climate-related or environmental projects.34
- Exclusion: systematically excluding issuers with high climate risks based on a set of criteria, which can
come in the form of thresholds (e.g., excluding companies that derive more than 10% of their revenue
from mining thermal coal or account for more than 1% of total global production), a theme (e.g., excluding
construction of new and improvements to existing coal-fired thermal power plants), or an industry (e.g.,
excluding thermal coal producers).
- Engagement: using their power as investors to influence corporate behavior on climate-related topics.
Forms of engagement may include direct corporate engagement (e.g., communication with company
boards and senior management), proxy voting, and filing or co-filing shareholder proposals.
o Although insurers are primarily bond investors that, unlike equity investors, do not have proxy
voting rights, engagement is still possible. Bondholders provide capital to corporations and often
have a direct line of access and communication to management. They can express their views on
climate-related topics during the underwriting process by incorporating certain contractual
provisions in the financing documentation prior to any new issuance.35 As bonds frequently need
to be refinanced at maturity, bondholders potentially have a lot of leverage over the companies
they invest in if they choose to reinvest only if the companies undertake certain practices.36 Bond
investors can also link the interest rate of a bond to certain covenants and climate-related key
performance indicators, as with sustainability-linked bonds (see below).
o Although this strategy may be more effective for insurers with large allocations at bond issuance,
smaller insurers can band together, either directly or through industry networks or their asset
managers, to implement this strategy.
- Setting climate-related investment conditions: including climate-related factors as part of the contractual
conditions of a financial instrument. These conditions seek to influence the climate performance of
issuers to reduce their potential risk exposure. Sustainability-linked bonds are one such example where
“the financial and/or structural characteristics can vary depending on whether the issuer achieves
predefined sustainability/ESG objectives.”37 These objectives must be science-based and the financial
and/or structural characteristics must be material to ensure performance change in borrowers and avoid
greenwashing.38
As stated in DFS’s proposed Guidance for New York Domestic Insurers on Managing the Financial Risks from
Climate Change, DFS is focused on the financial stability of insurers in the face of climate change. While insurers
are expected to understand and manage their exposure to climate-related financial risks, DFS does not dictate
insurers’ investment activities. In addition, each insurer should take a proportionate approach to managing
climate risks that reflects its unique exposure and the nature, scale, and complexity of its business. Accordingly,
the strategies outlined above are provided as potential options for insurers to evaluate and may not be applicable
to all insurers. When evaluating any transition risk mitigation strategy, insurers should consider financial returns
and asset-liability matching, among other factors. Insurers that outsource their investment function to third-party
34
Explaining green bonds, Climate Bonds Initiative, accessed on May 26, 2021.
35
Phillips, Y., No voting rights? Engagement still matters in fixed income, Russell Investment Blog, August 4, 2020.
36
Inderst, G., et. al., Incorporating ENVIRONMENTAL, SOCIAL and GOVERNANCE (ESG) Factors into FIXED INCOME
INVESTMENT, World Bank Group publication, April 2018.
37
International Capital Market Association, Sustainability-Linked Bond Principles Voluntary Process Guidelines, June 2020.
38
Hurley, M., Nuveen: Sustainability-linked bonds fail our impact credibility test, Environmental Finance, May 25, 2021.
16asset managers can request that the asset managers evaluate and, if appropriate, adopt any of these strategies
on their behalf. Insurers are also encouraged to reach out to networks like the Principles for Responsible
Investment, Net Zero Asset Owner Alliance, and Climate Action 100+ to learn more about what they can do
individually and collectively to mitigate transition risks.
Conclusion
Based on their 2019 Schedule D data and the methodologies used in the Study, in the aggregate, insurers’ assets
were meaningfully exposed to transition risks. There are several tools available to help insurers analyze their
transition risks and inform actions that they can take to mitigate them. The Study provides one example and
outlines investment-related strategies that insurers can consider to mitigate their transition risk exposure.
17QUESTIONS ANSWERED IN THE STUDY
The Study allows insurers to answer the following questions to understand their exposure to transition risks
and opportunities, listed from the simplest to the most nuanced:
1. What holdings in my portfolio are most exposed to transition risks and how much do they comprise of
my total portfolio? These questions can be answered by categorizing the holdings by sectors/industries
and quantifying the percentage of carbon intensive sectors/industries as part of the total portfolio, as
shown in Figure 0.1 and Figure 0.2.
2. Some of my holdings in carbon intensive industries are transitioning already by making investments in
renewables or electric vehicles. Some have even set net zero carbon emission targets. How do these
investments or commitments affect my exposure to transition risks and opportunities? PACTA does
not consider whether a company has net zero targets. It looks at the company’s production plans, which
are based on the physical assets that it owns and plans to build. PACTA answers this question by
comparing the technology mix of the investee companies with those of the market benchmark
(Bloomberg Barclays Global Aggregate Corporate Total Return Index for corporate bonds and MSCI All
Country World Index for equities) and what is needed to achieve Paris Agreement goals. Figure 0.5
shows the technology mix for corporate bonds and equities in the power sector. The results of other
carbon intensive sectors are also summarized in Table 0.2.
3. There are multiple scenarios covering whether the world would transition towards a low-carbon
economy. With which scenario is my portfolio aligned? This can be answered by plotting the
production volume trajectories for high- and low-carbon technologies against the trajectories needed to
meet different climate/temperature scenarios. The production volume trajectories are produced based
on the capital plans of insurers’ investee companies for the next five years. Figure 0.4 gives the example
of coal production. The temperature scenarios that the production volume trajectories of various
technologies of the carbon intensive sectors fall under are also summarized in Table 0.2.
A separate but related question is: How does the transition risk exposure of my holdings compare to those
of the market benchmarks and my peers? The aggregate data includes the results of market benchmarks. A
peer comparison is provided in Figure 0.3 for insurers’ holdings in the fossil fuel sectors as a percentage of
their corporate bond and equity portfolios. Peer comparison can also be done by comparing the results in
the individual report for each insurer covered in the Study and the aggregate data. DFS will provide the
individual reports to the relevant insurers.
Lastly, in Section 4. Strategies for Mitigating Transition Risks, the report offers options to respond to the
question: How can I mitigate the transition risks in my portfolio? The individual reports that will be shared
with insurers also answers the question: Which companies are driving the results of my exposure and
alignment?
181. Introduction
As one of the most critical risk-management issues of our generation, climate change poses wide-ranging and
material risks to the financial system. This is especially true for the insurance industry, where the physical and
transition risks resulting from climate change affect both sides of insurers’ balance sheets—assets and liabilities—
as well as their business models. Climate change also presents tremendous opportunities for insurers, which play
a critical role in the management of climate risks in their capacity as risk managers, risk carriers, and investors.
In September 2020, the New York State Department of Financial Services (“DFS”) issued Insurance Circular Letter
No. 15 (2020) on Climate Change and Financial Risks outlining its expectation that insurers start integrating the
consideration of the financial risks from climate change (“climate risks”) into their governance frameworks, risk
management processes, and business strategies, and start developing a climate risk disclosure framework. Since
then, the U.S. has continued to experience a series of devastating natural disasters. 2020 tied with 2016 as the
hottest year on record.39 In 2020, there were 22 weather/climate disaster events in the U.S. with losses exceeding
$1 billion each, more than twice the average number of annual billion-dollar disasters for the 2010s and more
than three times the corresponding figure for the 2000s.40 The unseasonable February freeze in 2021 in Texas
led to massive electricity generation failure, related shortages of water, food, and heat, and estimated property
damage in excess of $195 billion.41
Unless society makes major changes, this worsening trend is going to continue and likely accelerate as a result of
the feedback loops caused by the warming: the ice sheet melt that allows the Earth to absorb more heat; the
thawing of permafrost, which releases methane, a gas with 21 times the global warming potential of carbon
dioxide (“CO2“); more intensive fire seasons resulting in the release of more CO2; and Amazon rainforests starting
to emit rather than absorb carbon due to drought, higher temperatures, and deforestation.42 The goal of the Paris
Agreement, which was signed by 196 countries, is to “limit global warming to well below 2, preferably to 1.5
degrees Celsius, compared to pre-industrial levels.”43 We are likely to reach the 1.5oC warming limit within a
decade.44
1.1. The Low-Carbon Transition Is Accelerating
While the physical risks from climate change continue to worsen, risks arising out of the low-carbon transition are
also accelerating as a result of three primary transition risk drivers: policy and regulation changes, low-carbon
technology advancement, and changing public sentiment and demand patterns. The International Energy
Agency’s most recent global energy roadmap, which is used by countries and corporations to plan for energy
investments,45 forecasts that coal, oil, and gas demand will fall by 98%, 75%, and 55%, respectively, between 2020
and 2050.46 Examples of key milestones in the IEA pathway to net-zero emissions include ensuring that all new
buildings are zero-carbon-ready and that 60% of global car sales are electric by 2030. Insurers may be exposed to
39
Thompson, A., NASA Says 2020 Tied for Hottest Year on Record, Scientific American, January 14, 2021.
40
National Oceanic and Atmospheric Administration, Billion-Dollar Weather and Climate Disasters: Overview, accessed on
March 15, 2021.
41
Ivanova, I., Texas winter storm costs could top $200 billion — more than hurricanes Harvey and Ike, CBS News, February
25, 2021.
42
2020 Tied for Warmest Year on Record, NASA Analysis Shows, The National Aeronautics and Space Administration,
January 14, 2021. Harvey, F., Tropical forests losing their ability to absorb carbon, study finds, the Guardian, March 4, 2020.
43
The Paris Agreement, United Nations Climate Change, accessed on April 18, 2021.
44
Hausfather, Z., Analysis: When might the world exceed 1.5C and 2C of global warming?, December 4, 2020.
45
Rathi., A., et. al., The World’s Top Energy Agency Reckons With Net-Zero Emissions, Bloomberg Green, May 18, 2021.
46
Net Zero by 2050 – A Roadmap for the Global Energy Sector, the International Energy Agency, May 2021.
19these transition risks, as well as the opportunities presented by these risks, on the asset side through their holdings
of corporate bonds and equities.
1.1.1. Transition Risk Driver – Policy and Regulation Change
On the day of his inauguration, President Biden issued an executive order beginning the 30-day process for the
U.S. to rejoin the Paris Agreement, which is signed by 196 countries committed to keeping global temperature
rise within the century to well below 2°C above pre-industrial levels. The goals of the January 27, 2021 executive
order include a carbon-free power sector by 2035 and a net-zero economy for the U.S. by 2050.47 On April 22,
2021, Earth Day, the Biden administration announced a new target for the U.S.: “a 50-52 percent reduction from
2005 levels in economy-wide net greenhouse gas pollution in 2030.” 48 U.S. Treasury Secretary Janet Yellen
created a new Treasury climate “hub” to examine financial system risks arising from climate change and related
tax policy incentives and has called climate change an "existential threat."49 Climate change and its potential
impact on financial stability were discussed at a Financial Stability Oversight Council meeting on March 31, 2021
with members publicly indicating their support for the Council to explore the issue of climate change.50
Globally, governments are taking climate measures. As of March 2021, ten G20 jurisdictions have announced
net zero greenhouse gas emission targets.51 China, the largest emitting country in the world, plans to launch a
national emission trading scheme by the end of June 2021, which means that one-fifth of all global emissions will
fall under a tax or trading scheme.52 Canada plans to increase carbon prices by CAN$15 per metric ton per year
after 2022 through 2030,53 which means that the price could reach CAN$170 (approximately US$136) per metric
ton by 2030. The U.K. and Germany have plans to phase out coal by 2024 and 2038, respectively. On the
transportation front, the U.K. government has planned to ban the sale of new combustion-engine vehicles by
2030,54 and California has announced a similar ban by 2035.55 In July 2020, a group of 15 U.S. states and the
District of Columbia signed a joint memorandum of understanding aimed at boosting the market for electric
medium- and heavy-duty vehicles and phasing out diesel-powered trucks by 2050.56
Further policy changes are likely in the pipeline. Principles for Responsible Investment, which had 3,038
signatories with $103.4 trillion assets under management as of the end of 2020 (including 38 insurance
companies),57 recently analyzed likely policy responses to achieve the Paris Agreement. It estimated that the U.S.
would announce a national carbon pricing system by 2025, and perhaps even as early as 2023, with the goal of
reaching a carbon price of at least $65 per metric ton by 2030, and implementing a binding and credible 100%
47
FACT SHEET: President Biden Takes Executive Actions to Tackle the Climate Crisis at Home and Abroad, Create Jobs, and
Restore Scientific Integrity Across Federal Government, the White House, January 27, 2021.
48
FACT SHEET: President Biden Sets 2030 Greenhouse Gas Pollution Reduction Target Aimed at Creating Good-Paying
Union Jobs and Securing U.S. Leadership on Clean Energy Technologies, the White House, April 22, 2021.
49
Warmbrodt, Z., Yellen names Treasury climate czar, Politico, April 19, 2021.
50
Lang, H., Yellen's priorities at FSOC: Climate risk, hedge funds, bond market, American Banker, March 31, 2021.
51
The Inevitable Policy Response 2021: Policy Forecast, Principles for Responsible Investment, March 17, 2021. These
countries are Argentina, Brazil, Canada, China, France, U.K., Germany, South Africa, Japan, Korea, and the E.U. As of 2020,
more than 900 cities have net zero targets as well.
52
Murtaugh, D., China’s Carbon Market to Grow to $25 Billion by 2030, Citi Says, Bloomberg Green, March 8, 2021.
53
A Healthy Environment and a Healthy Economy, Government of Canada, March 8, 2021.
54
Calma, J., The UK moves up deadline to ban the sale of combustion-engine vehicles, The Verge, November 17, 2020.
55
Governor Newsom Announces California Will Phase Out Gasoline-Powered Cars & Drastically Reduce Demand for Fossil
Fuel in California’s Fight Against Climate Change, CA.gov, September 23, 2020.
56
Shepardson, D., 15 U.S. states to jointly work to advance electric heavy-duty trucks, Reuters, July 14, 2020.
57
About the PRI, Principles for Responsible Investment, accessed on March 22, 2021.
20You can also read