CROATIA CLIMATE RISK COUNTRY PROFILE - ReliefWeb
←
→
Page content transcription
If your browser does not render page correctly, please read the page content below
CLIMATE RISK COUNTRY PROFILE

        CROATIA
COPYRIGHT
© 2021 by the World Bank Group
1818 H Street NW, Washington, DC 20433
Telephone: 202-473-1000; Internet: www.worldbank.org

This work is a product of the staff of the World Bank Group (WBG) and with external contributions. The opinions, findings,
interpretations, and conclusions expressed in this work are those of the authors and do not necessarily reflect the views or the
official policy or position of the WBG, its Board of Executive Directors, or the governments it represents.

The WBG does not guarantee the accuracy of the data included in this work and do not make any warranty, express or implied,
nor assume any liability or responsibility for any consequence of their use. This publication follows the WBG’s practice in
references to member designations, borders, and maps. The boundaries, colors, denominations, and other information shown
on any map in this work, or the use of the term “country” do not imply any judgment on the part of the WBG, its Boards, or the
governments it represents, concerning the legal status of any territory or geographic area or the endorsement or acceptance
of such boundaries.

The mention of any specific companies or products of manufacturers does not imply that they are endorsed or recommended
by the WBG in preference to others of a similar nature that are not mentioned.

RIGHTS AND PERMISSIONS
The material in this work is subject to copyright. Because the WBG encourages dissemination of its knowledge, this work may
be reproduced, in whole or in part, for noncommercial purposes as long as full attribution to this work is given.

Please cite the work as follows: Climate Risk Profile: Croatia (2021): The World Bank Group.

Any queries on rights and licenses, including subsidiary rights, should be addressed to World Bank Publications, The World Bank
Group, 1818 H Street NW, Washington, DC 20433, USA; fax: 202-522-2625; e-mail: pubrights@worldbank.org.

Cover Photos: © Sean MacEntee, “Croatia” June 2, 2011 via Flickr, Creative Commons CC BY-NC-ND 2.0. © John Mackedon/
World Bank, “Pula Arena” September 21, 2013 via Flickr, Creative Commons CC BY-NC-ND 2.0.

Graphic Design: Circle Graphics, Reisterstown, MD.

CLIMATE RISK COUNTRY PROFILE: CROATIA                                                                                         ii

ACKNOWLEDGEMENTS
This profile is part of a series of Climate Risk Country Profiles developed by the World Bank Group (WBG). The country profile
synthesizes most relevant data and information on climate change, disaster risk reduction, and adaptation actions and policies
at the country level. The country profile series are designed as a quick reference source for development practitioners to better
integrate climate resilience in development planning and policy making. This effort is managed and led by Veronique Morin
(Senior Climate Change Specialist, WBG) and Ana E. Bucher (Senior Climate Change Specialist, WBG).

This profile was written by MacKenzie Dove (Senior Climate Change Consultant, WBG). Additional support was provided by
Jason Johnston (Operations Analyst, WBG) and Yunziyi Lang (Climate Change Analyst, WBG).

Climate and climate-related information is largely drawn from the Climate Change Knowledge Portal (CCKP), a WBG online
platform with available global climate data and analysis based on the latest Intergovernmental Panel on Climate Change (IPCC)
reports and datasets. The team is grateful for all comments and suggestions received from the sector, regional, and country
development specialists, as well as climate research scientists and institutions for their advice and guidance on use of climate
related datasets.

CLIMATE RISK COUNTRY PROFILE: CROATIA                                                                                         iii

CONTENTS

FOREWORD  .  .  .  .  .  .  .  .  .  .  .  .  .  .  .  .  .  .  .  .  .  .  .  .  .  .  .  .  .  .  .  .  .  .  .  . 1

COUNTRY OVERVIEW .   .   .   .   .   .   .   .   .   .   .   .   .   .   .   .   .   .   .   .   .   .   .   .   .   .   .   .   .   .   .  2
   Green, Inclusive and Resilient Recovery .  .  .  .  .  .  .  .  .  .  .  .  .  .  .  .  .  .  .  .  .  .  .  .  .  .  .  .  .  . 3

CLIMATOLOGY  .   .   .   .   .   .   .   .   .   .   .   .   .   .   .   .   .   .   .   .   .   .   .   .   .   .   .   .   .   .   .   .   .   .   3
   Climate Baseline .  .  .  .  .  .  .  .  .  .  .  .  .  .  .  .  .  .  .  .  .  .  .  .  .  .  .  .  .  .  .  .  .  .  .  .  .  .  .  .           3
      Overview  .  .  .  .  .  .  .  .  .  .  .  .  .  .  .  .  .  .  .  .  .  .  .  .  .  .  .  .  .  .  .  .  .  .  .  .  .  .  .  .  .  .         3
      Key Trends .  .  .  .  .  .  .  .  .  .  .  .  .  .  .  .  .  .  .  .  .  .  .  .  .  .  .  .  .  .  .  .  .  .  .  .  .  .  .  .  .           6
   Climate Future .  .  .  .  .  .  .  .  .  .  .  .  .  .  .  .  .  .  .  .  .  .  .  .  .  .  .  .  .  .  .  .  .  .  .  .  .  .  .  .  .          7
      Overview  .  .  .  .  .  .  .  .  .  .  .  .  .  .  .  .  .  .  .  .  .  .  .  .  .  .  .  .  .  .  .  .  .  .  .  .  .  .  .  .  .  .         7
      Key Trends .  .  .  .  .  .  .  .  .  .  .  .  .  .  .  .  .  .  .  .  .  .  .  .  .  .  .  .  .  .  .  .  .  .  .  .  .  .  .  .  .           9

CLIMATE CHANGE RELATED NATURAL HAZARDS .  .  .  .  .  .  .  .  .  .  .  .  .  .  .  .  . 10
   Overview .  .  .  .  .  .  .  .  .  .  .  .  .  .  .  .  .  .  .  .  .  .  .  .  .  .  .  .  .  .  .  .  .  .  .  .  .  .  .  .  .  .  . 10
   Key Trends .  .  .  .  .  .  .  .  .  .  .  .  .  .  .  .  .  .  .  .  .  .  .  .  .  .  .  .  .  .  .  .  .  .  .  .  .  .  .  .  .  . 12
   Implications for DRM .  .  .  .  .  .  .  .  .  .  .  .  .  .  .  .  .  .  .  .  .  .  .  .  .  .  .  .  .  .  .  .  .  .  .  .  .  . 12

CLIMATE CHANGE IMPACTS TO KEY SECTORS .   .   .   .   .   .   .   .   .   .   .   .   .   .   .   .   .   .   . 13
   Agriculture  .  .  .  .  .  .  .  .  .  .  .  .  .  .  .  .  .  .  .  .  .  .  .  .  .  .  .  .  .  .  .  .  .  .  .  .  .  .  .  .  .  . 14
   Water  .  .  .  .  .  .  .  .  .  .  .  .  .  .  .  .  .  .  .  .  .  .  .  .  .  .  .  .  .  .  .  .  .  .  .  .  .  .  .  .  .  .  .  . 16
   Energy  .  .  .  .  .  .  .  .  .  .  .  .  .  .  .  .  .  .  .  .  .  .  .  .  .  .  .  .  .  .  .  .  .  .  .  .  .  .  .  .  .  .  .  . 19
   Health .  .  .  .  .  .  .  .  .  .  .  .  .  .  .  .  .  .  .  .  .  .  .  .  .  .  .  .  .  .  .  .  .  .  .  .  .  .  .  .  .  .  .  . 21
   Tourism .  .  .  .  .  .  .  .  .  .  .  .  .  .  .  .  .  .  .  .  .  .  .  .  .  .  .  .  .  .  .  .  .  .  .  .  .  .  .  .  .  .  . 23

ADAPTATION .   .   .   .   .   .   .   .   .   .   .   .   .   .   .   .   .   .   .   .   .   .   .   .   .   .   .   .   .   .   .   .   .   .   . 24
   Institutional Framework for Adaptation .  .  .  .  .  .  .  .  .  .  .  .  .  .  .  .  .  .  .  .  .  .  .  .  .  .  .  .  . 24
   Policy Framework for Adaptation  .  .  .  .  .  .  .  .  .  .  .  .  .  .  .  .  .  .  .  .  .  .  .  .  .  .  .  .  .  .  .  . 25
   Recommendations .  .  .  .  .  .  .  .  .  .  .  .  .  .  .  .  .  .  .  .  .  .  .  .  .  .  .  .  .  .  .  .  .  .  .  .  .  . 26
      Research Gaps .  .  .  .  .  .  .  .  .  .  .  .  .  .  .  .  .  .  .  .  .  .  .  .  .  .  .  .  .  .  .  .  .  .  .  .  .  .  . 26
      Data and Information Gaps .  .  .  .  .  .  .  .  .  .  .  .  .  .  .  .  .  .  .  .  .  .  .  .  .  .  .  .  .  .  .  .  .  . 27
      Institutional Gaps  .  .  .  .  .  .  .  .  .  .  .  .  .  .  .  .  .  .  .  .  .  .  .  .  .  .  .  .  .  .  .  .  .  .  .  .  .  . 27

CLIMATE RISK COUNTRY PROFILE: CROATIA                                                                                                                iv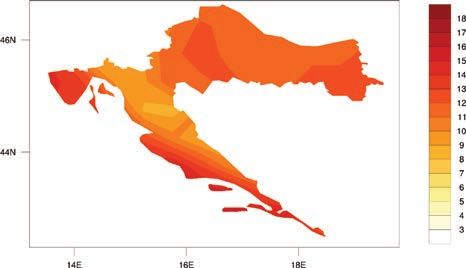
FOREWORD

Climate change is a major risk to good development outcomes, and the World Bank Group is committed to playing
an important role in helping countries integrate climate action into their core development agendas. The World
Bank Group is committed to supporting client countries to invest in and build a low-carbon, climate-resilient future,
helping them to be better prepared to adapt to current and future climate impacts.

The World Bank Group is investing in incorporating and systematically managing climate risks in development
operations through its individual corporate commitments.

A key aspect of the World Bank Group’s Action Plan on Adaptation and Resilience (2019) is to help countries
shift from addressing adaptation as an incremental cost and isolated investment to systematically incorporating
climate risks and opportunities at every phase of policy planning, investment design, implementation and evaluation
of development outcomes. For all IDA and IBRD operations, climate and disaster risk screening is one of the
mandatory corporate climate commitments. This is supported by the Bank Group’s Climate and Disaster Risk
Screening Tool which enables all Bank staff to assess short- and long-term climate and disaster risks in operations
and national or sectoral planning processes. This screening tool draws up-to-date and relevant information from
the World Bank’s Climate Change Knowledge Portal, a comprehensive online ‘one-stop shop’ for global, regional,
and country data related to climate change and development.

Recognizing the value of consistent, easy-to-use technical resources for client countries as well as to support
respective internal climate risk assessment and adaptation planning processes, the World Bank Group’s Climate
Change Group has developed this content. Standardizing and pooling expertise facilitates the World Bank Group in
conducting initial assessments of climate risks and opportunities across sectors within a country, within institutional
portfolios across regions, and acts as a global resource for development practitioners.

For developing countries, the climate risk profiles are intended to serve as public goods to facilitate upstream
country diagnostics, policy dialogue, and strategic planning by providing comprehensive overviews of trends
and projected changes in key climate parameters, sector-specific implications, relevant policies and programs,
adaptation priorities and opportunities for further actions.

It is my hope that these efforts will spur deepening of long-term risk management in developing countries and our
engagement in supporting climate change adaptation planning at operational levels.

Bernice Van Bronkhorst
Global Director
Climate Change Group (CCG)
The World Bank Group (WBG)

CLIMATE RISK COUNTRY PROFILE: CROATIA                                                                                1

COUNTRY OVERVIEW

T
       he Republic of Croatia belongs to the Adriatic-Mediterranean and Pannonia-Danube group of countries in
       Central Europe. The total area of Croatia is 87,661 kilometers square (km2), with a land area of 56,594 km2;
       territorial sea and internal sea waters account for 31,067 km2. Croatia’s seacoast extends 6,278 km (29.9%
of inland, 70.1% of islands). The state sea border is 948 km long and extends to an outer boundary of territorial
sea. The Croatian Parliament has declared an Exclusive Economic Zone (EEZ) in the Adriatic Sea on February 5,
2021. This EEZ is 23,870 km2 and reaches an epicontinental border between the Republic of Croatian and Italy.1
Croatia shares land borders with Slovenia, Hungary, Bosnia and Herzegovina, and Serbia.

The country has a population of nearly 4.1 million people (2019), with an annual growth rate of −0.5% (2019)
(Table 1). The country’s Gross Domestic Product (GDP) was $60.4 billion in 2019, experiencing annual growth of
2.9%.2 Croatia’s population is projected to reach 3.8 million and 3.3 million people in 2030 and 2050, respectively.
The urban population is expected to grow from 61.5% in 2030 to 71.3% in 2050.3 The Croatian economy is
dominated by the services sector (which includes, retail trade, transport, and government, financial, professional,
and personal services such as education, health care, and real estate services), which accounts for 59% of GDP.
Industry (including mining, manufacturing, construction, electricity, water, and gas) accounts for 26.3% of GDP and
the agricultural sector, accounts for 3% of the country’s GDP.4

TABLE 1.  Data snapshot: Key development indicators5

    Indicator
    Life Expectancy at Birth, Total (Years) (2019)                                       78.4
    Population Density (People per sq. km Land Area) (2018)                              73.0
    % of Population with Access to Electricity (2018)                                    100%
    GDP per Capita (Current US$) (2019)                                                  $14,944.40

The ND-GAIN Index6 ranks 181 countries using a score which calculates a country’s vulnerability to climate change
and other global challenges as well as their readiness to improve resilience. This Index aims to help businesses
and the public sector better identify vulnerability and readiness in order to better prioritize investment for more
efficient responses to global challenges. Due to a combination of political, geographic, and social factors, Croatia is

1
     Ministry of Environment and Nature Protection (2018). Seventh National Communication (NC6) and Third Biennial Report of The
     Republic of Croatia Under The United Nations Framework Convention On Climate Change URL: https://unfccc.int/sites/default/
     files/resource/2671905483_Croatia-NC7-BR3-2-96481035_Croatia-NC7-BR3-2-7.%20NC%20i%203.%20BR_resubmission_IX_
     2018_0.pdf
2
     World Bank Open Data (2021). Data Retrieved May 2021. Data Bank: World Development Indicators. URL: https://databank.
     worldbank.org/source/world-development-indicators
3
     World Bank Open Data (2020). Data Retrieved May 2021. Data Bank: Population Estimates and Projections. URL: https://
     databank.worldbank.org/data/reports.aspx?source=health-nutrition-and-population-statistics:-population-estimates-and-
     projections
4
     World Bank Data Bank (2021). Development Indicators: Croatia. URL: http://databank.worldbank.org/data/reports.aspx?source=
     2&country=UZB
5
     World Bank (2021). DataBank – World Development Indicators. URL: https://databank.worldbank.org/source/world-development-
     indicators
6
     University of Notre Dame (2020). Notre Dame Global Adaptation Initiative. URL: https://gain.nd.edu/our-work/country-index/

CLIMATE RISK COUNTRY PROFILE: CROATIA                                                                                              2
recognized as vulnerable to climate change impacts, ranked 51 out of 181 countries in the 2020 ND-GAIN Index.
The more vulnerable a country is the lower their score, while the more ready a country is to improve its resilience
the higher it will be. Norway has the highest score and is ranked 1st.

Croatia submitted its Seventh National Communication (NC7) and Third Biennial Report of The Republic of Croatia
Under the UNFCCC in 2018. Croatia participated in the Updated Nationally Determined Contributions (NDC)
submitted to the UNFCCC as an EU Member State in 2020.7 The country’s adaptation priorities include availability
and accessibility of water for drinking and irrigation uses, coast and coastal zones, forestry and land use change,
agriculture, biodiversity, and human health.8

Green, Inclusive and Resilient Recovery
The coronavirus disease (COVID-19) pandemic has led to unprecedented adverse social and economic impacts.
Further, the pandemic has demonstrated the compounding impacts of adding yet another shock on top of
the multiple challenges that vulnerable populations already face in day-to-day life, with the potential to create
devastating health, social, economic and environmental crises that can leave a deep, long-lasting mark. However,
as governments take urgent action and lay the foundations for their financial, economic, and social recovery, they
have a unique opportunity to create economies that are more sustainable, inclusive and resilient. Short and long-
term recovery efforts should prioritize investments that boost jobs and economic activity; have positive impacts on
human, social and natural capital; protect biodiversity and ecosystems services; boost resilience; and advance the
decarbonization of economies.

CLIMATOLOGY

Climate Baseline
Overview
The majority of Croatia experiences a moderately warm and rainy climate. Mean temperature in the lowland area
of northern Croatia is 10°C–12°C, the mountain regions experience mean temperatures of 3°C–4°C, with coastal
areas experiencing temperatures of 12–17°C. Most of the precipitation is recorded on the coastal slopes and
peaks of the Dinarides (Risnjak, 3,470 m), from Gorski Kotar in the northwest to the southern Velebit in the
southeast. Croatia is defined by three major geomorphological zones: the Pannonian basin, the mountain system

7
    EU (2020). Updated Nationally Determined Contribution of the EU and its Member States. URL: https://www4.unfccc.int/sites/
    ndcstaging/PublishedDocuments/Croatia%20First/EU_NDC_Submission_December%202020.pdf
8
    Ministry of Environment and Nature Protection (2018). Seventh National Communication (NC6) and Third Biennial Report of The
    Republic of Croatia Under The United Nations Framework Convention On Climate Change URL: https://unfccc.int/sites/default/files/
    resource/2671905483_Croatia-NC7-BR3-2-96481035_Croatia-NC7-BR3-2-7.%20NC%20i%203.%20BR_resubmission_IX_2018_0.pdf

CLIMATE RISK COUNTRY PROFILE: CROATIA                                                                                             3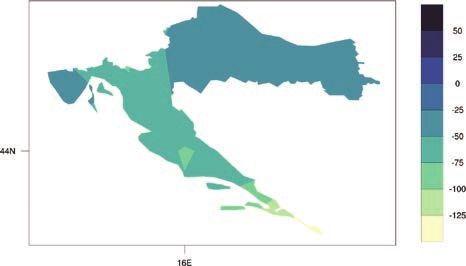
of the Dinarides, and Adriatic basin. The Lowland areas, up to 200 m, represent 53% of area of the country, hills
and sub-mountains from 200 up to 500 m represent 26%, and mountain areas above 500 m, equate to 21% of
the country. As of 2011, 23% of land area was used by for agriculture and forests covered 39% of land area.9

Croatia is a climatically complex area and has experienced a large variability in precipitation trends across the
country, over the last decades. Particularly, the mountainous region and the coastal zones are mostly affected by
drying tendencies in precipitation, especially during the summer season (May to October), while the mainland is
subjected to wetter precipitation conditions. The reduction in annual amounts of precipitation in the area north
of the Sava River results from decline in spring and autumn precipitation. In the mountains and on the Dalmatian
islands the fall season brings decline in winter and spring precipitation. On the northern Adriatic, the reduction in
precipitation amount is evident in all seasons.10 In the northeastern Mediterranean Region (or Adriatic-Ionian region,
which encompasses Croatia), heat wave events have become more frequent, longer lasting, and more severe.11
The country experiences a largely Mediterranean climate with hot, dry and sunny weather during the summer and
relatively mild, yet rainy weather during the winter in the coastal area. In the mainland, a typical continental climate
can be experienced with four distinguished seasons; warm summers and cold winters and more precipitation in
spring and late autumn/early winter. However, due to climate change, usual climate patterns are changing towards
more unpredictable seasons.

Analysis of data from the World Bank Group’s Climate Change Knowledge Portal (CCKP) (Table 2) shows
historical information for 1901–2020. Mean annual mean temperature for Croatia is 10.5°C, with average monthly
temperatures ranging between 21°C (July, August) and 0°C (December and January). Mean annual precipitation
is 1,082.7 mm. Precipitation levels increase from October to December. The largest rainfall occurs in November
(117mm)12; shown in Croatia’s latest climatology, 1991–2020, in Figure 1. Figure 2 presents the spatial variation
of observed average annual precipitation and temperature for 1991–2020.

TABLE 2.  Data snapshot: Summary statistics

     Climate Variables                                                                      1901–2020
     Mean Annual Temperature (°C)                                                           +10.6°C
     Mean Annual Precipitation (mm)                                                         +1,082.7 mm
     Mean Maximum Annual Temperature (°C)                                                   15.4°C
     Mean Minimum Annual Temperature (°C)                                                   5.7°C

9
      Ministry of Environment and Nature Protection (2018). Seventh National Communication (NC7) and Third Biennial Report of The
      Republic of Croatia Under The United Nations Framework Convention On Climate Change URL: https://unfccc.int/sites/default/files/
      resource/2671905483_Croatia-NC7-BR3-2-96481035_Croatia-NC7-BR3-2-7.%20NC%20i%203.%20BR_resubmission_IX_2018_0.pdf
10
      Ministry of Environmental Protection, Physical Planning and Construction (2010). Strategy for Sustainable Development of the
      Republic of Croatia. URL: http://extwprlegs1.fao.org/docs/pdf/cro105236.pdf
11
      Climate Adapt (2021). Adriatic-Ionian Area. URL: https://climate-adapt.eea.europa.eu/countries-regions/transnational-regions/
      adriatic-ionian
12
      WBG Climate Change Knowledge Portal (CCKP, 2021). Croatia. URL: https://climateknowledgeportal.worldbank.org/country/
      croatia/climate-data-historical

CLIMATE RISK COUNTRY PROFILE: CROATIA                                                                                               4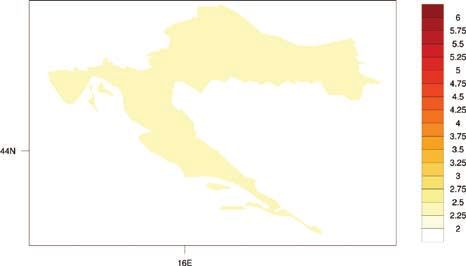
FIGURE 1.  Average monthly temperature and rainfall for Croatia, 1991–202013
                     24                                                                               160

                     18                                                                               120
Temperature (°C)

                                                                                                            Rainfall (mm)
                     12                                                                               80

                      6                                                                               40

                      0                                                                               0
                          Jan   Feb   Mar    Apr   May    Jun    Jul   Aug   Sep    Oct   Nov   Dec

                                                   Rainfall       Temperature

 FIGURE 2.  Map of average annual temperature (°C) (left); annual precipitation (mm) (right) of
 Croatia, 1991–202014

 13
                   WBG Climate Change Knowledge Portal (CCKP, 2021). Croatia. URL: https://climateknowledgeportal.worldbank.org/country/croatia/
                   climate-data-historical
 14
                   WBG Climate Change Knowledge Portal (CCKP, 2021). Croatia. URL: https://climateknowledgeportal.worldbank.org/country/croatia

 CLIMATE RISK COUNTRY PROFILE: CROATIA                                                                                                        5
Key Trends
Temperature
In Croatia, January is the coldest month, with the temperature in the Pannonian region range from 0°C to −2°C.
Along the Adriatic coast, winters are milder; January temperatures are 4°C–6°C. In the north and east of Croatia
average July temperatures are 20°C–22°C and on the Adriatic coast 23°C–26°C. Since the 1960s, Croatia has
experienced a general warming trend throughout the country (Figure 3), with higher temperatures experienced
in the mainland as opposed to areas along the coast. Observed warming has been experienced in terms of both
warmer daytime temperatures and warmer nights. Maximum temperatures have been observed to experience the
most significant change at an increase of 0.3°C to 0.4°C per decade.15
FIGURE 3. Observed temperature for Croatia, 1901–202016
13
12
Temperature (°C)
11
10
9
8
1901 1910 1920 1930 1940 1950 1960 1970 1980 1990 2000 2010 2020
Annual Mean 5 Year Smoothing
Precipitation
Croatia’s central Adriatic and eastern regions of Slavonia and Baranja experience the least amount of rainfall, with
coastal zones experiencing the highest amounts of annual average rainfall. Typically, rainfall in Croatia decreases
from the west towards the east. Since the 1960s, trends have shown that rainfall is increasing in the eastern
lowlands but decreasing across the rest of the country, however future projections are inconclusive, and this might
15
Ministry of Environment and Nature Protection (2018). Seventh National Communication (NC6) and Third Biennial Report of The
Republic of Croatia Under The United Nations Framework Convention On Climate Change URL: https://unfccc.int/sites/default/files/
resource/2671905483_Croatia-NC7-BR3-2-96481035_Croatia-NC7-BR3-2-7.%20NC%20i%203.%20BR_resubmission_IX_2018_0.pdf
16
WB Climate Change Knowledge Portal (CCKP, 2021). Croatia URL: https://climateknowledgeportal.worldbank.org/country/croatia/
climate-data-historical
CLIMATE RISK COUNTRY PROFILE: CROATIA 6not be the steady trend.17 The country also experiences prominent dry spells, typically during the autumn months.
Summer precipitation trends have decreased most significantly.18
Climate Future
Overview
The main data source for the World Bank Group’s Climate Change Knowledge Portal (CCKP) is the CMIP5
(Coupled Inter-comparison Project No.5) data ensemble, which builds the database for the global climate change
projections presented in the Fifth Assessment Report (AR5) of the Intergovernmental Panel on Climate Change
(IPCC). Four Representative Concentration Pathways (i.e. RCP2.6, RCP4.5, RCP6.0, and RCP8.5) were selected
and defined by their total radiative forcing (cumulative measure of GHG emissions from all sources) pathway
and level by 2100. The RCP2.6 for example represents a very strong mitigation scenario, whereas the RCP8.5
assumes business-as-usual scenario. For more information, please refer to the RCP Database. For simplification,
these scenarios are referred to as a low (RCP2.6); a medium (RCP4.5) and a high (RCP8.5) emission scenario
in this profile. Table 3 provides CMIP5 projections for essential climate variables under high emission scenario
(RCP8.5) over 4 different time horizons. Figure 4 presents the multi-model (CMIP5) ensemble of 32 Global
Circulation Models (GCMs) showing the projected changes in annual precipitation and temperature for the periods
2040–2059 and 2080–2099.
TABLE 3. Data snapshot: CMIP5 ensemble projection
CMIP5 Ensemble Projection 2020–2039 2040–2059 2060–2079 2080–2099
Annual Temperature +.33 to +2.36 +.958 to +3.48 +1.71 to +4.94 +2.66 to +6.4
Anomaly (°C) (+1.36) (+2.29) (+3.47) (+4.56)
Annual Precipitation -17.39 to + 13.07 -19.08 to +15.55 -22.87 to +14.83 -26.98 to +13.94
Anomaly (mm) (−1.21) (−1.63) (−2.48) (−6.05)
Note: The table shows CMIP5 ensemble projection under RCP8.5. Bold value is the range (10th–90th Percentile) and values in parentheses
show the median (or 50th Percentile).
17
Kalinski, V. (2017). Results of Climate Modeling at the System HPC Velebit for the development of the NAS and NAP. URL: http://
prilagodba-klimi.hr/wp-content/uploads/2017/11/Klimatsko-modeliranje.pdf
18
Ministry of Environment and Nature Protection (2018). Seventh National Communication (NC6) and Third Biennial Report of The
Republic of Croatia Under The United Nations Framework Convention On Climate Change URL: https://unfccc.int/sites/default/files/
resource/2671905483_Croatia-NC7-BR3-2-96481035_Croatia-NC7-BR3-2-7.%20NC%20i%203.%20BR_resubmission_IX_2018_0.pdf
CLIMATE RISK COUNTRY PROFILE: CROATIA 7FIGURE 4. CMIP5 ensemble projected change (32 GCMs) in annual temperature (top) and
precipitation (bottom) by 2040–2059 (left) and by 2080–2099 (right), relative to 1986–2005
baseline under RCP8.519
19
WBG Climate Change Knowledge Portal (CCKP, 2021). Croatia Climate Data - Projections. URL: https://climateknowledgeportal.
worldbank.org/country/croatia/climate-data-projections
CLIMATE RISK COUNTRY PROFILE: CROATIA 8Key Trends
Temperature
Croatia is expected to become hotter and drier, especially in the summer. Climate change trends are projected to
increase temperatures and decrease water availability across Croatia over this century.20 Trends in temperature
show warming throughout Croatia, with higher temperatures in the mainland than the coast or the Dalmatian
areas. Maximum temperatures are expected to see the greatest degree of change, per decade. As demonstrated
in Table 3, CCKP data analysis for high emission scenarios, show monthly mean temperature changes increasing
by 1.36°C by the 2030s to more than 4°C by the 2090s. Temperature trends will see significant increase in
summer months (May to September) as well as winter and spring seasons. Minimum temperatures are projected
to experience the largest increase through mid-century. Specific ‘new hot spots’ are in the northern and western
areas of Croatia, the northern regions in Gorski Kotar and the eastern part of Lika during its winter months. The
coastal areas will experience the biggest change during summer seasons.21
Across all emission scenarios, temperatures will continue to increase for Croatia throughout the end of the century.
As seen in Figure 5, under a high-emission scenario, average temperatures will increase rapidly by mid-century.
Across the seasonal cycle (Figure 5), temperature increases will spike will be felt from April to June and again in
September and October. Increased heat and extreme heat conditions will result in significant implications for public,
the agricultural sector and water resources.
FIGURE 5. Projected average temperature for FIGURE 6. Projected change in Summer Days
Croatia (Reference Period, 1986–2005)22 (Tmax >25°C)23
18 20
17 18
16 16
14
15
12
degC
14
days
10
13
8
12
6
11
4
10 2
1980 2000 2020 2040 2060 2080 2100
Year 0
Historical RCP 2.6 RCP 4.5 RCP 6.0 RCP 8.5 Jan Feb Mar Apr May Jun Jul Aug Sep Oct Nov Dec
20
EU (2017). Draft Climate change Adaptation Strategy in the Republic of Croatia for the period to 2040 with a view to 2070 (White
book). Croatia. URL: http://prilagodba-klimi.hr/wp-content/uploads/docs/Draft%20CC%20Adaptation%20Strategy.pdf
21
Ministry of Environment and Nature Protection (2018). Seventh National Communication (NC6) and Third Biennial Report of The
Republic of Croatia Under The United Nations Framework Convention On Climate Change URL: https://unfccc.int/sites/default/files/
resource/2671905483_Croatia-NC7-BR3-2-96481035_Croatia-NC7-BR3-2-7.%20NC%20i%203.%20BR_resubmission_IX_2018_0.pdf
22
WBG Climate Change Knowledge Portal (CCKP, 2021). Interactive Climate Indicator Dashboard - Agriculture. Croatia. URL https://
climatedata.worldbank.org/CRMePortal/web/agriculture/crops-and-land-management?country=HRV&period=2080-2099
23
WBG Climate Change Knowledge Portal (CCKP, 2021). Interactive Climate Indicator Dashboard - Agriculture. Croatia. URL https://
climatedata.worldbank.org/CRMePortal/web/agriculture/crops-and-land-management?country=HRV&period=2080-2099
CLIMATE RISK COUNTRY PROFILE: CROATIA 9Precipitation
Future precipitation trends for the country are projected to decline steadily over the century, (eastern areas may
experience increased rainfall), however these negative trends are primarily recognized in the summer months in the
mountain regions as well as in the Adriatic areas. Annual decreases in precipitation are also expected in Istria and
Gorski Kotar, due to reduced spring rainfall. An increased number of consecutive dry days are expected to be seen over
the spring season for the northern Adriatic, with summer
seasons seeing an extended number of dry days reach
FIGURE 7. Projected annual average
the southern coast of Croatia. Through the mid-century,
precipitation in Croatia (Reference Period,
the largest decrease (just over 10 %) will be in the spring
1986–2005)26
in the southern areas of Dalmatia and in the summer
1100
(10–15%) in the mountainous areas and in northern
1000
Dalmatia. The largest increase in total precipitation, 5–10
900
%, is expected on the islands in autumn and in northern
800
Croatia in winter.24 Figure 7 shows the change in the
mm
700
projected annual average precipitation for Croatia.25 At
600
a nationally aggregated scale, mean annual precipitation
500
for the country is expected to remain largely similar;
400
however, at regional scales, western and specifically 1980 2000 2020 2040 2060 2080 2100
Year
southern areas are expected to experience the most Historical RCP 2.6 RCP 4.5 RCP 6.0 RCP 8.5
significant reduction in precipitation.
CLIMATE CHANGE RELATED NATURAL HAZARDS
Overview
Croatia, and neighboring southeast European sub-region, are at risk to natural disasters, which primarily affect
the region’s agricultural, water and energy sectors, through seasonal flooding, aridity, and periods of drought.
Temperatures are already observed to be increasing, precipitation is decreasing across key agricultural zones, and
an increase in the intensity and frequency of extreme weather events — especially droughts and heat waves have
been observed.27 This also indicates scenarios for the increasing risk of wildfires. Croatia is at risk to earthquakes
(Dinaric Arc, northwestern Croatia), flooding (Pannonia), landslides (northwestern Croatia), water scarcity (coastal
area and islands) as well as extreme heat (throughout the country). This is expected to impact agriculture and water
sectors as well as wider population health. Vulnerable groups, such as those with fewer economic opportunities
24
Ministry of Environment and Nature Protection (2018). Seventh National Communication (NC6) and Third Biennial Report of The
Republic of Croatia Under The United Nations Framework Convention On Climate Change URL: https://unfccc.int/sites/default/files/
resource/2671905483_Croatia-NC7-BR3-2-96481035_Croatia-NC7-BR3-2-7.%20NC%20i%203.%20BR_resubmission_IX_2018_0.pdf
25
WBG Climate Change Knowledge Portal (CCKP, 2021). Croatia Water Dashboard. Data Description. URL: https://climateknowledgeportal.
worldbank.org/country/croatia/climate-sector-water
26
WBG Climate Change Knowledge Portal (CCKP, 2021). Climate Data-Projections. Croatia. URL: https://climateknowledgeportal.
worldbank.org/country/croatia/climate-sector-water
27
EU (2017). Draft Climate change Adaptation Strategy in the Republic of Croatia for the period to 2040 with a view to 2070
(White book). Croatia. URL: http://prilagodba-klimi.hr/wp-content/uploads/docs/Draft%20CC%20Adaptation%20Strategy.pdf
CLIMATE RISK COUNTRY PROFILE: CROATIA 10and the young and elderly are particularly at risk to natural hazards and the increasing impacts of climate change.
Croatia has already endured various natural hazards, including droughts, floods, extreme temperatures, storms and
wildfires. Croatia is also highly prone to earthquakes, and after relative quietness in the past 20 years,28 Croatia was
hit by two strong earthquakes: M5.5 on 22 March, 2020 (wider Zagreb capital area)29 and M6.4 on 29 December,
2020 (Sisak-Moslavina County area, ca 40 km south of Zagreb)30 killing several people, causing extensive damage
to numerous homes and infrastructure as well as causing loss of livelihoods.31
Nearly a quarter of the Croatian economy is based on sectors potentially vulnerable to climate change and
extreme weather, including agriculture and tourism. This accounts for €9.23 billion a year. Between 2000 and
2007, extreme weather including droughts and floods caused average annual losses in the agricultural sector of
€173 million. The energy sector has also been affected by extreme weather: the 2003 drought cost the government
€63–69 million in compensation for power outages caused by reduced river flow and hydropower production.
Natural hazards resulting in these types of issues are likely to become more common over the coming century.32,33
Data from the Emergency Event Database: EM-Dat, presented in Table 4, shows the country has endured various
natural hazards.
TABLE 4. Natural disasters in Croatia, 1900–202034
Natural Hazard Events Total Total Damage
1900–2020 Subtype Count Deaths Total Affected (′000 USD)
Drought Drought 1 0 0 330,000
Earthquake Ground Movement 3 8 indirectly over ∼ $19.2 billion USD
1.5 million (2020 earthquakes)
Cold Wave 3 7 0 0
Heat Wave 2 828 200 240,000
Extreme Temperatures
Severe Winter 1 5 0 0
Conditions
Flash Flood 2 0 3,200 0
Flood
Riverine Flood 7 3 10,576 80,000
Storm Convective Storm 2 2 3,500 161,000
Wildfire Forest Fire 6 13 106 37,750
28
Hadzima-Nyarko, M. and Sipos, T. (2017). Insights from existing earthquake loss assessment research in Croatia. Earthquakes and
structures. 13(4). pp. 401–411. URL: http://www.techno-press.org/content/?page=article&journal=eas&volume=13&num=4&ordernum=3
29
World Bank Group (2020). Overlooked: Examining the impact of disasters and climate shocks on poverty in the Europe and
Central Asia Region. Washington, DC: World Bank. URL: http://documents1.worldbank.org/curated/en/493181607687673440/pdf/
Overlooked-Examining-the-Impact-of-Disasters-and-Climate-Shocks-on-Poverty-in-the-Europe-and-Central-Asia-Region.pdf
30
Croatian Geological Society (2021). Petrinja Area Earthquake Report: URL: https://www.hgi-cgs.hr/press-release-of-the-croatian-
geological-survey-hgi-cgs/
31
Uhlir, Z., Ivos, S., Orsanic, D., Bogaerts, V. R., Stanton-Geddes, Z., Katic, K. (2020). Croatia Earthquake – Rapid Damage and Needs
Assessment 2020. Washington, D.C.; World Bank Group. URL: http://documents1.worldbank.org/curated/en/311901608097332728/pdf/
Croatia-Earthquake-Rapid-Damage-and-Needs-Assessment-2020.pdf
32
EU (2017). Report on the Estimated Climate Change Impacts and Vulnerability of Individual Sectors. URL: https://climate-adapt.
eea.europa.eu/countries-regions/countries/croatia
33
EU (2012). Climate Vulnerability Assessment: Croatia. URL: http://www.seeclimateforum.org/upload/document/cva_croatia_-_english_
final_print2.pdf
34
EM-DAT: The Emergency Events Database – Universite catholique de Louvain (UCL) – CRED, D. Guha-Sapir, Brussels, Belgium.
URL: http://emdat.be/emdat_db/. Updated by the 2020 earthquakes data from various sources.
CLIMATE RISK COUNTRY PROFILE: CROATIA 11Key Trends
While many sectors in Croatia do have risk assessments,35 Croatia has yet to establish a functional data flow
mechanism in order to have comprehensive understanding of natural hazards in all sectors. Additionally, Croatia
does not have a central database which would systematically collect and analyze disaster loss data. The country
depends upon tourism and an increase in natural disasters in the coastal area are expected to cause significant
economic losses for the sector. Croatia’s population density and urban development greatly varies throughout the
country, and the urban coastal areas have experienced greater impacts from disasters.36
Flooding, including coastal and riverine, are particular
hazards for Croatia and damaging and potentially FIGURE 8. Croatia landslide risk38
life-threatening river floods are expected to occur at
least once in the next 10 years. Flooding along river
areas is considered an immediate as well as long-
term hazard for both rural and urban areas. Surface
flood hazards in urban and rural areas are also
expected to occur. Croatia is at risk to sea level rise
and resulting coastal area flooding, which will impact
coastal cities.37 Figure 8 demonstrates Croatia’s
current risk of landslides, which can be seen to be
particularly pronounced in the center of the country,
in the northwest area and along the coast.
Implications for DRM
To increase its resilience to natural hazards and climate change impacts, Croatia has plans, procedures and resources
to deal with a major disaster. However, it is still lacking in good coordination and disaster risk management,
especially in human capacity. At an operational level, the Croatian Red Cross (CRC) has contingency plans and
procedures which are in permanent upgrading process. Support to the most vulnerable population remains the
CRC’s priority and mandate. Croatian Waters has developed a well-organized flood defense structure at the national
level and activities are implemented in accordance with EU flood risk management directives. Croatia’s flood risk
management is coordinated through the national and local level as well as on the trans-boundary level, supported
by flood forecast modelling and early warning responses. Croatia have also implemented strong landslide risk
management mechanisms, which are measured and undertaken by the Ministry of Construction and Physical
Planning. These institutions oversee landslide risk assessments as well as programs for landslide disaster recovery.39
35
Croatian Government (N.D). Disaster risk assessment for the Republic of Croatia/Procjena rizika od katastrofa za Republiku Hrvatsku.
URL: https://civilna-zastita.gov.hr/UserDocsImages/DOKUMENTI_PREBACIVANJE/PLANSKI%20DOKUMENTI%20I%20UREDBE/
Procjena%20rizika%20od%20katastrofa%20za%20RH.pdf
36
GFDRR (2018). Croatia – Landslide Risk URL: https://www.gfdrr.org/sites/default/files/Croatia.pdf
37
ThinkHazard! (2020). Croatia. URL: http://thinkhazard.org/en/report/62-croatia
38
Global Risk Data Platform (2019). Croatia. URL: http://preview.grid.unep.ch/index.php?preview=map&lang=eng
39
Arbanas, S. et al. (2019). Landslide risk management in Croatia: Current state. Proceedings of the 4th Symposium on Landslides in
the Adriatic-Balkan Region, Sarajevo, 2019. DOI: doi.org/10.35123/ReSyLAB_2019_40
CLIMATE RISK COUNTRY PROFILE: CROATIA 12Overall, Croatia is working to improve its resilience to increased risk of natural hazards and reduce vulnerability of
local communities and institutions to better prepare for and mitigate and respond to natural hazards and climate
change. It has incorporated disaster risk reduction strategies in all sector strategies. Additional cross-sector
coordination and collaboration as well as the development of early warning systems can improve the country’s
preparedness and resilience.40 Wider adoption and implementation of the planning tools such as the European
Flood Awareness System (EFAS) can also help to improve planning towards major risks, such as floods.41 Following
its recent earthquakes, Croatia is working to assess its DRM processes, specifically in response to earthquakes
and increase its ability to prepare for disasters as well as mitigate future impacts. This includes the allocation of
resources and for establishing the necessary legal framework covering all aspects of material and social recovery.
The implementation of measures to strengthen existing buildings and to mitigate earthquake risks is a key factor
in improving the resilience of the community in the future.42
CLIMATE CHANGE IMPACTS TO KEY SECTORS
C
roatia is expected to experience a range of adverse impacts of climate change throughout the country
and across all sectors, the most significant impacts being more frequent and intense droughts, changing
precipitation patterns, prevalence of new disease vectors, increases in air and sea surface temperature, and
increasing number of consecutive dry and hot days. Visible signs of climate change include annual variation in crop
yields, sea level rise, a longer tourism season and the potential development of new tourism destinations due to
changes in local climates.43 Variable precipitation and increasing temperatures are resulting in an increasingly riskier
agricultural and water availability environment. Furthermore, climate change and global temperature increases are
impacting sea level rise, which will also have an impact in the country. Climate change is expected to impact major
economic sectors of the country such as tourism and agriculture. Financial constraints and limited institutional
capacity have limited adaptation capabilities and effective response to climatic hazards in the country. This further
threatens future sustainable agricultural production as well as the opportunity to expand and sustain tourism.
Gender
An increasing body of research has shown that climate-related disasters have impacted human populations in many
areas including agricultural production, food security, water management and public health. The level of impacts
and coping strategies of populations depends heavily on their socio-economic status, socio-cultural norms, access
to resources, poverty as well as gender. Research has also provided more evidence that the effects are not gender
neutral, as women and children are among the highest risk groups. Key factors that account for the differences
40
Holcinger, (2015). National progress report on the implementation of the Hyogo Framework for Action (2013–2015)-Croatia.
URL: https://www.preventionweb.net/files/40137_HRV_NationalHFAprogress_2013-15.pdf
41
Dottori, F., et al. (2017). An operational procedure for rapid flood risk assessment in Europe. Nat. Hazards Earth Syst. Sci., 17,
pp. 1111–1126.
42
Government of Croatia. (2020). Croatia Earthquake – Rapid Damage and Needs Assessment 2020. World Bank Group. URL: http://
documents1.worldbank.org/curated/en/311901608097332728/pdf/Croatia-Earthquake-Rapid-Damage-and-Needs-Assessment-
2020.pdf
43
EU (2017). Report on the Estimated Climate Change Impacts and Vulnerability of Individual Sectors. URL: https://climate-adapt.
eea.europa.eu/countries-regions/countries/croatia
CLIMATE RISK COUNTRY PROFILE: CROATIA 13between women’s and men’s vulnerability to climate change risks include: gender-based differences in time use;
access to assets and credit, treatment by formal institutions, which can constrain women’s opportunities, limited
access to policy discussions and decision making, and a lack of sex-disaggregated data for policy change.44
Agriculture
Overview
Agriculture in Croatia is divided into crop production, livestock production, and fishing. Crop production includes
arable land and gardens, kitchen gardens, orchards, olive groves, vineyards, meadows and pastures, nurseries and
land with osier willows. Utilized agricultural areas comprised 23.4% of the country’s total land area. Agricultural
cultivation includes cereals (maize, wheat and barley), dried pulses, root and tuber crops, industrial plants (soy-bean,
sugar beet, sunflower, rape seed), vegetables, green fodder from arable land as well as other arable crops, flowers
and ornamental plants, seed crops and seedlings and fallow land.45 Croatia’s fishing sector is divided into maritime
and freshwater fishing. Maritime fishing occurs in the Croatian sea and freshwater fishing in ponds and open
freshwater. The majority of catch is blue fish but also includes other fish, crustaceans and oysters, other mollusks
and shellfish. Mari-culture includes fish farms for white fish (mostly sea bass and sea bream), blue fish (tuna) and
shellfish (mussels, oysters).46
Climate Change Impacts
The agricultural sector is particularly vulnerable to climate change, due to its weather dependence.47,48 Extreme
weather events such as droughts and hail have resulted in average losses of €76 million per year from
2000–2007; 0.6% of national GDP.49 Changing climate conditions for the country may impact the annual
number of days of active vegetation (with temperature above 5°C) increases in the lowland parts the country.
This may result in cultivation of individual plants being moved depending on culture needs for heat, light and water
and will result in changing the crop rotation in farming areas, suitable areas for orchards, vineyards and olive
groves are likely to move, areas currently unsuitable for agriculture may become attractive. Increased temperatures
coupled with capability to provide adequate water (irrigation) could bring a positive effect on the increase in yields,
especially winter crops which will be cultivated under mild winter conditions. Adverse impacts i.e. drought risk,
44
World Bank Group (2016). Gender Equality, Poverty Reduction, and Inclusive Growth. URL: http://documents1.worldbank.org/
curated/en/820851467992505410/pdf/102114-REVISED-PUBLIC-WBG-Gender-Strategy.pdf
45
Igor, B., Josip, T. and Paulo, P. (2020). Agriculture Management Impacts on soil Properties and Hydrological Response in Istris.
Agronomy. 10(2). DOI: https://doi.org/10.3390/agronomy10020282
46
Ministry of Environment and Nature Protection (2018). Seventh National Communication (NC6) and Third Biennial Report of The
Republic of Croatia Under The United Nations Framework Convention On Climate Change URL: https://unfccc.int/sites/default/files/
resource/2671905483_Croatia-NC7-BR3-2-96481035_Croatia-NC7-BR3-2-7.%20NC%20i%203.%20BR_resubmission_IX_2018_0.pdf
47
EU (2017). Report on the Estimated Climate Change Impacts and Vulnerability of Individual Sectors. URL: https://climate-adapt.
eea.europa.eu/countries-regions/countries/croatia
48
EU (2012). Climate Vulnerability Assessment: Croatia. URL: http://www.seeclimateforum.org/upload/document/cva_croatia_-_english_
final_print2.pdf
49
EU (2017). Draft Climate change Adaptation Strategy in the Republic of Croatia for the period to 2040 with a view to 2070
(White book). Croatia. URL: http://prilagodba-klimi.hr/wp-content/uploads/docs/Draft%20CC%20Adaptation%20Strategy.pdf
CLIMATE RISK COUNTRY PROFILE: CROATIA 14hail, flood, frost, etc., may impact production of key staple crops, such as winter wheat and maize.50 Warmer sea
temperatures are likely to impact the fishing industry, potentially through an increased number of invasive species
and changing locations of shoals, which will in turn affect the economy of coastal provinces and islands. Diminished
surface runoff may also affect groundwater levels, affecting drinking water supplies as well as water availability for
irrigation needs.
The projected increased heat will increase stress on
crops and is also likely to alter the length of the growing FIGURE 9. Projected average daily max
seasons. Decreased water availability is likely to further temperature for Croatia52
reduce yields and the reduction in soil moisture may 16
alter suitable areas for agriculture or the production 14
of specific crops. Increased heat and water scarcity 12
conditions are likely to increase evapotranspiration, 10
degreesC
expected to contribute to crop failure and overall 8
yield reductions.51 Figure 9 shows the average daily 6
maximum-temperature across seasonal cycles. These 4
higher temperatures, occurring throughout the year, 2
have implications for soil moisture and crop growth; 0
Jan Feb Mar Apr May Jun Jul Aug Sep Oct Nov Dec
summer spikes in temperature will have impacts for
harvest seasons as well as the country’s tourism
industry and energy production and distribution.
Adaptation Options
Expanded irrigation is one measure which can prevent or minimize the effects of climate change, in particular for
areas experiencing decreased precipitation. The reduction in crop cultures without irrigation, in average climate
conditions, can vary from 10% to 60 %, while in extreme dry conditions, it can be up to 90% depending on culture,
soil and area. Increasing the irrigated area of arable land in Croatia is likely to be necessary to maintain crop yields.
In the long term, investment in further research is required to develop detailed, economically sound adaptation
measures in this area, including the development of the agricultural education sector. Potential measures include
promoting crop rotation and encouraging farmers to use new crop varieties, including drought resistant and faster-
growing varieties.53,54 Capacity building programs are also necessary to develop educational programs for farmers,
50
Ministry of Environment and Nature Protection (2014). Seventh National Communication (NC6) and Third Biennial Report of The
Republic of Croatia Under the United Nations Framework Convention On Climate Change URL: https://unfccc.int/sites/default/files/
resource/2671905483_Croatia-NC7-BR3-2-96481035_Croatia-NC7-BR3-2-7.%20NC%20i%203.%20BR_resubmission_IX_2018_0.pdf
51
Ministry of Environment and Nature Protection (2018). Seventh National Communication (NC6) and Third Biennial Report of The
Republic of Croatia Under the United Nations Framework Convention On Climate Change URL: https://unfccc.int/sites/default/files/
resource/2671905483_Croatia-NC7-BR3-2-96481035_Croatia-NC7-BR3-2-7.%20NC%20i%203.%20BR_resubmission_IX_2018_0.pdf
52
WBG Climate Change Knowledge Portal (CCKP, 2020). Croatia Agriculture. Dashboard URL: https://climatedata.worldbank.org/
CRMePortal/web/agriculture/crops-and-land-management?country=HRV&period=2080-2099
53
EU (2017). Report on the Estimated Climate Change Impacts and Vulnerability of Individual Sectors. URL: https://climate-adapt.
eea.europa.eu/countries-regions/countries/croatia
54
EU (2012). Climate Vulnerability Assessment: Croatia. URL: http://www.seeclimateforum.org/upload/document/cva_croatia_-_english_
final_print2.pdf
CLIMATE RISK COUNTRY PROFILE: CROATIA 15advising services, administrative staff, scientists, teachers and community stakeholders. Scientific agricultural
research is necessary to:
• initiate (finance) improvement projects focused on the development of populations and varieties adapted to
soil types and climate conditions in Croatia’s agricultural regions that will meet new requirements in the future,
• initiate permanent research into existing agricultural crops (maize, wheat, potato, apple, wine grape) in the areas
of Croatia or abroad (through international cooperation) containing already elements of the model predicted,
• investigate new systems of tillage, sowing (planting), sowing density, cultivation.55
Water
Overview
Croatia is characterized by significant wetland areas, especially in typically flooded areas of Drava, Danube, Sava
and Neretva catchments. While the country has a positive average water balance, the interannual distribution
of water quantities is not favorable due to the significant spatial and time difference across the country’s water
resource distribution. Croatia has a wide allocation of surface (rivers, lakes, transitional and coastal waters) and
ground waters, which are part of either Black Sea or Adriatic catchment area with watersheds running along the
mountain and alpine area. Large watercourses such as Sava, Drava and Danube with many smaller sub-catchments
dominate the Black Sea catchment area. In the Adriatic catchment area, the abundance and the length of surface
watercourses are significantly lower, but there are significant groundwater flows through karst systems. The River
of Danube, the largest and richest in water, flows through the eastern borderland of the Republic of Croatia. The
largest rivers in Istria are Mirna, Dragonja and Raša, and in Dalmatia these are Zrmanja, Krka, Cetina, and Neretva.
The Mediterranean, including the Croatian Adriatic coastline, is affected by global sea-level rises caused by thermal
expansion of the oceans and melting of the polar ice caps. Particularly at-risk from sea level rise are Croatia’s low
islands such as Krapanj (only 1.5 m above sea level) and river deltas (i.e. the Neretva river delta) which includes
large areas of agricultural land) which are vulnerable to coastal flooding as well as salinization.56,57
Climate Change Impacts
Climate change will impact Croatia’s water supply, impacting demand from the agricultural sector as well as
increasing drinking requirements. Annual distribution (and changing patterns) of rainfall is of great interest to the
water industry as the distribution of water throughout the year is critical for planning of resources as well as for
safety against disasters. Infrastructure and water management strategies are closely tuned to the annual cycle of
supply and demand. In Croatia, projected temperature and precipitation trends are likely to result in hydrological
55
Ministry of Environment and Nature Protection (2018). Seventh National Communication (NC6) and Third Biennial Report of The
Republic of Croatia Under The United Nations Framework Convention On Climate Change URL: https://unfccc.int/sites/default/files/
resource/2671905483_Croatia-NC7-BR3-2-96481035_Croatia-NC7-BR3-2-7.%20NC%20i%203.%20BR_resubmission_IX_2018_0.pdf
56
EU (2017). Report on the Estimated Climate Change Impacts and Vulnerability of Individual Sectors. URL: https://climate-adapt.
eea.europa.eu/countries-regions/countries/croatia
57
EU (2012). Climate Vulnerability Assessment: Croatia. URL: http://www.seeclimateforum.org/upload/document/cva_croatia_-_english_
final_print2.pdf
CLIMATE RISK COUNTRY PROFILE: CROATIA 16impacts of the country’s watercourses, such as catchments, rivers and coastlines. Increasing temperatures will
also play an adverse role in evapotranspiration, changes in groundwater inflow, water level in rivers and lakes, and
water temperatures. Changes in precipitation will influence not only the discharge, but the intensity, time period
and frequency of floods and droughts as well as soil humidity, ground water recharge and the amount of water
flowing through rivers.58 Some estimates expect discharges in the largest watercourses to decrease by 10% to
20%, although in eastern parts of the country such change could be less than 10%.59 Additional natural resources
such as wetlands services (flood protection, water filtration, etc.) could also be at risk in a drier future.
Rainfall and evaporation changes also impact rates of surface water infiltration and the recharge rates for
groundwater. Low-water storage capacity increases the country’s dependence on unreliable rainfall patterns.
Changes in rainfall and evaporation for Croatia are expected to translate directly to changes in surface water
infiltration and groundwater re-charge. This has the potential for further decreased reliability of unimproved
groundwater sources and surface water sources during droughts or prolonged dry seasons. Increased strain on
pumping mechanisms leading to breakdowns if maintenance is neglected and the potential for falling water levels
in the immediate vicinity of well or borehole, particularly in areas of high demand.60 Additionally, temperature
increases have the potential to result in increased soil moisture deficits even under conditions of increasing rainfall.
Figure 10 shows the projected annual Standardized
Precipitation Evapotranspiration Index (SPEI) through the FIGURE 10. Projected annual SPEI Drought
end of the century. The SPEI is an index which represents Index in Croatia for the period, 2080–2099
the measure of the given water deficit in a specific (Reference Period, 1986–2005)61
location, accounting for contributions of temperature- 1.0
dependent evapotranspiration and providing insight 0.5
0
into increasing or decreasing pressure on water
–0.5
resources. Negative values for SPEI represent dry
unitless
–1.0
conditions, with values below −2 indicating severe –1.5
drought conditions, likewise positive values indicate –2.0
increased wet conditions. This is an important –2.5
understanding for the water sector in regard to –3.0
–3.5
quantity and quality of supply for human consumption Historical RCP 2.6 RCP 4.5 RCP 6.0 RCP 8.5
and agriculture use as well as for the energy sector
as reductions in water availability impacts river flow and
the hydropower generating capabilities. At a nationally aggregated scale, Croatia is projected to experience heightened
dry conditions and drought severity, which will likely increase pressure on water resources for the country and region
by mid-century and by end of the century.
58
EU (2017). Draft Climate change Adaptation Strategy in the Republic of Croatia for the period to 2040 with a view to 2070
(White book). Croatia. URL: http://prilagodba-klimi.hr/wp-content/uploads/docs/Draft%20CC%20Adaptation%20Strategy.pdf
59
EU (2017). Report on the Estimated Climate Change Impacts and Vulnerability of Individual Sectors. URL: https://climate-adapt.
eea.europa.eu/countries-regions/countries/croatia
60
Oresic, D. and Canjevac, I. (2019). Groundwater resources in Croatia. Water Resources Management in Balkan Countries. URL: https://
link.springer.com/chapter/10.1007/978-3-030-22468-4_5
61
WBG Climate Change Knowledge Portal (CCKP, 2020). Croatia Water Sector Dashboard. URL: https://climatedata.worldbank.org/
CRMePortal/web/water/land-use-/-watershed-management?country=HGV&period=2080-2099
CLIMATE RISK COUNTRY PROFILE: CROATIA 17You can also read