School of Archaeological
& Forensic Sciences
Bronze and Silver Award
←
→
Page content transcription
If your browser does not render page correctly, please read the page content below
School of Archaeological & Forensic Sciences Bronze and Silver Award
ATHENA SWAN BRONZE DEPARTMENT AWARDS
Recognise that in addition to institution-wide policies, the department is working
to promote gender equality and to identify and address challenges particular to the
department and discipline.

ATHENA SWAN SILVER DEPARTMENT AWARDS
In addition to the future planning required for Bronze department recognition,
Silver department awards recognise that the department has taken action in
response to previously identified challenges and can demonstrate the impact
of the actions implemented.
Note: Not all institutions use the term ‘department’. There are many equivalent
academic groupings with different names, sizes and compositions. The definition
of a ‘department’ can be found in the Athena SWAN awards handbook.

COMPLETING THE FORM
DO NOT ATTEMPT TO COMPLETE THIS APPLICATION FORM WITHOUT
READING THE ATHENA SWAN AWARDS HANDBOOK.
This form should be used for applications for Bronze and Silver department awards.
You should complete each section of the application applicable to the award level
you are applying for.

      Additional areas for Silver applications are highlighted
      throughout the form: 5.2, 5.4, 5.5(iv)

If you need to insert a landscape page in your application, please copy and paste the
template page at the end of the document, as per the instructions on that page. Please
do not insert any section breaks as to do so will disrupt the page numbers.

WORD COUNT
The overall word limit for applications are shown in the following table.
There are no specific word limits for the individual sections and you may distribute
words over each of the sections as appropriate. At the end of every section, please
state how many words you have used in that section.
We have provided the following recommendations as a guide.

                                                                                         2
Department application                         Bronze    Current

Word limit                                      10,500    10,401
 Recommended word count
 1.Letter of endorsement                          500       460
 2.Description of the department                  500       233
 3. Self-assessment process                      1,000      680
 4. Picture of the department                    2,000      2140
 5. Supporting and advancing women’s careers     6,000      6683
 6. Case studies                                  n/a       n/a
 7. Further information                           500       205

                                                                   3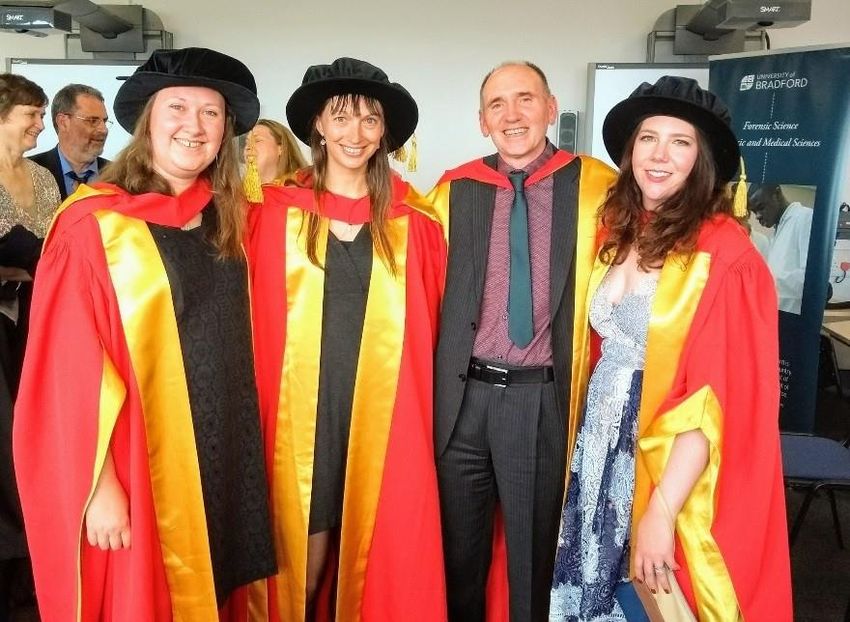
Name of institution               University of Bradford

Department                        School of Archaeological and
                                  Forensic Sciences (SAFS)
Focus of department               STEMM
Date of application               November 2019

Award Level                       Bronze
Institution Athena SWAN           Date: November 2015               Level: Bronze
award
Contact for application           Dr Karina Croucher
Must be based in the department

Email                             k.croucher@bradford.ac.uk

Telephone                         01274235335

Departmental website              https://www.bradford.ac.uk/ar
                                  chaeological-forensic-sciences/

                                                                                    4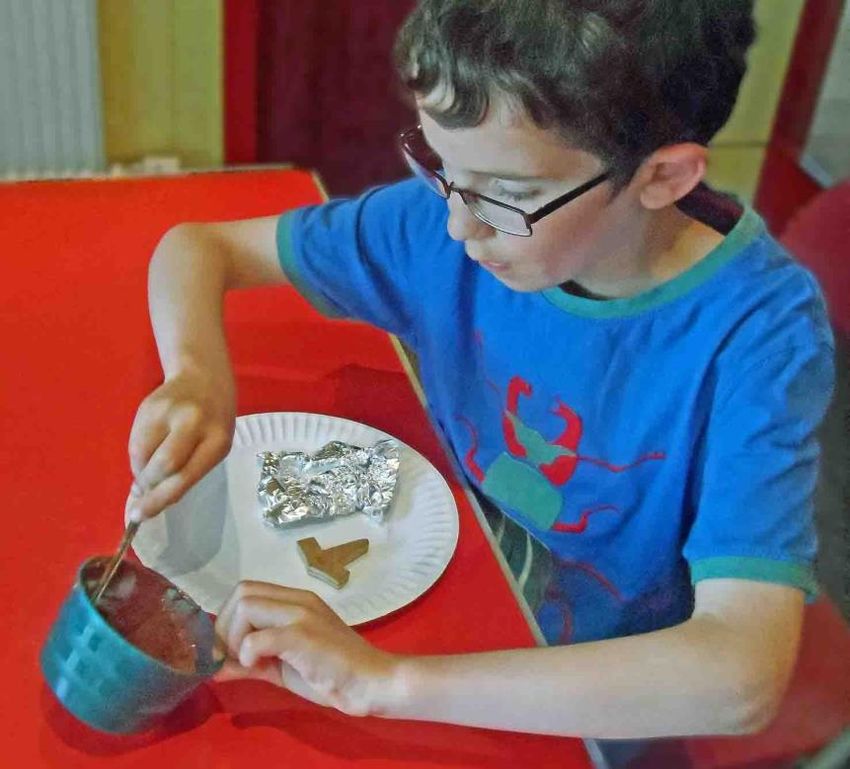
Contents
Athena SWAN Silver DEPARTMENT awards ............................................................................................ 2
Completing the form ............................................................................................................................... 2
Word count ............................................................................................................................................. 2
  List of figures ....................................................................................................................................... 5
  List of Tables ........................................................................................................................................ 8
  1.     Letter of endorsement from the head of department............................................................... 9

        Recommended word count: Bronze: 500 words | Silver: 500 words ............................................. 9
   2.        Description of the department ................................................................................................ 12

        Recommended word count: Bronze: 500 words | Silver: 500 words ........................................... 12
   3.        The self-assessment process ................................................................................................... 14

        Recommended word count: Bronze: 1000 words | Silver: 1000 words ...................................... 14
   4.        A picture of the department .................................................................................................... 18

        Recommended word count: Bronze: 2000 words | Silver: 2000 words ...................................... 18
   4.1. Student data ............................................................................................................................ 18
   4.2. Academic and research staff data ........................................................................................... 33
   5.   Supporting and advancing women’s careers ........................................................................... 40

        Recommended word count: Bronze: 6000 words | Silver: 6500 words ...................................... 40
   5.1.     Key career transition points: academic staff ........................................................................... 40
   5.2.     Key career transition points: professional and support staff................................................... 46
   5.3.     Career development: academic staff ....................................................................................... 46
   5.4.     Career development: professional and support staff .............................................................. 53
   5.5.     Flexible working and managing career breaks ......................................................................... 53
   5.6.     Organisation and culture ......................................................................................................... 65
   6.       CASE STUDIES: IMPACT ON INDIVIDUALS ................................................................................ 81
   7.       Further information ................................................................................................................. 81

        Recommended word count: Bronze: 500 words | Silver: 500 words .......................................... 81
   8.        Action plan............................................................................................................................... 83

LIST OF FIGURES

Figure 2.1: Faculty of Life Sciences (FLS) structure ............................................................................... 12

Figure 2.2: Key roles in the School of Archaeological and Forensic Sciences, with gender (M/F) of lead
staff member and deputy (D) where appropriate. Where there is no indicator, the role is split
between subsections ............................................................................................................................. 13

Figure 4.1: Combined headcounts of all undergraduate students within the School of Archaeological
and Forensic Sciences ............................................................................................................................ 19

Figure 4.2: Headcount of students for Archaeology programmes........................................................ 19

Figure 4.3: Headcount of students on Forensic programmes............................................................... 20

Figure 4.4: Aggregated undergraduate degree attainment by gender 2014/15–2017/18 ................... 25

Figure 4.5: Percentage of gender cohort attainment of 1st class or 2(1) Degree by year ..................... 26

Figure 4.6: Number of students on all SAFS PGT courses, plus percentage female and National

                                                                                                                                                              5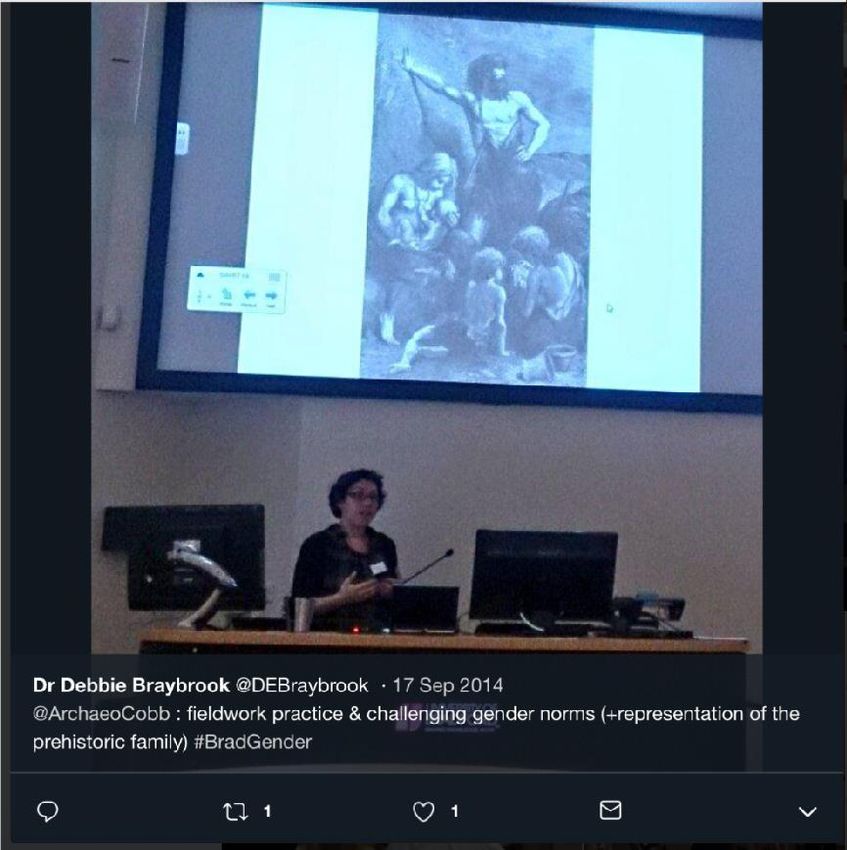
comparison ............................................................................................................................................ 27
Figure 4.7: PGT Percentage of Enrolments to Applicants by gender 2014/5 to 2017/8 ...................... 28
Figure 4.8: PGR headcount of students (National figures from HEIDI+ data) ....................................... 30
Figure 4.9: Figures comparing UG, PGT and PGR levels for percentage female students...................... 32
Figure 4.10: Graduation 2017 highlighting female successes at PGR ................................................... 33
Figure 4.11: Numbers of staff of all grades within SAFS, and percentage female, all available data.... 34
Figure 4.12: Percentage of female staff, average of years 2014/15 – 2017/18, from HESA data......... 35
Figure 4.13: Gender balance of archaeologists (Profiling the Profession data) .................................... 35
Figure 4.14: Percent of female staff by grade by year (numbers on chart show raw counts) .............. 36
Figure 4.15: Pipeline of Individual staff tracked through entry through to maximum grade reached .. 36
Figure 4.16: National breakdown of by grade and gender: representation of women by grade (UAUK
data), data only available for 2015/16................................................................................................... 37
Figure 4.34: Ratio of academic staff on permanent contracts by gender .............................................. 38
Fig 5.1: Percentage of SAFS interview panels with at least 25% female representation vs interview
panels without 25% female representation .......................................................................................... 40
Fig 5.2: Staff survey question feedback regarding usefulness of induction process ............................. 43
Fig 5.4: Staff survey question feedback of activities taken part in the past year ................................... 47
Fig 5.5: Staff survey question feedback regarding career progression discussion during PDR ............. 47
Fig 5.6: Staff survey question feedback regarding areas of disadvantage to women in the School ..... 48
Figure 5.7: Staff survey question feedback regarding aspects that would be beneficial to individuals’
career progression ................................................................................................................................. 50
Figure 5.8: Students going on placement, BA Archaeology, BSc Archaeology, BSc Archaeological
Sciences and BSc Forensic Archaeology and Anthropology. Few forensic Science and Forensic and
Medical Sciences students took advantage of the placement scheme prior to the degrees moving to
SAFS ....................................................................................................................................................... 51
Figure 5.9: Staff survey question feedback regarding effect of career break on progression (both
academic and support staff). Percentages refer to gender division within academic and professional
staff numbers ........................................................................................................................................ 54
Figure 5.10: Staff survey question feedback regarding the effect a career break has had on an
individual’s progression (both academic and support staff).................................................................. 54
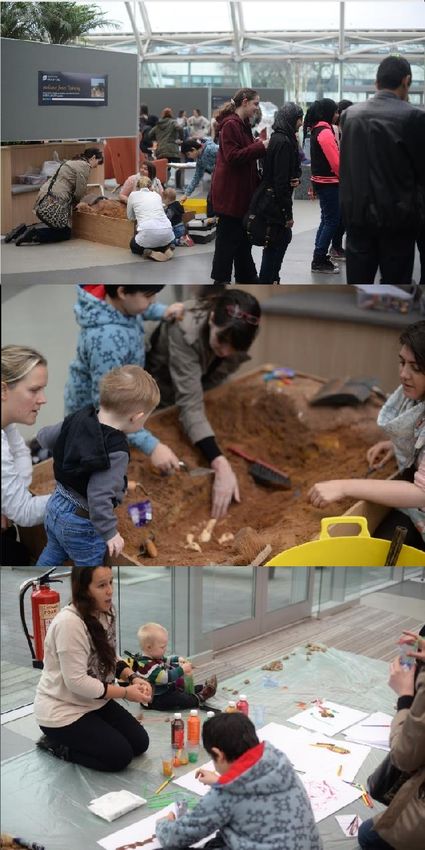
Figure 5.11a, b, c: Bradford Science Festival welcomes young visitors (and children of SAFS staff) ..... 57
Figure 5.12: Children at conferences, Member of SAFS staff and child at Theoretical Archaeology
Group, UoB, 2015 .................................................................................................................................. 58
Figure 5.13: At the University (SAFS staff children at the Festival of Science) ...................................... 58
Fig 5.14: Staff survey question feedback on awareness of parental leave policy ................................. 59
6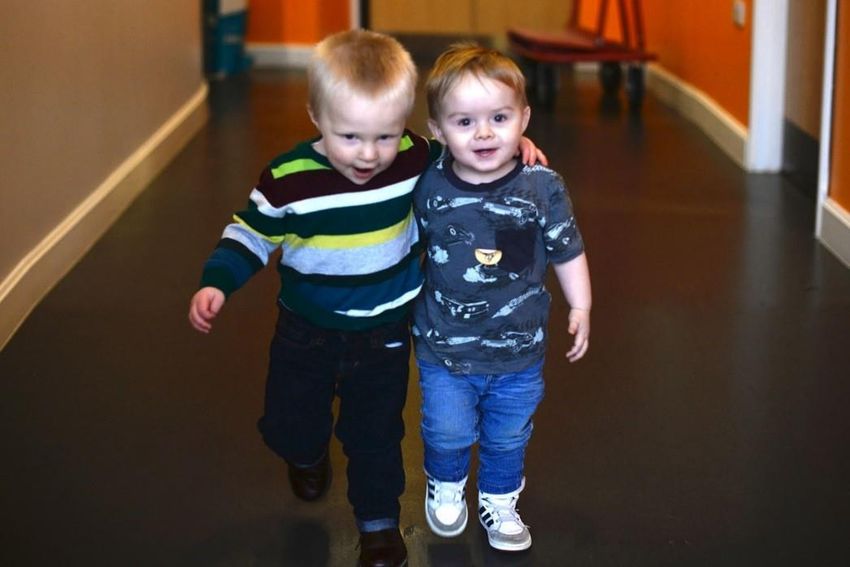
Figure 5.15: Staff survey question feedback regarding satisfaction with policies on maternity,
paternity and parental leave ................................................................................................................. 60

Figure 5.18: Staff survey question feedback on perception of flexible working and its effect on
progression time scale (both academic and support staff).................................................................... 63

Figure 5.19: Staff survey question feedback on part-time work and progression (both academic and
support staff) ......................................................................................................................................... 63

Figure 5.20: Staff survey question feedback on whether working part-time has a negative effect on
one’s career ........................................................................................................................................... 64

Figure 5.21 Challenging stereotypes at the ‘Is gender still relevant?’ event, external speaker, 2014
(above) and twitter screenshot of logo (below) .................................................................................... 65

Figure 5.22a: Theoretical Archaeology Group rainbow logo, theme of ‘Diversity’, Bradford 2015 ...... 67

Figure 5.22b: Screenshot from Twitter, Chair of Plenary (with baby) and keynote Prof Timothy Taylor
presenting as Krysztina Tautendorfer .................................................................................................... 67

Most staff feel that success and achievements are celebrated. Many of our staff have received
leadership awards, including for teaching and conference organisation, broadly split between genders
(Figs. 5.23; 5.24). ................................................................................................................................... 67

Figure 5.23: Staff survey question feedback on whether individuals believe that successes and
achievements are celebrated in the School........................................................................................... 68

Figure 5.24: Celebrating success: Members of staff and students, VCs Award (for organising TAG
conference) ........................................................................................................................................... 68

Figure 5.25: Screenshot of the SAFS TeamAPP ..................................................................................... 69

Figure 5.26: Staff survey question feedback on whether individuals are encouragement to sit on
Faculty committees ............................................................................................................................... 72

Figure 5.27: Staff survey question feedback on whether individuals are encouragement to sit on
external committees ............................................................................................................................. 72

Figure 5.28: Staff survey question feedback regarding workload allocation within the School ........... 73

Figure 5.29: Staff survey question feedback on whether individuals feel they are allocated
disproportionate responsibilities as part of workload ........................................................................... 74

Figure 5.30 ‘This Prof Can’ display in the Atrium (the main University building, central gathering
space), University of Bradford, showcasing female professors ............................................................. 76

Figure 5.31: Gender split of invited speakers for guest lecture series 2008-09 to 2017-18 (by academic
year) ...................................................................................................................................................... 77

Fig 5.32: Numbers of Female and Male staff helping at AEDs (Applicant Experience Days) per staff
members ............................................................................................................................................... 79

Fig 5.33: Numbers of Female to Male staff helping at AEDs (Applicant Experience Days) per occasion
............................................................................................................................................................... 79

Figure 5.34: Prof Vince Gaffney, outreach trip ..................................................................................... 80
Figure 5.35: Casting Thor’s hammer in chocolate ................................................................................. 80

                                                                                                                                                                     7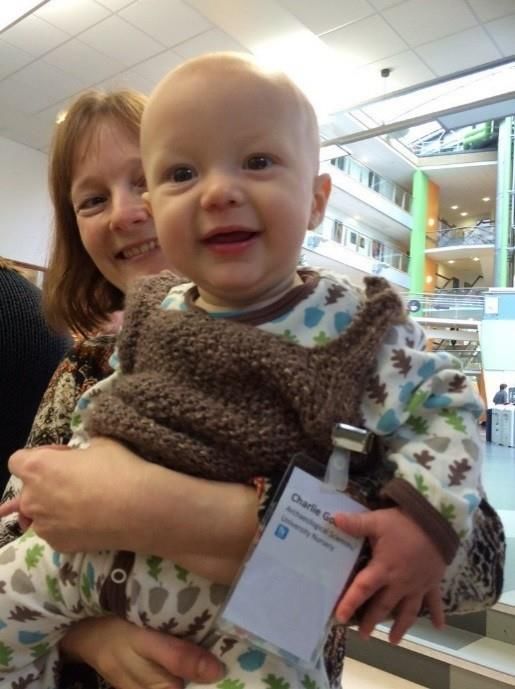
LIST OF TABLES
S3cur3data

Table 1: Abbreviations ............................................................................................................................. 9

Table 2.1: Programmes currently taught by the School of Archaeological and Forensic Sciences ....... 12

Table 2.2: Members of the School by Position (Headcounts), 2017/18............................................... 13

Table 3.1: Membership of Self-Assessment Team (* denotes not current SAT member). ................... 14

Table 4.1: Data on ethnicity (where known) of Undergraduate new entrants to degree areas,
expressed as aggregated Headcounts / Percentage of degree area (2015/16 – 2017/18 only available)
............................................................................................................................................................... 20

Table 4.2: Total number (Headcount) of Full-Time and Part-Time Students (FTEs) on Undergraduate
Courses, by gender ................................................................................................................................ 21

Table 4.3: Archaeology student applications, offers and enrolment .................................................... 22

Table 4.4: Forensic student applications, offers and enrolment .......................................................... 23

Table 4.5: Student attainment by gender for each year separately 2014/15-2017/18 ........................ 24

Table 4.6: Total number of Full-Time and Part-Time Students (FTEs) on PGT Courses........................ 27

Table 4.7: PGT student applications, offers and enrolments ................................................................ 28

Table 4.8a: Completions of PGT students (HESA returns) .................................................................... 29

Table 4.8b: PGR student applications, offers and enrolments ............................................................. 30

Table 4.8c: Chart of PGR student applications, offers and enrolments ................................................ 30

Table 4.9: Completion rates of PGR students (HESA return) ............................................................... 31

Table 4.10: Headcount totals of Full-Time and Part-Time PGR Students.............................................. 32

Table 4.11: Summary of career paths and grades: all academic staff undertaking teaching and
research ................................................................................................................................................. 34

Table 4.11: Gender balance of academic and research staff by grade .................................................. 36

Table 5.1: Female and male applicant data tabulated by academic year of job posting ....................... 41

Table 5.2: Male and female applicant data tabulated by grade of job listing........................................ 41

Table 5.3: Submission to Research Assessment .................................................................................... 45

Table 5.4: Gender split of grant applications for each amount threshold ............................................. 52

Table 5.5: The number of Faculty and University committees on which F/M SAFS staff currently sit
(2018-19; note individual staff often sit on more than one committee) ............................................... 71

                                                                                                                                                                     8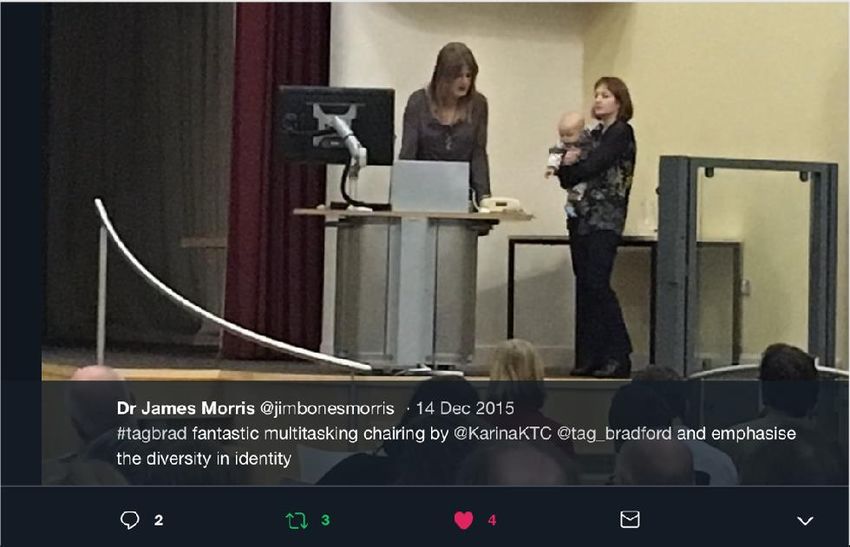
Table 5.5: Gender and career stage of invited speakers for guest lecture series 2008-09 to 2017-18 (by
academic year) ...................................................................................................................................... 77

Table 5.6: Gender split of applicant numbers 2015 – 2018 ................................................................... 80

Table 5.7: Gender split of those attending AED’s 2015-2018 ................................................................ 80

  Table 1:
  Abbreviations.
                                  Ba Archaeology, BSc Archaeology & BSc
  Arch                            Archaeological Sciences
  ADRKT                           Associate Dean for Research & Knowledge Transfer
  AS                              Athena SWAN
  EDC                             Central Equality and Diversity Committee
  F                               Female
  FACSI                           Forensic Archaeology and Crime Scene Investigation
  FLS E&D                         Faculty Life Sciences Equality and Diversity Director
  FLS                             Faculty of Life Sciences
  FMS                             Forensic and Medical Science
  FS                              Forensic Science
  HOP                             Human Osteology and Palaeopathology
  HoS                             Head of School
  HR                              Human Resources
  HRBP                            Human Resources Business Partners
  M                               Male
  MSci                            Undergraduate masters (as opposed to MSc)
  PDR                             Personal Development Review
  PDRA                            Post Doctoral Research Assistant
  PGCHEP                          Postgraduate Certificate in Higher Education Practice
  PGR                             Postgraduate Research (PhD/MPhil)
  PGT                             Postgraduate Taught (Masters)
  PTHP                            Part time hourly paid
  SAFS                            School of Archaeological and Forensic Sciences
  SAT                             Self-assessment Team
  SEDC                            School Equality and Diversity Committee
  UG                              Undergraduate
  UoB                             University of Bradford
  WLM                             Work Load Model

1. LETTER OF ENDORSEMENT FROM THE HEAD OF DEPARTMENT
Recommended word count: Bronze: 500 words | Silver: 500 words
An accompanying letter of endorsement from the head of department should be
included. If the head of department is soon to be succeeded, or has recently taken
up the post, applicants should include an additional short statement from the
incoming head.
Note: Please insert the endorsement letter immediately after this cover page

                                                                                                                                                           9
Equality Charters Manager
Equality Challenge Unit
7th Floor, Queens House
55/56 Lincoln’s Inn Fields
London WC2A 3LJ

Dear Colleague

As the Head of the School of Archaeological and Forensic Sciences (SAFS) (formerly the
School of Archaeological Sciences), I am delighted to support our submission to the
Athena SWAN committee. The information presented in the application (including
qualitative and quantitative data) is an honest and accurate reflection of the School, and
our engagement with the University’s commitment to equality and diversity.

The School thrives on developing excellence in interdisciplinary research and teaching.
Under my tenure, the School’s management structure (Executive and other committees)
has developed towards greater equality, diversity and inclusivity (EDI), and I have
demonstrated my own commitment to this aim by inviting and recruiting diverse
representation in leadership and membership positions, as well as ensuring that EDI
concepts have a strong role in our senior leadership team. I have participated and
supported the School’s Athena SWAN application throughout the process—something I
will continue through ensuring adequate provision of resources and support to the group
moving forward.

Our staff-base did not change significantly as we transitioned from Archaeological
Sciences to Archaeological & Forensic Sciences. Consequently, while we used
archaeological benchmark data, we accept that this might change in future Athena SWAN
applications. During my term as HoS we have improved our EDI standing through
recruiting a high proportion of early-career female lecturers. However, representation
across gender and minority ethnic groups in senior roles requires further action.

We aim to deliver on our Action Plan in a timely manner. We recognise clearer processes
are required for change at all levels and we are committed to developing better
communication through the School’s representation on the Centre for Inclusivity &
Diversity working group. The continuous improvement of policies and procedures will also
increase our understanding on imbalances in ethnicity and disability.

The Athena SWAN self-reflection process has highlighted both our strengths and the
challenges we face, enabling us to identify the following priority areas for improvement:

•       Early Career staff progression;

•       Addressing the ‘leaky pipeline’ at Grade 10+;

The honest reflections of our staff and students, regardless of gender, ethnicity, dis/ability
and other protected characteristics will enable us to target our priority areas and be
successful in the implementation of our action plan. In addition, we have two priority
activities: to develop a School Handbook valuable for all staff, regardless of their

                                                                                                 10
demographic or career-stage; and to implement a sustainable, individual-oriented
Mentoring scheme. We will further reinforce our commitment by teaching gender/identity-
related content throughout SAFS.
In this context, I offer my enthusiastic support, and am fully confident that the staff in the
school are committed to progressing the agenda set by our Athena SWAN submission.
Yours faithfully
Dr Chris Gaffney, Head of School
Word count: 460
112. DESCRIPTION OF THE DEPARTMENT
Recommended word count: Bronze: 500 words | Silver: 500 words
Please provide a brief description of the department including any relevant
contextual information. Present data on the total number of academic staff,
professional and support staff and students by gender.
The School of Archaeological and Forensic Sciences (SAFS), one of four schools within
the Faculty of Life Sciences (FLS), Figure 2.1, is based on dedicated floors within the
Richmond Building, with a common room accessible to all staff and postgraduates.
Figure 2.1: Faculty of Life Sciences (FLS) structure
UoB was the first university in Britain to offer dedicated archaeological science degrees
over 40 years ago. The School was formed by merging Archaeology and Forensic
delivery following, Academic Portfolio Review (2016/17), Table 2.1.
Table 2.1: Programmes currently taught by the School of Archaeological and Forensic
Sciences
Undergraduate Programmes Postgraduate Programmes
BSc Archaeology (Arch) MSc Archaeological Science (AS)
BSc Forensic Archaeology and MSc Human Osteology and
Anthropology (FAA) Palaeopathology (HOP)
BSc Forensic and Medical Science (FMS) MSc Forensic Archaeology and Crime
Scene Investigation (FACSI)
BSc Forensic Science (FS)
All academic staff engage in research and teaching at Undergraduate and Postgraduate
levels and are supported by two Technical and Professional Staff (line-managed outside
SAFS (Table 2.2).
12Table 2.2: Members of the School by Position (Headcounts), 2017/18
Position in the School Female Male % Female
Academic Staff (Teaching & Research) 6 7 46
Research-only (post-doctoral researchers) 2 6 25
Professional and Support Staff 1 1 50
Postgraduate Research 13 5 72
Postgraduate Taught 34 10 77
Undergraduate 107 44 71
Staff meet monthly to discuss all aspects of SAFS work, chaired by the Head of School
(HoS), including updates from staff leads (Figure 2.2). Meetings provide advice and
governance for specialist sub-committees as well as the School overall. Equality,
Diversity and Inclusion (EDI) is now a standing item on agendas at these meetings, and
most areas have Self-Assessment Team (SAT) member representation.
Since 2014, all senior roles (except Admissions and HoS) and some programme leaders
have rotated. Selection for these is based upon ability, experience, workload balance
and commitment; normally reviewed during annual Personal Development Reviews
(PDRs) with the HoS (their line manager). The HoS is appointed after institutional
application and interview. Technical and administrative staff are line-managed outside
SAFS. Research group and support staff are line-managed separately by their group
leaders.
Figure 2.2: Key roles in the School of Archaeological and Forensic Sciences, with gender
(M/F) of lead staff member and deputy (D) where appropriate. Where there is no indicator,
the role is split between subsections
Head of School
[M]
Teaching Exams
Research Student Officer & Equality & Health &
Admissions & Safety
Director Liaison Board Chair Diversity
Learning
[F D: F] [M]
[M] [M D: M]
Director Post
Place- Staff /
of Programme Graduate Athena Disability
Student
Studies Leaders Taught Co- Swan SAT Officer
ments Liaison
ordinator 13
[F D: [4 M 3 F] [M D: F] [F]
[F] [F D: F]
M] [M D: F]Word count: 233
3. THE SELF-ASSESSMENT PROCESS
Recommended word count: Bronze: 1000 words | Silver: 1000 words
Describe the self-assessment process. This should include:
i. A description of the self-assessment team
The Self-Assessment Team (SAT) was established in 2017 to support the Athena SWAN
process, but has a wider EDI remit. Membership has changed over time, but represents
academic staff (Full-time, Part-time, and Fixed Term), Professional Support,
Postdoctoral researchers and a Postgraduate Student representative. Six of the team
are men and four are women; currently a male chair, enabling the former chair (female)
to take up a role as Faculty lead for EDI. Initially, volunteers were requested, then
staff/students targeted to fill gaps. Table 3.1 lists all current and former SAT members.
Members have varying family circumstances, including those with young families and
caring responsibilities. Two recently took maternity/paternity leave, and two returned
to work after long periods of sick leave. One member has a hearing impairment, and
another has mobility issues.
Table 3.1: Membership of Self-Assessment Team (* denotes not current SAT member).
Job SAT role Notes
P/T Athena Swan Joined SAT in 2019. Started post in
Co-ordinator Updated data; general summer 2019
documentation review
for re-submission
Reader Compiled student Director of
data and reviewed Studies; member
student data section; of Senate;
student consultation; Programme
general document leader;
review Promoted 2017
Post-doctoral Compiled guest On SAT until July
Researcher lecture and other 2018 (End of
data; original contract and
document review new position
taken
elsewhere)
PGR student Worked on
presentation of data;
led PGR consultation
14Senior Lecturer Original Chair, Former School
compiled original Athena SWAN
submission; document co-ordinator,
review, especially plus Faculty and
section on the SAT University EDI
roles. Promoted
2018
Lecturer Compiled data; Recently
document review, appointed staff
especially career
transition points; PGR
consultation; joined
SAT in autumn 2018
Post-doctoral Organised follow-up
Researcher staff questionnaire;
document review,
particularly staff data
section
P/T Researcher Compiled and On SAT until July
uploaded initial staff 2018 (End of
and PGR surveys contract)
Senior Lecturer Compiled data and Head of School
action points;
reviewed
documentation
especially HoS letter
and career
development section
Professor General review of SAFS Research
documentation Director;
Member of
Senate
P/T Professional Focussed on data and SAFS Subject
services, Librarian presentation; Librarian;
reviewed flexible National
working section Teaching Fellow
Reader Compiled placements Head of UG
and guest lecture data programmes;
retired summer
2017
Senior Lecturer Joined SAT summer Examinations
2019; Chair; reviewed Officer; SAFS
School description and
15organisation; E&D lead from
compiled summer 2019
resubmission
documentation
Post-doctoral Document review; co- Started post in
Researcher ordinated Action late 2018
Plans; joined SAT in
2019
P/T Athena Swan Joined SAT in 2019. Started post in
Co-ordinator Updated data; general summer 2019
documentation review
for re-submission
Reader Compiled student Director of
data and reviewed Studies; member
student data section; of Senate;
student consultation; Programme
general document leader;
review
Promoted 2017
Post-doctoral Compiled guest On SAT until July
Researcher lecture and other 2018 (End of
data; original contract and
document review new position
taken
elsewhere)
ii. An account of the self-assessment process
The SAT normally meets twice per semester, with meetings held weekly during summer
2019 in the lead up to AS re-application. Different members compiled different sections
originally, and reviewed different sections for re-submission, with oversight and
drafting from the Chair. For resubmission Ms Kath Bridger was employed P/T to assist
with data and document review.
Our data-team utilised staff and PGR surveys and focus group discussions.
• We received 22 (65% of staff) responses to an online survey in 2017 including
academic staff, postdoctoral researchers and 4 professional services/support
staff). Responses included twelve women, eight men; two preferred not to
state their gender. None selected the ‘other’ gender category. As it is difficult to
represent two individuals selecting ‘prefer not to say’ in quantitative data, we
excluded the category (for almost every answer they gave opposing answers)
but included qualitative responses from these individuals.
16• Our PGR response rate was good (11 responses/61%), and a focus group
discussion and follow-on meetings were held to bolster this feedback. Currently
there is no formal mechanism of engaging with UG/PGT students on EDI [AP1].
• In summer 2019, a follow-up questionnaire survey of staff assessed changes
within SAFS since the start of the AS process. Fourteen responses were received
(44% of current staff; five men, seven women, two preferred not to say). Lower
response was due to poor timing of survey [AP2b] and supplemented by
discussions in monthly staff meetings.
Documentation presented here were circulated to all staff for comment and discussed
at staff meetings. Actions are communicated to PGR, PGT and UG students through
emails and SSLC meetings. The Chair of the School SAT sits on the Faculty team, also led
by a member of the School SAT (the former Chair). The School and Faculty Chairs report
to the wider institutional SAT. The process aimed to be inclusive, transparent and
representative. The level of engagement with students has been less than desired, with
no formal mechanism for capturing student perceptions on EDI matters [AP1].
The original paperwork was reviewed by a subpanel of PGR students (3F, 2M), leading
members of the University’s EDI Team, and two external reviewers, Prof Judith Rankin
(Newcastle University) and Dr Jennifer Bardsley (Kings College London); both
experienced panellists and SAT members. We liaised with colleagues in Pharmacy and
Medical Sciences, Chemistry and Biosciences to learn from their experiences, recent
submissions and to share good practice. For resubmission we sought further external
review from Mr Sean McWhinnie (Educational Consultant), an experienced AS panellist,
and the University’s EDI team.
For this resubmission, HR data on students and staff have been updated to September
2018.
iii. plans for the future of the self-assessment team
The SAT will become the School Equality and Diversity Committee (SEDC) [AP2] and
meet twice-semesterly to monitor implementation of AS and related issues as they
arise [AP6]. Meeting dates will be added to the annual meeting calendar with minuting,
action tracking and reporting as for other School committees. Membership will be
reviewed annually (or as needed for staff changes) to ensure representation and
workload management for panel members. Membership will be included within staff
workload model and reviewed in PDRs. Terms of reference, recruitment criteria, and
lengths of terms will be discussed with and approved by the initial panel, as well as
recruiting UG and PGT (post-graduate taught, i.e. Masters-level) representation. Staff
and PGR surveys will continue annually as indicators for progress.
Word Count: 680 words
174. A PICTURE OF THE DEPARTMENT
Recommended word count: Bronze: 2000 words | Silver: 2000 words
4.1. Student data
If courses in the categories below do not exist, please enter n/a.
(i) Numbers of men and women on access or foundation courses
N/A
(ii) Numbers of undergraduate students by gender
Full- and part-time by programme. Provide data on course applications, offers, and
acceptance rates, and degree attainment by gender.
Students: Current enrolments
SAFS has undergone significant change becoming Archaeological and Forensic Sciences
in 2017. FMS and FS degrees joined the school in September 2016 and September 2017.
Data is presented for the whole School, and separately for Archaeological (BA
Archaeology and BSc Archaeological Sciences, both being taught out, BSc Arch, and BSc
FAA – “Archaeology”) and Forensic (BSc FMS and BSc FS – “Forensic”) programmes.
Numbers on individual courses are too small for meaningful separate conclusions.
Likewise, there are few overseas students (Figure 4.1: Combined headcounts of all undergraduate students within the School of
Archaeological and Forensic Sciences
200 80.0
70.9
180 67.1
63.3 62.9 70.0
160
60.0
Student Headcount
Percentage Female
140 62.3 64.0
60.5
120 50.0
100 40.0
80 30.0
60 112 112 102 107 20.0
40
65 66
20 50 44 10.0
0 0.0
2014/5 2015/6 2016/7 2017/8
Academic Year
Female Male Percentage Female national data (% female)
The UG student body is predominately female and has risen between 2016/17 and
2017/18. The number of men reduced from about 65 to 44, increasing the proportion of
students who are female (71% female in 2017/18, Figure 4.1). The proportion of female
students is in line with the national average for Forensics and Archaeological Science
(from HEIDI+ data).
Figure 4.2: Headcount of students for Archaeology programmes
120 100
Percentage Female Students
90
100
80
Student Headcount
62.2 60.9 70
80 56.9 56.4
60
60 50
40
40
30
62 57
47 44 51 20
20 42
31 27 10
0 0
2014/5 2015/6 2016/7 2017/8
Academic Year
Female Male Percentage Female
Although numbers on archaeology courses have fallen from 109 to 69, the female
percentage increased slightly between 2014/15 – 2017/18 (Figure 4.2).
19Figure 4.3: Headcount of students on Forensic programmes
100 100.0
90 79.3 90.0
77.4
80 72.4 72.9 80.0
Student Headcount
Percentage Female
70 70.0
60 60.0
50 50.0
40 40.0
30 65 30.0
55 51
48
20 20.0
10 21 19 17 10.0
14
0 0.0
2014/5 2015/6 2016/7 2017/8
Academic Year
Female Male Percentage Female
Although numbers on our core forensic courses have varied between 62 and 82, this
change has largely been due to fluctuations in the number of female students (Figure
4.3).
Overall, our Archaeology degrees have an even gender balance, with slightly more
women. Forensic degrees have a higher percentage of women (a positive outcome in
getting more women into STEMM subjects). Fluctuations result from minor changes in
gender balance within a small cohort. Overall, 63-71% of our UG students are female.
Although consistent with the national profile, we will take action to encourage
recruitment of men in consultation with our marketing department [AP3] and review
the situation after each intake.
Differences between Archaeology and Forensic programmes include recruitment
requirements (Forensic have specific science entry requirements, chemistry for FS and
biology for FMS), recruitment catchment areas (Arch/FAA are national, FS/FMS more
local). These intersect with ethnicity and a higher proportion of female ethnic minority
students from the local area (in keeping with the University’s social inclusion agenda)
particularly on the FMS course (Table 4.1). 71% of female students on Forensics are
BME while 58% of males are white. In Archaeology, female and especially male students
are mainly white [AP4].
Table 4.1: Data on ethnicity (where known) of Undergraduate new entrants to degree
areas, expressed as aggregated Headcounts / Percentage of degree area (2015/16 –
2017/18 only available)
Forensic Archaeology
BME Female 25 / 71% 15 / 43%
20White Female 10 / 29% 20 / 57%
Total 35 / 100% 35 / 100%
BME Male 10 / 42% 6 / 24%
White Male 14 / 58% 19 / 76%
Total 24 / 100% 25 / 100%
Table 4.2: Total number (Headcount) of Full-Time and Part-Time Students (FTEs) on
Undergraduate Courses, by gender
Mode of Study
Year Gender Total
Full Time Part Time
Female 105 5 110
2014/15
Male 60 1 61
Female 109 3 112
2015/16
Male 61 4 65
Female 102 0 102
2016/17
Male 50 0 50
Female 107 0 107
2017/18
Male 44 0 44
Few students study in SAFS part-time (Table 4.2); none in 2016/17 and 2017/18. In
2014/15, 71% of seven part-time students were female. In 2015/16, 43% of seven part-
time students were female it is clear both men and women chose to study part time.
While we continue to offer PT UG routes, there is a low take-up. This may be a response
to funding. The new EDI student consultation groups [AP1] will enable us to understand
motivations and act accordingly. Students can take a credit accumulation route by
arrangement.
Student Applications and offers:
Students applying through UCAS who meet the subject requirements and who hold or
are predicted appropriate tariff score receive an offer, usually conditional, without
interview. Mature / non-standard applicants may have relevant experience which is
considered. Applicants are invited to an Applicant Experience Day (AED) which includes
tours of facilities, meeting staff and students to enhance conversion rates. There are no
initiatives targeted at specific genders; normally both male and female staff are
21involved at ODs and AEDs, but the student gender ratio leads to a preponderance of
female student helpers which will be considered in our aim to encourage male student
applicants [AP3].
Table 4.3: Archaeology student applications, offers and enrolment
Percentage of those
applicants enrolling
applicants made
Percentage of
Percentage of
Year Gender
Applications
made offers
Enrolment
enrolling
Offers
offers
Female 57 51 12 89% 24% 21%
2014/15 Male 50 43 16 86% 37% 32%
% Female 53% 54% 43%
Female 81 74 18 91% 24% 22%
2015/16 Male 44 39 11 89% 28% 25%
% Female 65% 65% 62%
Female 84 69 16 82% 23% 19%
2016/17 Male 33 24 5 73% 21% 15%
% Female 72% 74% 76%
Female 69 59 9 86% 15% 13%
2017/18 Male 35 29 6 83% 21% 17%
% Female 66% 67% 60%
Female 291 253 55 87% 22% 19%
Overall Male 162 135 38 83% 28% 23%
% Female 64% 65% 59%
Key observations (Table 4.3):
• Total numbers of applicants to our archaeology degrees varies from 104
(2017/18) to 125 (2015/16), with the percentage of female applicants varying
between 53 and 72%, female applications tend to rise and male applications
tend to decline.
• Females are slightly more likely to receive an offer (which is based entirely on
grades achieved/predicted, suggesting some difference in overall
attainment/predicted grades).
• Males holding an offer are more likely to enrol.
22• We need to encourage more applications from men and increase the
proportion of females made an offer who go on to enrol. [AP3; AP5]
Table 4.4: Forensic student applications, offers and enrolment
Percentage of those
applicants enrolling
applicants made
Percentage of
Percentage of
Applications
Year Gender
made offers
Enrolment
enrolling
Offers
offers
Female 105 86 20 82% 23% 19%
2014/15 Male 66 56 12 85% 21% 18%
% Female 61% 61% 63%
Female 97 78 12 80% 15% 12%
2015/16 Male 78 62 10 79% 16% 13%
% Female 55% 56% 55%
Female 107 81 18 76% 22% 17%
2016/17 Male 55 35 8 64% 23% 15%
% Female 66% 70% 69%
Female 202 163 34 81% 21% 17%
2017/18 Male 86 69 5 80% 7% 6%
% Female 70% 70% 87%
Female 511 408 84 80% 21% 16%
Overall Male 285 222 35 78% 16% 12%
% Female 64% 65% 71%
Key observations (Table 4.4):
• Total number of applicants to forensic degrees fluctuated from 171
(2014/15) to 288 (2017/18), with the percentage of female applicants
varying between 55 and 70%.
• Male data for 2017/18 shows a decline in number and percentage of
applicants enrolling, although the number applying increased.
• Percentages of females enrolling have remained fairly constant, with an
increase in number applying in 2017/18.
Data reveals fluctuation in the gender balance year on year. Larger percentage
difference for archaeology reflect the smaller number of applicants, offers and
enrolments. At school level this ‘noise’ is suppressed, showing even proportions of men
and women across all stages, suggesting fair practice, but fluctuation in the gender
balance of applicants. Overall, females are slightly more likely to receive offers (related
23to A-level predicted grades). However, a higher percentage of male applicants convert
and enrol in Archaeology, but fewer in Forensic courses.
It is difficult to influence the gender balance of applications [AP3]; AP5 addresses
conversion processes [AP5].
UG Student Degree Attainment
Data for degree attainment for the School annually (Table 4.5) and aggregated (Figure
4.4) show the majority of students (male and female), obtained good honours (64.7%
for women and 54.7% for men), though over the last four years 13 students (4M, 9F)
obtained an Ordinary degree and five students failed (4M, 1F) in the final year.
Percentage values suggest women were slightly more likely to obtain a 1st class
honours (23.5% of females and 17.0% of males).
Table 4.5: Student attainment by gender for each year separately 2014/15-2017/18
Headcounts Percentages per
outcome
Academic Outcome Female Male Total Female Male
Year
2014/5 1st 7 2 9 77.8 22.2
Upper 2nd 15 5 20 75.0 25.0
Lower 2nd 7 5 12 58.3 41.7
3rd/Pass - 1 1 0.0 100.0
Enhanced - - - n/a n/a
Ordinary 2 - 2 100.0 0.0
Foundation - - - n/a n/a
Fail 1 3 4 25.0 75.0
2015/6 1st 5 1 6 83.3 16.7
Upper 2nd 9 4 13 69.2 30.8
Lower 2nd 8 7 15 53.3 46.7
3rd/Pass - - - n/a n/a
Enhanced - - - n/a n/a
Ordinary 4 3 7 57.1 42.9
Foundation - - - n/a n/a
24Fail - 1 1 0.0 100.0
2016/7 1st 9 2 11 81.8 18.2
Upper 2nd 11 8 19 57.9 42.1
Lower 2nd 5 1 6 83.3 16.7
3rd/Pass - - - n/a n/a
Enhanced - - - n/a n/a
Ordinary 2 1 3 66.7 33.3
Foundation - - - n/a n/a
Fail - - - n/a n/a
2017/8 1st 3 4 n/a n/a
Upper 2nd 7 3 n/a n/a
Lower 2nd 4 1 n/a n/a
3rd/Pass - 1 n/a n/a
Enhanced 2 - n/a n/a
Ordinary 1 - n/a n/a
Foundation - - n/a n/a
Fail - - n/a n/a
Figure 4.4: Aggregated undergraduate degree attainment by gender 2014/15–2017/18
2570.0%
60.0%
50.0%
40.0%
30.0%
20.0%
10.0%
0.0%
Female Male Female Male Female Male Female Male
14/15 15/16 16/17 17/18
1St Upper 2nd Lower 2nd 3rd/Pass Enhanced Ordinary Fail
Fluctuations relate to small numbers across degrees and are hard to identify. When
grouped there appears to be a trend in attainment of higher-grade degrees by gender
with men obtaining better degree outcomes (see Figure 4.5).
Figure 4.5: Percentage of gender cohort attainment of 1st class or 2(1) Degree by year
Percentage of cohort attainment of 1st of 2(1)
degree by gender over time
90%
80%
70%
60%
50%
40%
30%
20%
10%
0%
14/15 15/16 16/17 17/18
female male
We suspect this is related to us including Forensics programmes which have a higher
proportion of female BME students. Attainment by ethnicity will be collected and
monitored following the June exam board by the SEDC [AP2; AP6] and action planned
accordingly.
(iii) Numbers of men and women on postgraduate taught degrees
Full- and part-time. Provide data on course application, offers and acceptance rates and
degree completion rates by gender.
26Students are recruited from both existing UG students, and from external Home/EU
and Overseas. PGT applicants apply centrally and automatically offered a place if they
meet criteria, with course team involved in any marginal decisions.
Figure 4.6: Number of students on all SAFS PGT courses, plus percentage female and
National comparison
100 100
90 90
Percentage Female Students
80 72.2 72.4 71.1 80
Student Headcount
70 77.3 70
60 60
64.1
50 56.1 50
40 40
41.5
30 30
20 41 20
34
10 24 23 23 10
17 18 10
0 0
2014/5 2015/6 2016/7 2017/8
Academic Year
Female Male Percentage Female National data
Over time, the number of women taking PGT degrees has increased (Figure 4.6), while
‘men’ has stayed relatively constant until 2017/18 when the number of men fell, these
trends lead to an increasing proportion of female students.
In comparison to national data, our male representation had been better than national
averages to 2016/17. We will take steps to encourage more male students to take our
PGT courses [AP3].
Recently more men chose part-time study than women (Table 4.7). This may reflect the
professional part-time route in MSc FACSI and HOP, which allow serving police officers
and forensic experts (fields are still predominantly male) to take the degrees on a ‘day-
release’ model. Many part-time students are mature students, and the gender balance
could reflect external factors. Some male part-time students were retired, and female
part-time students worked alongside studies. We will investigate further our part-time
student body and their context [AP1]. Numbers and proportions of females of PGT
courses have increased overall.
Table 4.6: Total number of Full-Time and Part-Time Students (FTEs) on PGT Courses
Mode of Study Percent
Year Gender Total Part-Time
Full Time Part Time
Female 15 2 17 12%
2014/15
Male 18 6 24 25%
Female 20 3 23 13%
2015/16
Male 11 7 18 39%
27Female 28 5 33 15%
2016/17
Male 14 9 23 39%
Female 28 6 34 18%
2017/18
Male 6 4 10 40%
Table 4.7: PGT student applications, offers and enrolments
Percentage of those
applicants enrolling
applicants made
Percentage of
Percentage of
Applications
made offers
Year Gender
Enrolment
enrolling
Offers
offers
Female 82 69 16 84% 23% 20%
2014/15 Male 72 62 24 86% 39% 33%
% Female 53% 53% 40%
Female 102 86 22 84% 26% 22%
2015/16 Male 64 45 12 70% 27% 19%
% Female 61% 66% 65%
Female 118 100 36 85% 36% 31%
2016/17 Male 76 46 15 61% 33% 20%
% Female 61% 68% 71%
Female 115 79 31 69% 39% 27%
2017/18 Male 48 26 8 54% 31% 17%
% Female 71% 75% 79%
Female 417 334 105 80% 31% 25%
Overall Male 260 179 59 69% 33% 23%
% Female 62% 65% 64%
Figure 4.7: PGT Percentage of Enrolments to Applicants by gender 2014/5 to 2017/8
50%
45%
40%
35%
33%
30% 31%
27%
25%
22%
20% 20% 19% 20%
15% 17%
10%
5%
0%
2014/5 2015/6 2016/7 2017/8
Female Male
28Key points:
• The percentage of female applicants has increased, reaching 71% in 2017/18
(Table 4.8)
• Women are more likely to apply than men (Figure 4.7), but women and men
with offers are equally likely to enrol Table 4.6).
It is difficult to influence the gender balance of applications; we need to ensure that we
attract more male as well as women applicants to our degrees [AP3].
Table 4.8a: Completions of PGT students (HESA returns)
Successful Unsuccessful Totals
Completions Completions
Academic Year Female Male Female Male Female Male
2014/15 11 10 0 0 11 10
2015/16 14 18 3 2 17 20
2016/17 19 13 2 5 21 18
2017/18 2 5 2 0 4 5
Numbers are small, not showing any clear trend in respect of completions of men and
women. Table 4.8a does not include attainment beyond successful completion at the
first attempt; information on award achieved (e.g. Distinctions, Merits) and attainment
by ethnicity and home/overseas status will be collected and analysed going forward
[AP2].
(iv) Numbers of men and women on postgraduate research degrees
Full- and part-time. Provide data on course application, offers, acceptance and
degree completion rates by gender.
Most PGR students enrol on PhD programmes, with a small number of MPhil
applicants – none since 2016. Most research projects are developed by the
student, alongside their nominated supervisor(s), with a small proportion of
funded studentships within staff research projects. Applications are administered
centrally. Applicants are interviewed by supervisors and an additional panel
member. 62% of females who apply enrol, vs 24% of males (Table 4.8b, Table
4.8c). This is a statistically significant, especially given that males comprise 60% of
applicants (chi-square 4.008 p=0.0452) [AP3].
29Table 4.8b: PGR student applications, offers and enrolments
Proportion of
Enrolments to
Headcounts Percentages Applicants
Academic
Year Stage Female Male Total Female Male Female Male
Applicants 8 9 17 47% 53%
2014/5 Offers 6 2 8 75% 25%
Enrolment 6 2 8 75% 25% 75% 22%
Applicants 5 9 14 36% 64%
2015/6 Offers 2 5 7 29% 71%
Enrolment 2 5 7 29% 71% 40% 56%
Applicants 7 12 19 37% 63%
2016/7 Offers 6 2 8 75% 25%
Enrolment 5 2 7 71% 29% 71% 17%
Applicants 5 7 12 42% 58%
2017/8 Offers 5 2 7 71% 29%
Enrolment 3 0 3 100% 0% 60% 0%
Table 4.8c: Chart of PGR student applications, offers and enrolments
PGR Student Recruitment 2014/5 to 2017/8
120%
100%
80%
60%
40% Female
20% Male
0%
Enrolment
Enrolment
Enrolment
Enrolment
Applicants
Applicants
Applicants
Applicants
Offers
Offers
Offers
Offers
2014/5 2015/6 2016/7 2017/8
Figure 4.8: PGR headcount of students (National figures from HEIDI+ data)
3040 100
35 90
Percentage Female Students
73.9 72.2 80
30 66.7
Student Headcount 62.5 70
25 60
20 60.2 61 50
57.8
15 40
30
10
17 15 16 20
13
5 9 10
6 8
5
0 0
2014/5 2015/6 2016/7 2017/8
Academic Year
Female Male % Female National data (%female)
Overall the numbers of male and female PGR students are stable although they
fell in 2017/18 (Figure 4.8). Approximately 2/3 of PGR students are women,
which is slightly higher than the national average. We will encourage male
students to take up PGR study [AP3].
Table 4.9: Completion rates of PGR students (HESA return)
Numbers
2014/15 2015/16 2016/17 2017/18
Female Successfully completed 0 3 5 5
Obtained fall-back award 0 0 0 0
Failed 2 0 0 0
Female Total 2 3 5 5
Male Successfully completed 3 1 0 0
Obtained fall-back award 0 0 0 0
Failed 0 1 1 0
Male Total 3 2 1 0
At PGR level the distinction between Forensic and Archaeology students is less
prominent and are analysed at a school-wide level. Completion rates are high for
31women and poorer for males (Table 4.9), tied to smaller male numbers [AP3],
however, the numbers are small; more data are needed to discern any trends.
Women are more likely to undertake a research degree part-time than men
(Table 4.10), although numbers are too small to discern patterns.
Table 4.10: Headcount totals of Full-Time and Part-Time PGR Students
Mode of Study Percentage
Year Gender Total Part-time
Full Time Part Time
Female 12 5 17 29%
2014/15
Male 5 1 6 17%
Female 12 9 21 43%
2015/16
Male 3 0 3 0%
Female 12 8 20 40%
2016/17
Male 4 0 4 0%
Female 10 5 15 33%
2017/18
Male 3 0 3 0%
(v) Progression pipeline between undergraduate and postgraduate student levels
Identify and comment on any issues in the pipeline between undergraduate and
postgraduate degrees.
Figure 4.9: Figures comparing UG, PGT and PGR levels for percentage female students
100
90
Percentage of students who are female
80
70
60
50
40 78.7 77.3
73.9 72.2
64.3 63.3 67.1 64.1 66.7
30 62.5
56.1
20 41.5
10
0
2014/15 2015/16 2016/17 2017/18
UG PGT PGR
Women’s representation is similar at all levels suggesting little leakage (Figure
4.9). The trends suggest an increase over time in women’s representation. By
2017/18 representation was over 70% at all levels. The data shows an
underrepresentation of males at most levels. Attracting men at UG and PGT
32levels (discussed above) will have a long-term impact on feeding PGR numbers
[AP3; AP5].
Figure 4.10: Graduation 2017 highlighting female successes at PGR
4.2. Academic and research staff data
(i) Academic staff by grade, contract function and gender: research-only, teaching
and research or teaching-only
Look at the career pipeline and comment on and explain any differences between
men and women. Identify any gender issues in the pipeline at particular
grades/job type/academic contract type.
SILVER APPLICATIONS ONLY
Where relevant, comment on the transition of technical staff to academic roles.
33SAFS Staff
Table 4.11: Summary of career paths and grades: all academic staff undertaking
teaching and research
Career Path
Grade
Research-only Professional Support Academic (T&R)
Grade 4 Technician / Administrator
Grade 5 Technician / Administrator
Senior Technician /
Grade 6
Administrator
Postdoctoral Research
Grade 7
Assistant
Grade 8/9 Postdoctoral Research Fellow Lecturer
Senior Lecturer
Grade 10
Reader
Grade 11+ Professor
Figure 4.11: Numbers of staff of all grades within SAFS, and percentage female, all available
data
20 47 50.0
18 43 45.0
39
16 40.0 Percentage of female staff
Staff Headcount
14 35.0
12 30.0
10 25.0
8 20.0
14
6 12 15.0
10
4 9 9 9 10.0
2 5.0
0 0.0
2016/17 2017/18 2018/19
Female Male % Female
Over the last two years, the total number of staff has fallen: one staff member retiring
(M) and another leaving for a career opportunity (M). A postdoctoral research assistant
(F) left due to a career opportunity and end of contract and another 3 (F) arrived.
34You can also read