Material System Analysis of Nine Raw Materials: Barytes, Bismuth, Hafnium, Helium, Natural Rubber, Phosphorus, Scandium, Tantalum and Vanadium
←
→
Page content transcription
If your browser does not render page correctly, please read the page content below
Material System Analysis of Nine Raw
Materials: Barytes, Bismuth, Hafnium,
Helium, Natural Rubber, Phosphorus,
Scandium, Tantalum and Vanadium

                        Matos, C. T.; Devauze, C; Planchon, M;
                        Wittmer, D; Ewers, B; Auberger, A; Dittrich, M;
                        Latunussa, C; Eynard, U; Mathieux, F

                        2021

                                                                          EUR 30704 EN
This publication is a report by the Joint Research Centre (JRC), the European Commission’s science and knowledge service. It aims to provide
evidence-based scientific support to the European policymaking process. The scientific output expressed does not imply a policy position of
the European Commission. Neither the European Commission nor any person acting on behalf of the Commission is responsible for the use
that might be made of this publication. For information on the methodology and quality underlying the data used in this publication for
which the source is neither Eurostat nor other Commission services, users should contact the referenced source. The designations employed
and the presentation of material on the maps do not imply the expression of any opinion whatsoever on the part of the European Union
concerning the legal status of any country, territory, city or area or of its authorities, or concerning the delimitation of its frontiers or
boundaries.

Contact information
Name: Fabrice Mathieux
Address: Joint Research Centre
Directorate D – Sustainable Resources
Unit D3 – Land Resources
Via E. Fermi 2749, Building 100, TP 122, I-21027 Ispra (VA) - Italy
Email: Fabrice.MATHIEUX@ec.europa.eu

EU Science Hub
https://ec.europa.eu/jrc

JRC125101

EUR 30704 EN

   PDF          ISBN 978-92-76-37768-9                 ISSN 1831-9424             doi:10.2760/677981

Luxembourg: Publications Office of the European Union, 2021

© European Union, 2021

The reuse policy of the European Commission is implemented by the Commission Decision 2011/833/EU of 12 December 2011 on the
reuse of Commission documents (OJ L 330, 14.12.2011, p. 39). Except otherwise noted, the reuse of this document is authorised under the
Creative Commons Attribution 4.0 International (CC BY 4.0) licence (https://creativecommons.org/licenses/by/4.0/). This means that reuse is
allowed provided appropriate credit is given and any changes are indicated. For any use or reproduction of photos or other material that is
not owned by the EU, permission must be sought directly from the copyright holders.

All content © European Union, 2021

How to cite this report: Matos, C..T; Devauze, C; Planchon, M; Ewers, B; Auberger, A; Dittrich, M; Wittmer, D; Latunussa, C; Eynard, U; Mathieux,
F, Material System Analysis of Nine Raw Materials: Barytes, Bismuth, Hafnium, Helium, Natural Rubber, Phosphorus, Scandium, Tantalum
and Vanadium, EUR 30704 EN, Publications Office of the European Union, Luxembourg, 2021, ISBN 978-92-76-37768-9,
doi:10.2760/677981, JRC125101.

Contents

List of figures ........................................................................................................................................................................................................................................................ 1
List of tables ........................................................................................................................................................................................................................................................... 3
Acknowledgements .......................................................................................................................................................................................................................................... 4
Abstract ....................................................................................................................................................................................................................................................................... 5
1 Introduction..................................................................................................................................................................................................................................................... 6
        1.1 MSA methodology ....................................................................................................................................................................................................................... 6
        1.2 Approach followed by the project team ................................................................................................................................................................ 7
                 1.2.1                Validation workshops ............................................................................................................................................................................................ 8
2 Material system analysis of Barytes ...................................................................................................................................................................................10
        2.1 Value chain .....................................................................................................................................................................................................................................10
        2.2 Description of the main flows and stocks ........................................................................................................................................................10
        2.3 Indicators ..........................................................................................................................................................................................................................................12
        2.4 Data sources, assumptions and reliability of results .............................................................................................................................13
3 Material system analysis of Bismuth .................................................................................................................................................................................14
        3.1 Value chain .....................................................................................................................................................................................................................................14
        3.2 Description of the main flows and stocks ........................................................................................................................................................14
        3.3 Indicators ..........................................................................................................................................................................................................................................16
        3.4 Data sources, assumptions and reliability of results .............................................................................................................................17
4 Material system analysis of Hafnium ................................................................................................................................................................................18
        4.1 Value chain .....................................................................................................................................................................................................................................18
        4.2 Description of the main flows and stocks ........................................................................................................................................................18
        4.3 Indicators ..........................................................................................................................................................................................................................................20
        4.4 Data sources, assumptions and reliability of results .............................................................................................................................21
5 Material system analysis of Helium ....................................................................................................................................................................................22
        5.1 Value chain .....................................................................................................................................................................................................................................22
        5.2 Description of the main flows and stocks ........................................................................................................................................................22
        5.3 Indicators ..........................................................................................................................................................................................................................................24
        5.4 Data sources, assumptions and reliability of results .............................................................................................................................24
6 Material system analysis of Natural Rubber ...............................................................................................................................................................25
        6.1 Value chain .....................................................................................................................................................................................................................................25
        6.2 Description of the main flows and stocks ........................................................................................................................................................26
        6.3 Indicators ..........................................................................................................................................................................................................................................28
        6.4 Data sources, assumptions and reliability of results .............................................................................................................................29
7 Material system analysis of Elemental Phosphorus ............................................................................................................................................30
        7.1 Value chain .....................................................................................................................................................................................................................................30
        7.2 Description of the main flows and stocks ........................................................................................................................................................31
        7.3 Indicators ..........................................................................................................................................................................................................................................33

                                                                                                                                         i
7.4 Data sources, assumptions and reliability of results .............................................................................................................................33
8 Material system analysis of Scandium .............................................................................................................................................................................35
        8.1 Value chain .....................................................................................................................................................................................................................................35
        8.2 Description of the main flows and stocks ........................................................................................................................................................36
        8.3 Indicators ..........................................................................................................................................................................................................................................37
        8.4 Data sources, assumptions and reliability of results .............................................................................................................................37
9 Material system analysis of Tantalum ..............................................................................................................................................................................39
        9.1 Value chain .....................................................................................................................................................................................................................................39
        9.2 Description of the main flows and stocks ........................................................................................................................................................40
        9.3 Indicators ..........................................................................................................................................................................................................................................42
        9.4 Data sources, assumptions and reliability of results .............................................................................................................................43
10 Material system analysis of Vanadium ............................................................................................................................................................................44
        10.1 Value chain .....................................................................................................................................................................................................................................44
        10.2 Description of the main flows and stocks ........................................................................................................................................................45
        10.3 Indicators ..........................................................................................................................................................................................................................................47
        10.4 Data sources, assumptions and reliability of results .............................................................................................................................48
11 Conclusions ..................................................................................................................................................................................................................................................49
12 References ....................................................................................................................................................................................................................................................52
List of abbreviations ....................................................................................................................................................................................................................................56
Annexes ....................................................................................................................................................................................................................................................................57
        Annex 1. Material Flow/Stock Parameters .....................................................................................................................................................................57
        Annex 2. Workshop attendance list ......................................................................................................................................................................................58

                                                                                                                                      ii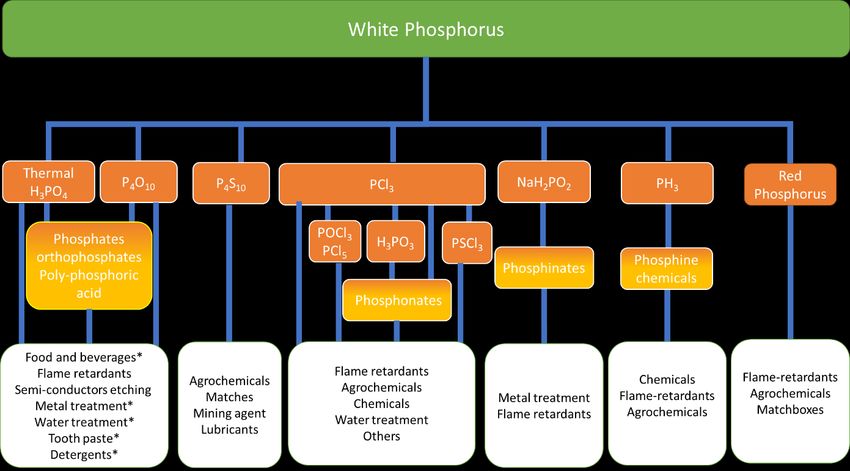
List of figures
Figure 1. MSA system with all the processes (material life cycle stages), flows and stocks considered in a MSA.
The system border is the geographical border of the EU (Matos et al, 2020). ...........................................................................9
Figure 2. Value chain of baryte. ............................................................................................................................................................................. 10
Figure 3. Simplified Sankey diagram for baryte for the year 2016 in the EU (without the UK). Imports of
products include also imports of intermediate products 32 kt Ba. ................................................................................................. 11
Figure 4. Shares of finished-products containing baryte manufactured in the EU and shares of finished-
products containing baryte used in the EU (taking into account exports and imports of products). ......................... 12
Figure 5. Value chain of bismuth. ......................................................................................................................................................................... 14
Figure 6. Simplified Sankey diagram for bismuth for the year 2016 in the EU (without the UK). .............................. 15
Figure 7. Shares of finished-products containing bismuth manufactured in the EU and shares of finished-
products containing bismuth used in the EU (taking into account exports and imports of products). ..................... 16
Figure 8. Value chain of hafnium, steps in green occur in the EU, steps in orange occur only outside of the EU.
.................................................................................................................................................................................................................................................... 18
Figure 9. Simplified Sankey diagram for hafnium for the year 2016 in the EU (without the UK). ............................. 19
Figure 10. Shares of finished-products containing hafnium manufactured in the EU and shares of finished-
products containing hafnium used in the EU (taking into account exports and imports of products). ..................... 20
Figure 11. Value chain of helium. ......................................................................................................................................................................... 22
Figure 12. Simplified Sankey Diagram for helium for the year 2016 in the EU (without the UK). ............................. 23
Figure 13. Uses of helium in the EU (by share of helium used in the application) ............................................................... 23
Figure 14. Value chain of natural rubber, steps in green occur in the EU, steps in orange occur only outside of
the EU. .................................................................................................................................................................................................................................... 26
Figure 15. Details for the manufacturing and use steps in the natural rubber value chain, in regards to the
commodities entering GRGs and tyres manufacturing processes. *Tyres manufacturing companies usually
perform their own formulations and vulcanisations processes. ....................................................................................................... 26
Figure 16. Simplified Sankey diagram for natural rubber for the year 2016 in the EU (without the UK). Imports
of products also include imports of intermediate products 25 kt of NR in compounded rubber and vulcanised
rubber. .................................................................................................................................................................................................................................... 27
Figure 17. Shares of finished-products containing natural rubber manufactured in the EU and shares of
finished-products containing natural rubber in the EU (taking into account exports and imports of products). 28
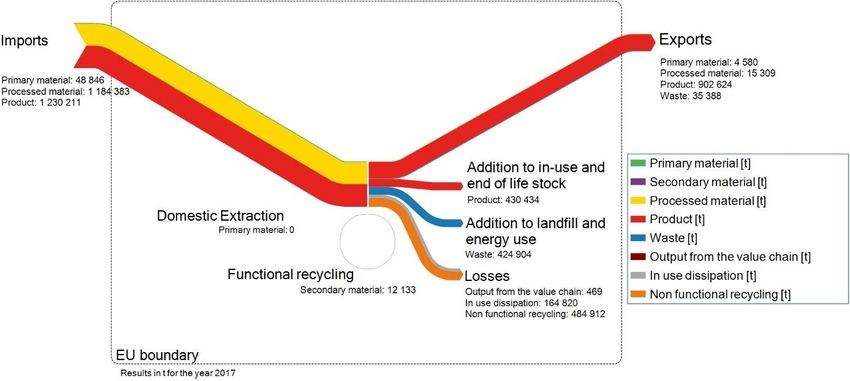
Figure 18. Value chain of elemental phosphorus P4, steps in green occur in the EU, steps in orange occur only
outside of the EU. ............................................................................................................................................................................................................ 30
Figure 19. Simplified chemical family of P4, derivatives, intermediates, products and final applications *
applications that can be obtained from thermal phosphoric acid or purified wet phosphoric acid. .......................... 31
Figure 20. Simplified Sankey diagram for elemental phosphorus for the year 2016 in the EU (without the UK).
.................................................................................................................................................................................................................................................... 32
Figure 21. Shares of finished-products containing elemental phosphorus manufactured in the EU and shares
of finished-products containing elemental phosphorus used in the EU (taking into account exports and imports
of products). This are estimates based on inputs form ESP, independent industry expert Willem Schipper and
trade data (see notes in section 7.4). ................................................................................................................................................................. 32
Figure 22. Value chain of scandium, steps in green occur in the EU, steps in orange occur only outside of the
EU. ............................................................................................................................................................................................................................................. 35
Figure 23. Simplified Sankey diagram for scandium for the year 2016 in the EU (without the UK). Imports of
processed material include 792 kg Sc in scandium compounds and 72 kg Sc in Sc-Al master alloys or
scandium metal, respectively. Imports of products include 255 kg Sc of Al-Sc alloys, SOFCs and airplanes
containing Sc. ..................................................................................................................................................................................................................... 36
1
Figure 24. Estimated shares of finished-products containing scandium manufactured in the EU and shares of
finished-products containing scandium used in the EU (taking into account exports and imports of products).
.................................................................................................................................................................................................................................................... 37
Figure 25. Value chain of tantalum. .................................................................................................................................................................... 40
Figure 26: Details for the manufacturing step in the tantalum value chain. ............................................................................ 40
Figure 27. Simplified Sankey diagram for tantalum for the year 2016 in the EU (without the UK). Figure for
functional recycling includes both new (108 t Ta) and old scrap (85 t Ta). .............................................................................. 41
Figure 28. Shares of finished-products containing tantalum manufactured in the EU and shares of finished-
products containing tantalum used in the EU (taking into account exports and imports of products). ................... 42
Figure 29. Value chain of vanadium. .................................................................................................................................................................. 45
Figure 30. Simplified Sankey diagram for vanadium for the year 2015 in the EU (without the UK)........................ 46
Figure 31. Shares of finished-products containing vanadium manufactured in the EU (left chart) and shares of
finished-products containing vanadium in the EU (right chart) taking into account exports and imports of
products................................................................................................................................................................................................................................. 47
Figure 32. Distribution of the uses of the targeted materials in four applications: chemicals, rubber and
plastics, superalloys and electrical equipment. ............................................................................................................................................ 51

                                                                                                                          2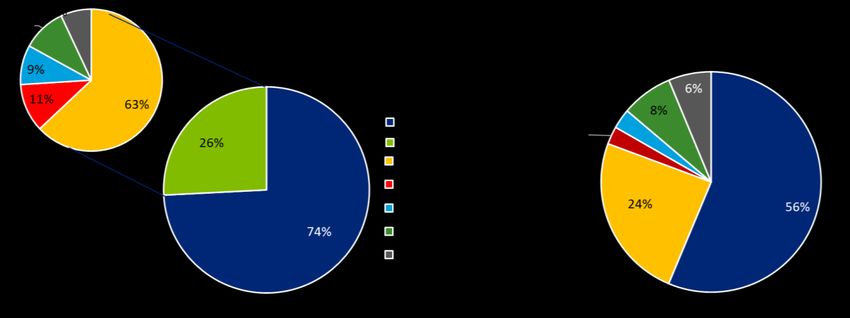
List of tables

Table 1. Different indicators that describe the material situation in the EU.
                                                                                         7
Table 2. Distribution of the MSA studies between the experts involved in the work
                                                                                         7
Table 3. Dates of validation workshop webinars for each raw material
                                                                                         8

Table 4. Different indicators that describe the barytes situation in the EU.            12

Table 5. Different indicators that describe the bismuth situation in the EU.            16

Table 6. Different indicators that describe the hafnium situation in the EU.            20

Table 7. Different indicators that describe the helium situation in the EU.             24

Table 8. Different indicators that describe the natural rubber situation in the EU.     28

Table 9. Different indicators that describe the white phosphorus situation in the EU.   33

Table 10. Different indicators that describe the scandium situation in the EU.          37

Table 11. Different indicators that describe the tantalum situation in the EU.          43

Table 12. Different indicators that describe the vanadium situation in the EU.          47

                                                       3
Acknowledgements
The authors of the report acknowledge the contributions of the participants of the validation workshops (see
Annexes) that took place between May and July of 2020.
Authors
Matos, C. T.1; Devauze, C.2; Planchon, M.2; Wittmer, D. 1; Ewers, B. 3; Auberger, A.3; Dittrich, M.3; Latunussa, C.1;
Eynard, U.1; Mathieux, F.1.
1
Joint Research Centre – European Commission
2
In Extenso Innovation Croissance
3
ifeu Heidelberg
Contributions of the authors:
- Cristina Torres de Matos coordinated the work, led the MSA for natural rubber and elemental phosphorus,
reviewed all the MSA studies and compiled the report;
- Chloé Devauze and Mariane Planchon led the MSA for barytes, bismuth, vanadium and tantalum;
- Dominic Wittmer led the MSA for scandium and reviewed the MSA of hafnium and vanadium;
- Birte Ewers, Andreas Auberger and Monika Dittrich led the MSA for hafnium and helium;
- Cynthia Latunussa helped in the development of natural rubber and elemental phosphorus MSA and reviewed
the MSA of barytes, helium and tantalum;
- Umberto Eynard reviewed the MSA of bismuth and the report;
- Fabrice Mathieux supervised the work and reviewed the report.
4Abstract
Consistent information on raw material value chains is key for sustainable resources management, to guarantee
supply of raw materials and strengthen the EU industry competitiveness. The European Commission launched
the development of Material System Analysis (MSA) studies in 2015, to assess the flows of materials through
the EU economy, including extraction, stock accumulation and end-of-life management e.g., through disposal
or recovery in the EU. The MSA studies consider the entire life cycle of a selected material. This highlights
hotspots and bottlenecks in a material value chain. Awareness of weak points in the value chain can guide
actions designed to increase the resilience of the supply chain, also in the face of disrupting events. MSA, by
virtue of accounting for materials in stock, can also help identifying opportunities to source materials from
urban mine or waste streams, allowing to improve the overall circularity of the EU. The systemic view of the
MSA also lends itself to develop and support scenarios and outlooks.
The current report includes the MSA for the raw materials: barytes, bismuth, hafnium, helium, natural rubber,
elemental phosphorus, scandium, tantalum and vanadium. These materials have been or are considered critical
raw materials in the EU.
The materials cycles analysed show a very strong dependence on imports along the value chain. The EU is highly
dependent on imports of primary materials and intermediate products and has a consolidated manufacturing
stage for all the materials analysed (except for helium).
The EU is efficient in collecting end-of-life products, however most of the targeted materials are lost due to in-
use dissipation, non-functional recycling, or disposal in other waste streams. This indicates that the EU is not
yet able to decrease its dependency of primary material using secondary materials domestically recycled.
However, for some materials (e.g. elemental phosphorus) significant efforts are undertaken to change this
situation in the future to improve the EU circularity.
The developed MSA are comprehensive datasets that may provide crucial knowledge to help the development
and monitoring of EU polices including: the EU list of Critical Raw Materials, the new EU Industrial Strategy, the
Green Deal transition plan, the EU Raw Materials Initiative and the EU Circular Economy Action Plan.
51 Introduction
Critical raw materials are raw materials that have both a high economic importance and a high supply risk. In
2011, the European Commission published its first list of critical raw materials, which is updated every three
years. (European Commission, 2011, 2014, 2017a, 2020). The Commission put an action plan in place to
increase the resilience of their supply chains, by 1) stimulating their domestic production; 2) enhancing their
efficient use and recycling; 3) diversifying sourcing from 3rd countries. Additionally, the EU Green Deal (European
Commission, 2019) and the EU industrial strategy clearly highlight the need for unhindered access to raw
materials, in particular of critical raw materials that are necessary to key priorities of the EU policies such as
low carbon technologies, digital, space and defence applications.
In order to ensure sustainable resources management of these raw materials, consistent information on their
value chains is key. In the context of the EU Raw Materials Initiative (European Commission, 2008) the European
Commission launched the development of Material System Analysis (MSA) studies in 2015 (BIO by Deloitte,
2015). An MSA is an assessment of the flows of materials through the EU economy, including extraction, stock
accumulation and end-of-life management e.g., through disposal or recovery in the EU. The MSA studies
consider the entire life cycle of a selected material which is crucial for developing sound sustainable resource
management strategies.
A MSA highlights hotspots and bottlenecks in a material value chain. Awareness of weak points in the value
chain can guide actions designed to increase the resilience of the supply chain, also in the face of disrupting
events. MSA, by virtue of accounting for materials in stock, can also help identifying opportunities to source
materials from urban mine or waste streams, allowing to improve the overall circularity of the EU (European
Commission, 2020c). The systemic view of the MSA also lends itself to develop and support scenarios and
outlooks.
The first series of 28 MSA was published in 2015 (BIO by Deloitte, 2015), a second series covering three
materials in 2018 (Passarini et al., 2018) and in 2020 five MSA were developed for battery related raw
materials (Matos et al., 2020).
The focus of this report is on nine raw materials that entered the list of critical raw materials in 2017. The
current report includes the MSA for the raw materials: barytes, bismuth, hafnium, helium, natural rubber,
elemental phosphorus, scandium, tantalum and vanadium.
The report describes the main findings of the MSA studies, using a consistent structure. Chapters 2 to 10 are
summaries of the MSAs studies for the nine raw materials, while chapter 11 draws conclusions on these nine
MSAs. Each MSA summary is composed of: 1) a description of the material supply chain highlighting the stages
where the EU has productive capacity and those where the EU is dependent from external sources; 2) a summary
of the main MSA results in terms of stocks and flows, which includes a distribution of the end uses in the
manufacturing stage and use stage, and a visualisation by a simplified Sankey diagram; 3) a set of indicators
that translate the material situation for the EU, in terms of recycling, collection rates and self-sufficiency of the
EU; 4) a section describing the main sources of information and assumptions.
1.1 MSA methodology
The MSA methodology was developed and published for the European Commission with an EU scope in 2015
(BIO by Deloitte, 2015) and has been revised in 2020 (Torres de Matos et al, 2020). The MSA applies the basic
principles of Material Flow Analysis (MFA) on the EU economy, namely the systems approach and the mass
balance (on system and process level).
MSA maps and quantifies raw or advanced materials along their overall life cycle in the European Union,
including: extraction, processing, manufacturing, use, collection, recycling, reuse and disposal. Additionally, it
includes relevant material stocks in: tailings; landfills; products in the use phase, domestic reserves, and foreign
reserves (see blue boxes in Figure 1)
Figure 1 shows the MSA system, which visualises the flows and stocks considered in an MSA. They are listed in
Annex 1.
In comparison with the MSAs performed in 2015 the updated MSA methodology increases the resolution of the
MSA system as described in (Torres de Matos et al, 2020) and presented in Figure 1
The indicators used to characterise the situation of each material in the EU are the following:
6Table 13. Different indicators that describe the material situation in the EU.
Indicator Formula
(G.1.1+G.1.2)/(B.1.1+B.1.2-
End-of-life recycling input rate (EOL-RIR) B1.3+C.1.3+C.1.4+C1.8+D.1.3+D1.9+G.1.1+G.1.2)
(G1.1+G1.2+G1.3)/(E1.6+F1.2-F1.1)
End-of-life recycling rate (EOL-RR)
Collection Rate F1.4/(M4.1)
Self-sufficiency Extraction (B1.1+B1.2)/(M1.1+M1.2)
Self-sufficiency Processing C1.1/M2.1
Self-sufficiency Manufacturing D1.1/M3.1
1.2 Approach followed by the project team
The MSA of each individual material were performed according with the following distribution between experts
and the JRC (see Table 14). The JRC coordinated the work done, reviewed each MSA and assembled the current
report.
Table 14. Distribution of the MSA studies between the experts involved in the work
Raw Material Author
Barytes Chloé Devauze, Mariane Planchon from In Extenso
Innovation Croissance
Bismuth Chloé Devauze, Mariane Planchon from In Extenso
Innovation Croissance
Hafnium Birte Ewers, Andreas Auberger, Monika Dittrich
from Ifeu Heidelberg
Helium Birte Ewers, Andreas Auberger, Monika Dittrich
from ifeu Heidelberg
Natural Rubber Cristina Torres de Matos from JRC
Elemental Phosphorus Cristina Torres de Matos from JRC
Scandium Dominic Wittmer from JRC
Tantalum Mariane Planchon and Chloé Devauze from In
Extenso Innovation Croissance
Vanadium Chloé Devauze, Mariane Planchon from In Extenso
Innovation Croissance
The MSA studies draw on five consecutive reference years, from 2012 to 2016. For natural rubber and
elemental phosphorus, the dataset includes also the years 2017 and 2018. The geographic coverage of the
studies was the EU (without the UK). Priority has been given to official and publicly available data sources.
However, for some materials information was collected from stakeholders in the validation workshops. This
report summarises for each material the flows and stocks of the year 2016, except for natural rubber and
elemental phosphorus that reports the 2017 dataset and vanadium that reports 2015 dataset. For Vanadium,
the year 2016 was considered atypical due to the collapse of the main primary vanadium-slag supplier.
The detailed calculations and the results for the full period covered (2012-2018) are stored in MSA excel files
retained by the European Commission.
These MSA studies were presented and discussed with raw material experts, as described in section 1.2.1.
71.2.1 Validation workshops
The MSA studies here summarised were presented to raw material experts on two occasions during their
development: 1) criticality validation workshop; 2) webinars prepared for each of the targeted materials.
In the criticality validation workshop, the first draft results of the MSA studies were presented to raw
material experts during workshop organised by the SCRREEN project together with DG GROW and the JRC to
support the 2020 EU criticality assessment and the material system analysis. This workshop took place from
10 to 12 of September 2019 and had the following objectives: 1) validate the data and data sources used in
both studies (the criticality assessment and the material system analysis); 2) exchange data, information and
knowledge (including sources for missing data) on the target raw materials. A dedicated section was organised
for each raw material. The draft MSA excel files with the result achieved for the flows of extraction and
processing stages were distributed to the participants before the workshop and the related/draft results were
presented in the workshop, followed by discussions. The comments received during and after the workshop
were addressed, and the data collected were incorporated in the development of the complete MSA datasets.
After the preparation of complete draft MSA datasets a validation workshop was organised as webinar by
the JRC for each raw material to discuss the results of the studies. Table 15 describes the dates of each of the
webinars organised by the JRC. Important stakeholders from the value chain of each raw material were invited
and attended the webinars. The webinar for elemental phosphorus was organised together with the European
Sustainable Phosphorus Platform (ESPP) which made a wider discussion on topics related to the current
situation of P4 recycling and alternatives to the PCl3 vector possible. The lists of organisations who participated
to the workshops are provided in the Annexes. Before the webinar the complete excel dataset, summary reports
and a list of questions had been distributed among the webinar participants. Like in the first workshop the
inputs and comments received were addressed and used to prepared the final MSA dataset here summarised
for each of the 9 materials.
Table 15. Dates of validation workshop webinars for each raw material
Raw Material Webinar date
Barytes 26th of May 2020 at 14:00
Bismuth 26th of May 2020 at 16:00
Hafnium 25th of May 2020 at 14:00
Helium 25th of May 2020 at 16:00
Natura Rubber 25th of June 2020 at 14:00
Elemental Phosphorus 9th of July 2020 at 9:00
Scandium 9th of October 2020 10:00
Tantalum 28th of May 2020 14:00
Vanadium 28th of May 2020 16:00
8Figure 1. MSA system with all the processes (material life cycle stages), flows and stocks considered in a MSA. The system border is the geographical border of the EU (Matos et al, 2020).
92 Material system analysis of Barytes
2.1 Value chain
Baryte is a naturally occurring mineral (BaSO4), mainly present in stratiform deposits, as well as vein and
residual deposits. Extraction of natural baryte occurs by surface and underground mining. After natural baryte
is extracted, it is usually sorted (physical separation from other compounds e.g. gravity separation, flotation
methods) and crushed on or near the mining site, to get ground baryte, micronized baryte, baryte aggregate,
etc.
In the majority of cases, baryte produced on the mining site is sold as ground material, i.e. directly in the
manufacturing of final products (Barytes Association, 2019), (WMD, 2019a). Additional processes may be
conducted in some exceptional cases, to obtain the quality and colour required for several given applications.
For these applications, high purity and brightness of barytes are key for the industry. However, the associated
volumes remain low compared to the overall baryte market. Therefore, no processing stage is considered in the
value chain of baryte: instead, only one stage is used to reflect on production and trade figures of baryte before
manufacturing. This approach is consistent with data availability.
There is no identified secondary source of baryte: the main applications using baryte are dissipative (baryte
cannot be recovered from use in the oil and gas industry, and from applications such as paints) and baryte is
not recovered from end of life products (e.g. from fillers) (Barytes Association, 2019), (Ladenberger et al., 2018).
Baryte is the main industrial source of barium. It is mainly used as an industrial mineral, with the use of barium
metal remaining minor. Various compounds are used in the manufacturing of end-products. Barium sulfate
(BaSO4) is used as weighting agent in the oil and gas industry, as well as heavy filler in car brake pads, rubber
and plastics, and some medical applications. Barium carbonate (BaCO 3) is mostly used in glass, e.g. for electronic
applications (LED glass for television and computer screens, etc.) as well as heavy filler in paint and coatings.
Other compounds include barium titanate (in electronic applications) and barium oxide (in glass).
The main end-use of baryte is in the oil and gas industry (as weighting agent in drilling fluid). Baryte is used, to
a lesser extent, in the rubber, plastic and paint industries (as heavy filler) and in chemical applications (including
paints, for its brightness and colour).
The Figure 2 below presents the value chain of baryte and its main intermediates and end-uses. The analysis
conducted focuses on natural baryte only: intermediate compounds such as blanc fixe, obtained from synthetic
baryte, are therefore not included in the value chain (Barytes Association, 2019). A consolidated baryte industry
is established in the EU, with all value chain steps taking place in the region.
Figure 2. Value chain of baryte.
2.2 Description of the main flows and stocks
Flows and stocks are accounted in mass of barium (kt Ba) rather than in mass of baryte (BaSO4), and are
representative of the year 2016. The values presented here are not raw data but aggregated results.
Identified global resources of baryte are estimated to be around 740 million tonnes, and USGS estimated total
resources of baryte (identified or not) around 2 billion tonnes. There is no data on the distribution of the global
resources by country. Global baryte reserves amount to 171 million tonnes of Ba content in 2016 (290 million
tonnes of BaSO4 content), mainly located in Kazakhstan (29%), China (13%), Turkey (12%) and India (11%),
accounting in total for more than 65% of global reserves (USGS, 2018).
10In 2016, the world baryte production was 5,372,398 tonnes Ba content according to World Mining Data (WMD,
2019b). The top producer country was China (38%), followed to a lesser extent by India (12%), Morocco (10%)
and Iran (8%), accounting in total for 69% of the global primary supply. The global production data is slightly
higher than USGS and BGS data, but is consistent for the top producer country production; several figures are
estimates in USGS and BGS datasets, including for the main producer countries (BGS, 2018), (USGS, 2016).
In the EU (without UK), baryte resources are located in various countries. The Minerals4Eu project provides
quantified data at country level, but does not provide a complete figure at EU level. The database includes
estimates based on various reporting codes, and non-comparable datasets (e.g. historic estimated, inferred
reserves, etc.) (Lauri, 2018), (European Commission, 2017b). Baryte reserves in the EU are estimated at 13.8
million tonnes, with Bulgaria accounting for up to 5% of global reserves worldwide. Other countries with baryte
reserves are France, Germany, as well as Slovakia and Croatia (Minerals4EU, 2015), (BGS, 2005).
In the EU, the production of primary baryte was located in Bulgaria, Germany and Slovakia (respectively 41%,
40% and 19% of the European production in 2016). Italy was also a producer of primary baryte until 2011
(unknown production since). Natural baryte domestic production amounted to 73 kt Ba in 2016, mainly of high
purity baryte intended to applications other than oil drilling. Among the total EU production, 56 kt Ba was
exported, see
Figure 3 (Export Primary material).
Figure 3. Simplified Sankey diagram for baryte for the year 2016 in the EU (without the UK). Imports of products include also
imports of intermediate products 32 kt Ba.
Input to EU baryte manufacturing mostly came from imports of natural baryte from outside the EU (estimated
at about 213 kt of Ba content in 2016, see
Figure 3 – Imports Primary material). It is considered that there was no use of secondary baryte in EU, whether
from domestic supply or imports of scrap. Imports of barium carbonate (about 32 kt of Ba content in 2016,
included in imports of products in Figure 3), a semi-manufactured material used for instance in chemical
applications, supplemented the input for the manufacturing stage.
The EU manufacturing industry uses barium sulphate and barium carbonate (247 kt of Ba) in the production of
different end-products, a result consistent with the literature (Baryte Association, 2019)1. The main end-use
segments of baryte include the oil and gas well drilling industry (as weighting agent in drilling fluids), the rubber
and plastics industry (as filler application, e.g. for use in vehicles, in soundproofing material, in moulded
components, floor mats, or in paints for its filler properties) and in the chemical industry (in paints for its
brightness and colour, and in glass applications e.g. for electronic devices such as LED glass for TV screens).
Figure 4 shows the distribution by end-use sector of Ba-containing finished products manufactured (pie-chart
on left-hand side) and used (pie chart on right-hand side) in the EU.
1
The Barytes Association indicates that the European consumption is about 600 kt of baryte, i.e. about 353 kt of Ba content, including the
UK, Norway and Turkey.
11Total: 247 kt of Ba Total: 224 kt of Ba
Figure 4. Shares of finished-products containing baryte manufactured in the EU and shares of finished-products containing
baryte used in the EU (taking into account exports and imports of products).
On the basis of the total finished baryte products used in the EU (224 kt Ba) and lifespan distributions assumed
for the main end-use segments of baryte, the European in-use stock and end-of-life stock increased by about
14 kt Ba in 2016 (see Figure 3). The total stock of products in-use was quantified at about 903 kt Ba. The in-
use dissipation amounted to 150 kt Ba in 2016.
From the total amount leaving the use phase (60 kt Ba): 0% effectively resulted in functional recycling in the
EU, about 33 kt Ba were disposed from end-of life products 19 kt Ba were exported for reuse (included in the
exports of products, in Figure 3) and 8 kt Ba were exported for waste treatment (included in the exports of
waste, in Figure 3).
2.3 Indicators
Table 16 summarises recycling and EU self-sufficiency indicators.
There are 58% of Ba in end-of-life products that are collected. However, baryte is not effectively recovered at
the recycling stage, and all collected volumes are therefore sent for disposal (Barytes Association, 2019),
(Ladenberger et al., 2018), (Baryte Association, 2019). (see Table 16) The majority of the uses of Ba are
dissipative and no functional recycling was observed in the EU, leading to an EOL-RIR and EOL-RR of 0%.
Regarding self-sufficiency for Ba the EU demand for primary baryte cannot be met by domestic supply (limited
mine production in the EU) and strongly relies on imports of primary material (natural barium sulphate) and
semi-manufactured material (barium carbonate) from outside the EU. For the extraction stage 58% of the
primary material consumed in the EU comes from domestic extraction. On the other end the EU has an
established manufacturing of Ba products and it is sufficient for filler applications and chemical applications.
For these applications the amount of barytes consumed in the use phase (M3.1) is lower than what is
manufactured in the EU (D1.1), resulting in a self-sufficiency higher than 100%. The EU imports Ba products
but the trade balance is positive.
Table 16. Different indicators that describe the barytes situation in the EU.
Indicator Formula 2016
(G.1.1+G.1.2)/(B.1.1+B.1.2- 0%
EOL-RIR B1.3+C.1.3+C.1.4+C1.8+D.1.3+D1.9+G.1.1+G.1.2)
0%
(G1.1+G1.2+G1.3)/(E1.6+F1.2-F1.1)
EOL-RR
Collection
F1.4/(M4.1+F1.2)
Rate 58%
Self-sufficiency
(B1.1+B1.2)/(M1.1+M1.2)
Extraction 32%
Self-sufficiency
C1.1/M2.1
Processing -
Self-sufficiency
D1.1/M3.1
Manufacturing 111%
122.4 Data sources, assumptions and reliability of results
The main sources of production and trade data are the World Mining Data (WMD, 2019b), the British Geological
Survey (BGS, 2018), (BGS, 2005), the US Geological Survey (USGS, 2018), (USGS, 2016) and Eurostat. Additional
information was gathered from expert network reports in literature such as SCRREEN (Lauri, 2018),
(Ladenberger et al., 2018) and expert communications (Barytes Association, 2019), (WMD, 2019a), (Huxtable
Associates, 2019). Overall, basic extrapolation was applied to primary data to compute reliable estimates of
baryte flows and stock in the EU.
Due to lack of information, some assumptions based on average estimates were made for evaluating the
characteristics of baryte-containing products (lifetime, market share, end-of-life, trade, etc.). For this reason,
higher uncertainty likely affects the estimate of barytes flows at use and end of life. During the workshops
several of the estimates were confirmed or improved, which adds more robustness to the results.
133 Material system analysis of Bismuth
3.1 Value chain
The main primary source of bismuth is recovery as a by- or co-product of lead and tungsten extraction and
processing, and also – more rarely – from tin and copper ores processing (USGS, 2019). It occurs naturally in
the minerals bismuthinite (sulfide), bismutite (carbonate) and bismite (oxide), but is very rarely extracted as
main metal (European Commission, 2020d).
The main production routes of bismuth extraction from lead ores are the electrolytic route or the thermal route,
depending on bismuth content in ores. Bismuth is also extracted from tungsten ores by flotation, although little
information is available on the processes used to recover bismuth after tungsten artisanal or industrial mining
(European Commission, 2020d).
The processing of bismuth into refined metal of a purity at least 99.8% is mainly operated through the thermal
route, while the electrolytic refining is preferred to obtain higher purity, up to 99.999% (pharmaceutical grade)
(European Commission, 2020d). Bismuth is further processed into semi-manufactured products, mainly as
ingots, powders, alloys (such as lead alloys and copper alloys) or chemicals.
The main end-uses of bismuth are in chemical applications: for the pharmaceutical industry and cosmetics, as
well as in pigments, paints or catalysts. Bismuth is also used to a lesser extent in metallurgy: in low melting
alloys, to be used as solder alloys in various sectors (e.g. electric and electronic equipment); and to be
incorporated as additive into steel, aluminium and cast-iron.
The Figure 5 below presents the value chain of bismuth and its main intermediates and end-uses. A consolidated
bismuth industry is established in the EU, with all value chain steps taking place in the region.
Figure 5. Value chain of bismuth.
3.2 Description of the main flows and stocks
Flows and stocks are accounted in mass of bismuth (t Bi) and are representative of the year 2016. The values
presented here are not raw data but aggregated results.
There is no quantitative estimate of global resources of bismuth, which constitutes less than 0.001% of the
Earth’s continental crust. Global bismuth reserves amount to 370 thousand tonnes of Bi content in 2016, mainly
located in China (65%) and Vietnam (14%), accounting together for up to 80% of identified global reserves
(USGS, 2019).
In 2016, the world bismuth production was 10 kt Bi content according to World Mining Data (WMD, 2019b). The
main producer country was China (70%), followed by Vietnam (14%) and Mexico (7%). The data is consistent
with USGS figures, but more than twice higher than BGS figures, due to a gap of the latter for Chinese production
(USGS, 2019), (BGS, 2018).
In the EU (without UK), there is no aggregated estimate of bismuth resources. Bismuth is however considered
to be present in a number of ore deposits in various countries. There are no known reserves of bismuth in other
EU countries than Bulgaria and France, and no quantified data is available for the two countries on current
reserves (Brown et al., 2018).
14In the EU, bismuth is extracted as a by-product of lead and tungsten ores, there is very limited information of
actual volumes of primary bismuth extracted and refined bismuth. Primary bismuth production is estimated at
484 t Bi content (see Figure 6), with most of it not being reported before the processing stage.2
Figure 6. Simplified Sankey diagram for bismuth for the year 2016 in the EU (without the UK).
Input to the EU bismuth processing is considered to be mostly from imported supply, with 857 t Bi content in
2016, i.e. about 60%, imported as primary material (one of the main suppliers being Vietnam) (BGR / DERA,
2019). It is considered that there was no use of secondary bismuth in EU, whether from post-consumer recycling
or imports of scrap.
Production of refined bismuth metal in the EU was estimated to amount to 1,000 t of Bi content3 in 2016 (DERA
/ BGR, 2015) in Belgium, of which only 194 t Bi was exported outside of the EU. Bismuth processing generated
about 429 t Bi in waste, disposed in the EU. Imports of refined bismuth (about 2 172 t of Bi content in 2016)
supplemented the input for the manufacturing stage (see Figure 6). In addition to production of bismuth metal,
there are several smelters of bismuth in the EU processing bismuth lead alloys (with about 7% Bi contained),
for instance in Bulgaria, Germany and Sweden. The production of such alloys varies from year to year, depending
on the market. Although there is no quantified data available on production of refined bismuth in alloys in these
member states, it can be considered that the associated volumes are limited when compared to the reported
1,000 tonnes of Bi metal produced in Belgium.
The EU demand of bismuth (in the form of ingots, pellets, alloys or chemicals) for the manufacturing of end-
products was estimated at about 2 875 t of Bi content for 2016, a result consistent with literature sources
(DERA / BGR, 2015)4. The main end-use segments of bismuth include chemical applications (for instance in the
cosmetic or the pharmaceutical industry, or as pigment in ceramic glaze), low melting alloys applications (e.g.
as solders in electric and electronic equipment) and as metallurgical additives (in aluminium or steel alloys, and
malleable iron).
Figure 7 shows the distribution by end-use sector of Bi-containing finished products manufactured (pie-chart
on left-hand side) and used (pie chart on right-hand side) in the EU.
2
BGS data reports a mine production of bismuth in Bulgaria about 3 t Bi content for the 2012-2014 period (estimated data). This is
consistent with the fact that most of bismuth may not be reported as such during the extraction stage.
3
Data reported for the 2012-2014 period by DERA / BGR, considered consistent for the 2015-2016 period as well.
4
DERA / BGR reports consumption data for 2012 for several countries: 1,000t for Germany, 3,500t for China, 650t for USA, and 630t for
Japan.
15You can also read