To provide a traffic efficiency solution for a road network including a roundabout intersection and a signalised intersection
←
→
Page content transcription
If your browser does not render page correctly, please read the page content below

To provide a traffic efficiency solution for a road
network including a roundabout intersection and
 a signalised intersection

 Nitin Dhir

 A final report submitted in partial fulfilment of the
 requirements for the award of the degree of

 BACHELOR OF ENGINEERING HONOURS

 CIVIL AND STRUCTURAL

 CHARLES DARWIN UNIVERSITY
COLLEGE OF ENGINEERING, INFORMATION TECHNOLOGY AND ENVIRONMENT
 May 2020

Declaration

I hereby declare that the work herein, now submitted as a final report for the degree of
Bachelor of Engineering Honours, Civil and Structural at Charles Darwin University, is the result
of my own investigations, and all references to ideas and work of other researchers have been
specifically acknowledged. I hereby confirm that the work embodied in this final report has
not already been accepted in substance for any degree, and is not being currently submitted
in candidature for any other degree.

 Signature:

 Date: 29 May 2020

 i
Abstract

Keywords: Traffic congestion, Degree of Saturation, Level of Service, SIDRA INTERSECTION 8,
Traffic survey, Road network, Linked signals, Shared lane, Metering signals.

In a modern society, transportation networks support complex economic and social
interactions, making them a major component of our society. Traffic congestion still remains
a major concern in the field of traffic engineering due to an increasing population. Traffic
congestion can be referred as a state in which the traffic flow at a road network is experiencing
high densities and low speeds, consequently leading to negative impacts on society.

A city of Darwin, NT, Australia, is considered as one of the least populated cities. While Darwin
maintains overall satisfactory traffic conditions, newly constructed suburbs and recent
increase in migration has led to a drastic increase of transportation footprint. As a result,
several road networks experience congestion during peak hours (AM and PM). A road network
including two intersections; roundabout and signalised intersection currently experience this
issue. This paper aims to provide a traffic efficiency solution for this network.

Traffic surveys such as traffic volume, queue length surveys were conducted to develop a road
network in SIDRA INTERSECTION 8 with numerous site visits. This software is a micro-analytic
modelling tool that will be used for simulating the results from traffic surveys. The results
suggest that during both AM and PM peak traffic, the two most affected approaches include;
exit north Nightcliff road and Progress drive, where the Degree of Saturation (DoS) was
discovered to be more than the maximum practical DoS and unsatisfactory Level of Service
(LoS).

Diverse intersections were explored in providing a solution to traffic congestion on Progress
drive. An addition of a shared lane on Progress drive ensuring both lanes are allowed to turn
right is one of the possible solutions. Partial signalisation of the roundabout intersection was
also considered however, site restrictions do not allow. While the recommended solution is
to replace the roundabout with linked traffic signals so that signals remain coordinated.

 ii

Acknowledgements
I would like to take the opportunity to acknowledge all those who assisted me throughout my
work. A special thanks to Professor Sabaratnam Prathapan and Afshin Beigi for provision of
the subject, supervision of the thesis as well as the possibility to work on this problem at
Charles Darwin University, and this work would not be completed without their support.

Most of all, I would like to thank my family for their support and help throughout my academic
years.

 iii
Table of Contents
DECLARATION ....................................................................................................................I
ABSTRACT ......................................................................................................................... II
ACKNOWLEDGEMENTS ..................................................................................................... III
LIST OF FIGURES ................................................................................................................ 3
LIST OF TABLES .................................................................................................................. 5
1. INTRODUCTION.......................................................................................................... 6
 BACKGROUND ............................................................................................................................................... 6
 AIM OF RESEARCH .......................................................................................................................................... 7
 OBJECTIVES ................................................................................................................................................... 8
 1.3.1 Primary objectives ........................................................................................................................... 8
 1.3.2 Secondary Objectives ....................................................................................................................... 8

2. SITE BACKGROUND .................................................................................................... 9
3. LITERATURE REVIEW ................................................................................................ 10
 3.1 TRAFFIC FLOW ............................................................................................................................................. 10
 3.2 TRAFFIC CAPACITY ........................................................................................................................................ 11
 3.3 LEVEL OF SERVICE......................................................................................................................................... 13
 3.4 DEGREE OF SATURATION ............................................................................................................................... 15
 3.5 TRAFFIC CONGESTION ................................................................................................................................... 15
 3.6 TRAFFIC EFFICIENCY ...................................................................................................................................... 16
 3.7 TIME OF DELAY ............................................................................................................................................ 16
 3.8 EMISSION OF CO2 AND COSTS ........................................................................................................................ 17
 3.9 TRAFFIC SPEED AND SPEED LIMITS .................................................................................................................... 18
 3.10 ROAD USERS ........................................................................................................................................... 20
 3.11 ROUNDABOUTS ....................................................................................................................................... 21
 3.11.1 Number of legs and lanes ......................................................................................................... 22
 3.11.2 Central Island ............................................................................................................................ 22
 3.11.3 Approach and Entry Geometry ................................................................................................. 22
 3.11.4 Design Principles ....................................................................................................................... 23
 3.11.5 Safety concerns on roundabouts ............................................................................................... 23
 3.11.6 Travel way Characteristics ........................................................................................................ 25
 3.12 LIMITATIONS AND POTENTIAL SOLUTIONS ..................................................................................................... 26
 3.12.1 Increased traffic volume ........................................................................................................... 26
 3.12.2 Dominant flow .......................................................................................................................... 27
 3.13 ROAD PAVEMENT .................................................................................................................................... 28
 3.14 ROAD NETWORK ..................................................................................................................................... 29
 3.15 TRAFFIC SURVEY...................................................................................................................................... 30
 3.15.1 Traffic Volume survey ............................................................................................................... 31
 3.15.2 Queuing survey ......................................................................................................................... 31
 3.16 PREVIOUS STUDIES ................................................................................................................................... 32
 3.16.1 Effects of Pedestrian Impedance on vehicular capacity ............................................................ 32
 3.16.2 The Clearwater Beach Entryway Roundabout .......................................................................... 34
 3.16.3 A Two-lane T-intersection Roundabout .................................................................................... 36

4. PRACTICAL APPROACH ............................................................................................. 38
 4.1 APPROACH.................................................................................................................................................. 38
 4.1.1 Site visit .......................................................................................................................................... 38
 4.1.2 Traffic survey ................................................................................................................................. 38
 4.1.3 Traffic modelling ............................................................................................................................ 39
 4.2 SIDRA INTERSECTION 8 ............................................................................................................................ 40

 1|P a g e
4.2.1 Inputs ............................................................................................................................................. 41
 4.2.2 Measurement of inputs ................................................................................................................. 44
 4.2.3 Calibration and Validation ............................................................................................................. 44
 4.2.4 Outputs .......................................................................................................................................... 45

5. SITE OBSERVATIONS ................................................................................................ 47
6. SIDRA MODELLING METHODOLOGY AND RESULTS ................................................... 50
 6.1 ROUNDABOUT BASE MODEL ........................................................................................................................... 50
 6.2 TRAFFIC SIGNAL INTERSECTION ........................................................................................................................ 52
 6.3 AM PEAK BASE NETWORK MODEL.................................................................................................................... 53
 6.4 PM PEAK BASE NETWORK MODEL .................................................................................................................... 55

7. DISCUSSION ............................................................................................................. 57
8. POSSIBLE SOLUTIONS ............................................................................................... 62
 8.1 SHARED ROUNDABOUT LANE .......................................................................................................................... 62
 8.2 LINKED TRAFFIC SIGNAL INTERSECTION .............................................................................................................. 64
 8.3 METERING SIGNALS ...................................................................................................................................... 68

9. RECOMMENDED SOLUTION ..................................................................................... 70
10. CONCLUSION........................................................................................................ 71
APPENDIX A: VEHICLE CLASSIFICATION ............................................................................ 73
APPENDIX B: RAW TRAFFIC VOLUMES ............................................................................. 75
APPENDIX C: PROJECTED FUTURE TRAFFIC VOLUMES ...................................................... 77
REFERENCES .................................................................................................................... 78

 2|P a g e
List of Figures
Figure 1.1: Conflicting intersection manoeuvres (University of Southern Queensland Australia
, 2013) ......................................................................................................................................... 7
Figure 1.2: Conflict points (University of Southern Queensland Australia , 2013) .................... 7

Figure 2.1: Nightcliff Road and Progress Drive roundabout intersection (Photo by Nitin Dhir) 9
Figure 2. 2: Site location ............................................................................................................. 9

Figure 3.1: LoS A, Free flow with high speeds and low flows. This allows drivers to travel at
their desired speeds with little interference. 14
Figure 3.2: LoS B, Moderate design flows with reasonable freedom to select their speed. 14
Figure 3.3: LoS C, drivers are restricted to a speed however still travel at an optimum speed.
 14
Figure 3.4: LoS D, Tolerable capacity 14
Figure 3.5: LoS E, Close to the actual capacity of the road with momentary stoppages. 14
Figure 3.6: LoS F, Demand exceeds capacity, with excessive queues and delays. 14
Figure 3.7: Distance verse time for traffic flow through signal-controlled intersection
(Gartner, 2013) 17
Figure 3.8: Geometric elements of roundabout (Austroads, 2015) 21
Figure 3. 9: Recommended distances for metering signals (Akçelik, 2011) 27
Figure 3.10:Road cross section of a flexible pavement structure 28
Figure 3.11: Road cross section of a rigid pavement structure 28
Figure 3.12: 100% yield 33
Figure 3.13: 0% yield 33
Figure 3.14: PHB treatment 34
Figure 3.15: Nine intersections prior to roundabout upgrade. 35
Figure 3.16: Roundabout upgrade 35
Figure 3.17: T-intersection roundabout with shared approach lanes and two-lane circulating
road. 36
Figure 3.18: T-intersection roundabout with single-lane circulating road 36

Figure 4.1: Lane Geometry dialogue in SIDRA (Government of South Australia, 2017) .......... 42

Figure 5. 1: Traffic at signals up to roundabout intersection ................................................... 47
Figure 5. 2: Traffic at east Trower road turning right at signals ............................................... 47
Figure 5. 3: Inappropriate method of pedestrian crossing ...................................................... 48
Figure 5. 4: Traffic at north Nightcliff road ............................................................................... 49

Figure 6.1: Roundabout site layout 50
Figure 6.2: Geometrical parameters 50
Figure 6.3: SCATS data provided by DIPLE 50
Figure 6.4: Roundabout calibration 51
Figure 6.5: Traffic signal intersection layout 52
Figure 6.6: Phasing of signalised intersection 52
Figure 6.7: Phasing movements indications 53

 3|P a g e

Figure 6.8: Network configuration 53
Figure 6.9: Network site layout 53
Figure 6.10: Traffic volumes of AM peak network 54
Figure 6. 11: Movement summary of roundabout intersection for AM peak 54
Figure 6.12: Movement summary of signalised intersection for AM peak 55
Figure 6. 13: Traffic volumes of PM peak network 55
Figure 6.14: Movement summary of roundabout for PM peak 56
Figure 6.15: Movement summary of signalised intersection for PM peak 56

Figure 7.1: Lane by lane analysis of AM peak........................................................................... 58
Figure 7.2: Network analysis of AM peak ................................................................................. 58
Figure 7.3: Lane by lane analysis for PM peak ......................................................................... 59
Figure 7.4:Network analysis for PM peak................................................................................. 59
Figure 7.5: Projected roundabout performance in 10 years .................................................... 60
Figure 7.6: Projected signalised intersection performance in 10 years ................................... 61

Figure 8.1: Shared lane roundabout on Progress drive............................................................ 62
Figure 8.2: Shared lane roundabout performance in 2030 ...................................................... 63
Figure 8. 3: Traffic signals performance in 2030 ...................................................................... 63
Figure 8.4: Pedestrian crossing in case of a slip lane at signalised intersection ...................... 65
Figure 8.5: Network layout of two linked traffic signals .......................................................... 66
Figure 8.6: Signalised intersection on Nightcliff road and Progress drive intersection ........... 66
Figure 8.7: Route 1- Trower road to Nightcliff road ................................................................. 66
Figure 8.8: Route 2- Nightcliff road to Trower road ................................................................. 66
Figure 8.10: Trower road signals performance in 2030 ........................................................... 67
Figure 8.9:Proposed signals performance in 2030 ................................................................... 67
Figure 8. 11: Benefits from metering signals............................................................................ 68
Figure 8. 12: Signalised intersection performance ................................................................... 69
Figure 8. 13: Metering signals roundabout performance ........................................................ 69

Figure 9. 1: Network performance of linked signals in year 2030 ........................................... 70

Appendix A.1: Vehicle Classification system (Austroads, 2006) 73
Appendix A.2: Austroads 12-bin vehicle classification system 74

 4|P a g e

List of Tables
Table 3.1: Volume-Capacity Ratio ............................................................................................ 13
Table 3.2: Typical posted speed limits (km/h) (Austroads, 2016) ............................................ 19
Table 3.3: Vehicle classification by length (Austroads, 2006) .................................................. 20

Table 4.1:Key elements of model calibration (MainRoads Western Australia, 2018) ............. 44
Table 4.2: Maximum practical degree of saturation (Government of South Australia, 2017) 46

Table 5. 1: Site observations..................................................................................................... 49
Table 5. 2: Queue lengths ......................................................................................................... 49

 5|P a g e

1. Introduction
 Background

Congestion is one of the major problems in people’s daily lives, especially in cities with large
population. In extreme circumstances, people are forced to take different travel routes to
avoid traffic congestion. Darwin is considered Australia’s least congested city due to its small
population. Despite being the least congested, according to Australian Automobile
Association, Darwin experiences worse congestion during the AM peak hours compared to the
PM peak hours. In terms of the delay, Darwin North to CBD route had the worst increase travel
time with an average of 1.2 minute increase in AM peak hours from 2013 to 2018, similarly,
Wagaman to CBD also had an increase average time of 1.0 minute. Furthermore, average
speed decreased by 4.8% for the route from Airport to CBD, this is critical as airport routes
can directly affect the productivity of a city and unreliable travel to airports compromises
access to key market and redistricts economic growth (Australians Automobile Association ,
2018).

These delay facts demonstrate that the current traffic conditions are not desirable for a
relatively small population of Darwin. Therefore, actions must be taken to improve the traffic
efficiency as Darwin being the capital city of the Northern Territory containing approximately
60% of the territory’s population. According to Australian Bureau of Statistics, Darwin’s annual
growth rate is 2.6% since 2006 census and 1.68% in 2018 with a population of 150,880. Due
to the increase in the population, the current traffic network must be evaluated to meet the
increased traffic demand (Population Australia , 2019). Since the population of Darwin is
increasing consistently over the years, the traffic condition will eventually deteriorate and
result in poor traffic efficiency if no changes are implemented to the current conditions.

Traffic efficiency refers as to what extent can a facility meet the travel demand of the road
users. It can be affected by several factors including the road geometry, environmental factors
as well as human judgement. In general, an intersection is known to have the least efficiency
due to increase traffic volume as well as number of conflict points. Conflict points are points
at an intersection when a road user is crossing, merging, or diverging, oppose another road
user.

 6|P a g e
Figure 1.1: Conflicting intersection manoeuvres (University of Southern Queensland Australia , 2013)

To improve the traffic efficiency, number of conflict points at an intersection must be kept to
a minimum where possible. Roundabouts are known to have the least conflict points of only
8 whereas, a T-intersection has 9 conflict points and a cross-intersection has over 32
intersection points.

 Figure 1.2: Conflict points (University of Southern Queensland Australia , 2013)

Not only does the roundabout significantly reduces the conflict points, its features such as the
as central island and the approach geometry provides speed reduction which makes
roundabouts one of the safest intersections. In terms of efficiency, roundabouts are
dependent on the geometric design where an inappropriate design can lead to congestion
issues and hence result in potential incidents for the road users.

 Aim of Research
The aim of this paper is to provide a traffic efficiency solution to a road network including; a
roundabout and a signalised intersection. The focus remains on design principles such as
geometric changes and treatments to improve the overall efficiency of all road users. Site
observation, traffic surveys, and SIDRA INTERSECTION modelling software will be used to
check the traffic conditions and previous studies will also be reviewed to propose possible
improvements. Safety of all road users will be the priority in any proposed improvement.

 7|P a g e
Objectives

The objectives of this thesis paper have been outlined below:

1.3.1 Primary objectives
 a) To understand a roundabout intersection design and further evaluate it in terms of
 reduction of traffic delays.
 b) To understand the current traffic condition (congestion) of the selected intersection
 (Nightcliff Road and Progress Drive).
 c) To assess and classify the suitable designs for the intersection according to the
 features and analyse the traffic efficiency of the intersection by using intersection
 modelling software (SIDRA).
 d) By comparing traffic efficiency, determine the most appropriate design for improving
 the traffic efficiency.
 e) To understand a traffic network and explore potential future development for
 intersection design to relieve the traffic congestion.

1.3.2 Secondary Objectives
 a) To determine appropriate intersection design in the different condition of traffic
 volume.
 b) To explore whether the traffic efficiency of the intersection design can be improved by
 combination of control methods
 c) To determine the types of intersection design that are suitable for multiple control
 methods.
 d) Provide findings that apply to similar issues at an intersection.

 8|P a g e
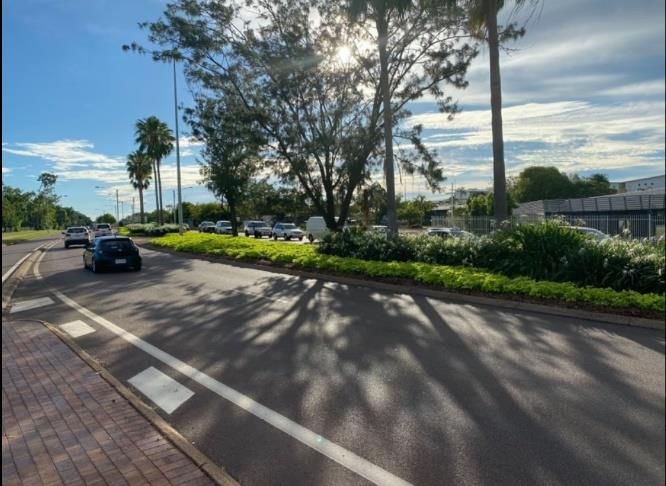
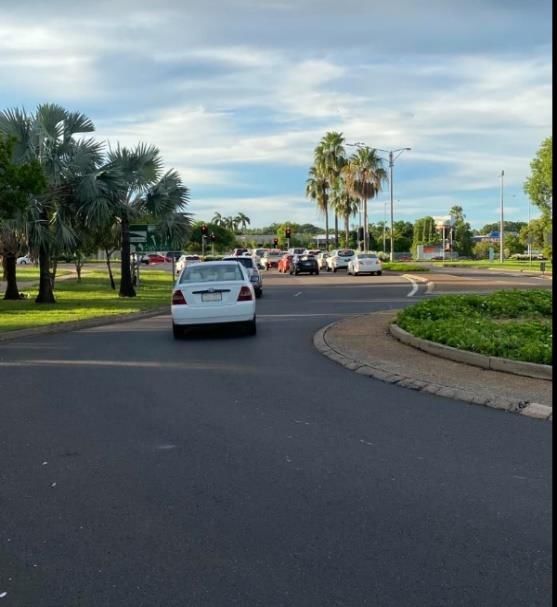
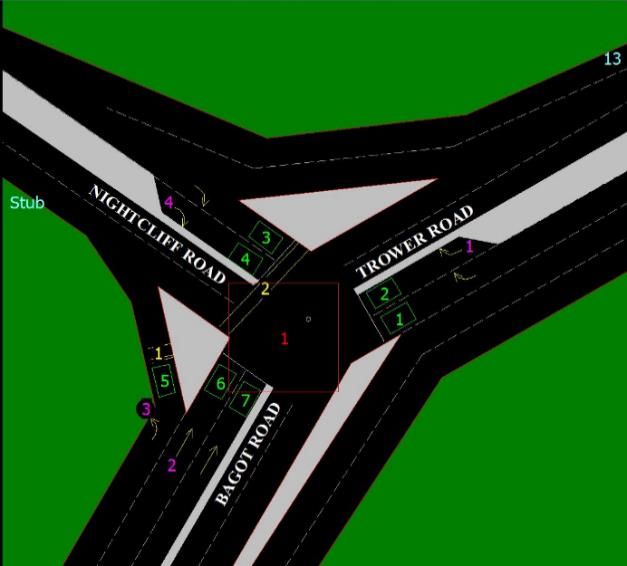
2. Site Background
Nightcliff Road and Progress Drive are two primary collector roads that delivers the important
links for the suburbs of Nightcliff and Rapid Creek to the Darwin arterial road network. These
two roads currently intersect at a roundabout in very close proximity to the signalized
intersection of Nightcliff Road and Trower Road. This means some issues may appear in these
intersections due to large traffic volume. The large traffic volume induces greater traffic
pressure, which results in increased waiting time, increased possibility of potential accidents
and difficulty to access the road for other road users than vehicles. Furthermore, there are
number of schools, within the suburb of Nightcliff and Rapid Creek and particularly during
school pick-up and drop-off times, this intersection is congested. Traffic can bank up along
Nightcliff Road and Progress Drive which causes delays. Furthermore, unbalanced flows on
the roundabout, primarily because of the nearby signalised intersection sending traffic in
platoons, exacerbate the situation. Therefore, the current design of this network will be
evaluated to improve the traffic efficiency.

 Figure 2.1: Nightcliff Road and Progress Drive roundabout intersection (Photo by
 Nitin Dhir)

 Figure 2. 2: Site location

 9|P a g e
3. Literature Review
3.1 Traffic flow

Traffic flow is one of the complex and a fundamental phenomenon that has been studied
extensively in transportation engineering. Through studies it was determined that traffic flow
is concerned with the movement of individuals around a network. These units are not only
limited to movement of traffic indicated by vehicles but also concerns all the road users such
as pedestrians and cyclists.

Traffic flow can be divided into two categories: uninterrupted flow and interrupted flow.
Uninterrupted flows are flows in a traffic stream which are not interrupted by external
controls such as traffic lights and stop and yield signs. A prime example of an uninterrupted
flow would be a freeway as it consists interactions among the vehicles and with the road
environment. Most of the road interactions in urban roads fall under the category of
interrupted flow facilities. To analyse the traffic stream, traffic stream behaviour must be
considered as roads consist of interactions between drivers, vehicles and with the road
environment itself. To understand the traffic stream behaviour, transportation professionals
developed macroscopic and microscopic parameters (Lester A. Hoel, 2011). In macroscopic
approach, the traffic flow is considered in a cumulative sense and makes use of the physical
analogies to traffic flow such as heat flow and fluid flow. A relationship of the traffic flow has
been shown:
 =
Where:

 ℎ ℎ ℎ ℎ
 /ℎ
 ℎ ℎ/
 ℎ ℎ /ℎ

The flow rate can be calculated by determining the distance between two points and recording
the number of passing vehicles and time intervals. In general, this is achieved by observing the
numbers of vehicles at a certain period of time and between selected points.

 10 | P a g e
Where the macroscopic approach considers traffic in a cumulative sense, microscopic
approach considers the response of each vehicle individually and studies the behaviour of the
individual driver on vehicle movement. The two main parameters for microscopic approach
include Headway (h) which refers to the difference in time taken by the front of the vehicle to
pass a point and time the following vehicle takes to reach the same point and Spacing (d)
which refers to the distance between the front of the two vehicles following each other (Lester
A. Hoel, 2011).

3.2 Traffic Capacity
Before understanding the concept of traffic capacity, one must understand what is meant by
traffic volume. Traffic volume is referred as the number of vehicles on road network and is a
measure of quantity. Traffic volume on a specific section of the facility can vary significantly
between peak and non-peak hours, days, and seasons. Traffic demand patterns are crucial
particularly in Darwin where there is a large tourist demand in the dry season. To measure
traffic volumes following parameters are often employed:

Average Daily Traffic (ADT): It represents the total number of vehicles in a certain period (less
than a year) divided by the number of days in the period. It is often used for specific time
period during a year for purposes relating to that time period to represent short-term
performance.
Average Annual Daily Traffic (AADT): Like ADT, except the fact that it is the total volume of
traffic for the entire year divided by the number of days in the year. AADT often represents
the long-term performance and useful for future development (Department of Transport and
Main Roads, 2004).
ADT and AADT are used in:
 • Assessing annual usage
 • Aids in strategic link analysis
 • Justifying expenditure of funds on projects
 • Designing structural elements of the road such as pavement

 11 | P a g e
Capacity analysis addresses one of the most important questions as to how much traffic a
given facility can accommodate under a given operating conditions. To do so one develops set
of models or analytical equations that relate to flow levels, geometric parameters,
environmental conditions, and control strategies. These analytical models allow to determine
the maximum traffic-carrying capacity of a facility and the expected quality or level of service
at different flow levels.

According to The Highway Capacity Manual (HCM) capacity is defined as following:
“The capacity of a facility is the maximum hourly rate at which persons or vehicles can
reasonably be expected to traverse a point or a uniform section of a lane or roadway during a
given time period under prevailing roadway, traffic, and control conditions.” (Lester A. Hoel,
2011)

It should be noted that this definition covers a great range of situations on the road. Firstly, it
defines the capacity as either vehicles or persons. The capacity of the roads for example will
be defined as vehicles on the other hand for transit or pedestrian facilities the capacity will be
expressed as persons. Secondly, the definition specifies the capacity for a point or a uniform
section on a given facility. Geometrical characteristics, the class of vehicles using it and any
control condition such as traffic signals vary the capacity of facility. Therefore, capacity can
only be defined for a uniform section where factors affecting the capacity remain unchanged.
Moreover, the definition uses the work reasonably which implies that the capacity could vary
from one location to another or from day to day for a given facility. This further implies that
the analysis conducted by HCM does not use the highest recorded values for capacity analysis
but, rather a flow level that can reasonably be achieved repeatedly on a given facility (Lester
A. Hoel, 2011).

Traffic volume is generally used to indicate the level of congestion on a facility. Since, traffic
volume only refers to the number of vehicles on a road network, it does not give a direct
indication of traffic volume with respect to the facility’s capacity. Therefore, a combination of
traffic volume and capacity know as volume-capacity ratio, have been developed to allow
engineers to check the level of congestion. It represents how much of the facility’s capacity is
being utilised by the demand. A table has been constructed below to outline what various
volume to capacity ratio indicate on a facility.

 12 | P a g e
V/C ratio Description
 1.0 The demand exceeds the designed capacity of the facility.
 Excessive delays and queue are predicted.
Table 3.1: Volume-Capacity Ratio

A v/c ratio between 0.85-0.95 is generally used for the peak hour for design purposes.
Overdesigning should be avoided as it can have negative impact to pedestrians associated
with streets with wider crossing, and the potential for speeding and land use impacts and cost
(Federal Highway Administration Research and Technology, 2004). Volume and capacity ratio
can be determined simply by dividing the current demand by the capacity of the facility.

3.3 Level of Service
It is not viable to only determine the maximum number of vehicles, or pedestrians that a
facility can accommodate, but also an equal interest of quantifying the quality or the level of
service in terms of measure of delay such as speed, trip time, interruptions, safety, and ability
to manoeuvre etc. Level of service is the direct function of the flow or usage level on the
facility. For instance, on road facility, when there are only few vehicles on the road, drivers
usually tend to travel at the speed they desire with consideration to the conditions and
geometric conditions of the road. When the traffic volume tends to increase, the gap between
the vehicles starts to reduce, and congestion starts to develop. Congestion can be anywhere
from severe speed reduction to a complete gridlock where the vehicles speed approaches zero
(Lester A. Hoel, 2011). According to the Department of Main Roads, level of service (LoS) has
been assigned letters A to F for describing traffic flow conditions, with A being the best
possible condition and LoS F being the worst. To understand the differences between the level
of service, Department of Main Roads has developed images with explanations which
illustrates these differences more clearly (Department of Transport and Main Roads, 2004).

 13 | P a g e
Figure 3.1: LoS A, Free flow with high speeds Figure 3.2: LoS B, Moderate design flows with reasonable freedom
 and low flows. This allows drivers to travel at to select their speed.
 their desired speeds with little interference.

 Figure 3.3: LoS C, drivers are restricted to a speed however still travel at
 an optimum speed.

 Figure 3.4: LoS D, Tolerable capacity

Figure 3.5: LoS E, Close to the actual capacity of the road with momentary
stoppages.

 Figure 3.6: LoS F, Demand exceeds capacity, with excessive
 queues and delays.

 14 | P a g e
3.4 Degree of Saturation

Degree of saturation just like volume-capacity ratio, as it is a measure of how much demand
is a facility experiencing compared to its total capacity. A value of 100% indicates that the
demand to equal to the capacity of the facility and no further traffic intake is possible. Values
over 85% suggests that a facility is suffering from traffic congestion, with queue of vehicles
beginning to form (Government of South Australia , 2017).

3.5 Traffic congestion
Traffic congestion has become the plague of modern society in large cities. It remains a major
issue in traffic engineering which still requires more work to understand and resolve. Through
extensive research, traffic congestion has been classified into three main categories: demand
capacity related, delay-travel time related and, cost related. Since, this paper aims to reduce
traffic congestion at a certain period, demand and capacity related approach is used to explain
the term traffic congestion. According to Bovy and Salomom, 2002, traffic congestion is a state
at which the traffic flow at a facility is experiencing high densities and low speeds, relative to
some chosen reference state typically with low densities and high speeds (Aftabuzzaman,
2007).

The main cause of congestion is that the traffic volume is too close to the facility’s maximum
capacity. In one way, congestion can be thought of as road traffic growing faster than the road
capacity. This is not a temporary problem as congestion will only increase in the absence of
measure to reduce traffic. From day to day, traffic congestion has proven to affect he economy
and people’s daily lives. A study conducted by Richard Arnott and Kenneth Small illustrated
that cost of driving is quantifiable. The research showed that drivers would willingly pay on
average of $1.33 to save 10 minutes travel time, $8.00 per hour in United States (Small, 1994).
Additionally, a study conducted by Kent Hymel on effects of traffic congestion on employment
growth, provides robust evidence that congestion decreases subsequent employment growth.
Also, that the dampening effect on growth are non-linear and more intense in highly
congested places. Moreover, the study also found that congestion has a broad negative
impact on economic growth (Hymel, 2008).

 15 | P a g e
Traffic congestion can also be thought of as a negative traffic flow, where traffic condition is
highly inefficient. Researchers have divided congestion into two distinguish categories:
recurrent and nonrecurrent. Recurrent refers to congestion where the general demand
exceeds the capacity, whereas nonrecurrent refers to conditions caused by arbitrary events
such as weather conditions, ongoing construction or any collisions. This thesis will also
investigate recurrent congestion as it uses peak hour event such as morning and evening event
that cause temporary confined impacts on system performance (Sweet, 2011). A research on
road accidents and traffic flow shows that accidents vary significantly with traffic flows and
later determining a proportional relationship between them (ANDREW DICKERSON, 2000).

3.6 Traffic efficiency
Traffic efficiency is described as to what extent can a facility meet the travel demand of the
road users. It is the main factor that determines the scale of transportation supply and the
relationship between supply and demand of the transportation system (Evangelia Gaitanidou,
2012). In this context the term “road users” refers to vehicles, pedestrians and cyclists. By
determining the traffic efficiency of a facility, one can comment on whether the traffic supply
is sufficient or not. A low traffic efficiency indicates that congestion is likely to occur at a
particular section or at an intersection of a facility which further indicates inappropriate design
or that the facility has experienced major growth after the last modification was implemented.
Traffic efficiency is measured by observation and traffic data obtained by conducting traffic
survey. Time of delay, emission, and cost are some of the main factors that are often used to
assess the performance of traffic efficiency at specified section of a facility.

3.7 Time of delay
Delay appears to be a simple and a well understood concept and is taken to be a name for
wasted time on a journey. However, it attempts to compute as a measure of performance of
a transportation facility. From the road users’ point of view delay is the wasted time which
differs from the researchers. To pursue these differences, a research on The Concept of Delay,
discovered that delay plays no part in the process of economic appraisal. It is the saving in
journey time which accounts for about 80% of the benefits, savings in accidents costs account
for most of the remaining 20% according to the Department of the Environment. However,
many aspects of the performance of traffic network, including delay are useful measures of
performance excluding cost-benefit. One measure includes the number of stop per unit length

 16 | P a g e
of journey. Having to stop numerous times can cause frustration and hence a performance
indicator. Another performance measure is the noise of acceleration, which is difficult to
measure. Frequent changes in the speed reduce the comfort of journey and acceleration noise
also provides an objective measure of the journey quality. According to Highway Research
Board Bulletin, delays can be categorised into network delays and operational delays. Network
delays refer to the losses associated with stopping at intersection etc. On the other hand,
operation delays are the losses which arise from vehicles interaction. Overall, delay occurs
due to the existence of driver frustration which converts loss of time into delay. Therefore,
delay can be defined as unwanted journey time (TILLOTSON, 1981). Figure 3.7, indicates the
time lost at a signalised intersection.

 Figure 3.7: Distance verse time for traffic flow through signal-
 controlled intersection (Gartner, 2013)

3.8 Emission of CO2 and Costs
Emission of 2 is another measure of traffic efficiency. Due to increase in population as well
as vehicle ownership, frequency of making trips have increased significantly. Furthermore,
traffic congestion is another issue which assists in increase 2 emission as vehicles spend
most of their time on the road and hence their journey time increase and as a result, several
environmental issues such as greenhouse gases have risen (Shashank Bharadwaja, 2017).
Travel route is also another factor to increase emission rates, as during peak hours, people
tend to choose a travel route which is least congested or has higher traffic efficiency even if
the route is longer. Longer route indicates more fuel consumption indicating more fuel costs

 17 | P a g e
and hence more emissions. According to the Environment Protection Agency, transportation
sector is one of the largest productions of greenhouse gas emission and hence transportation
system should be focused on making it more environmentally sustainable. Research
conducted have demonstrated that 56 billion pounds of additional 2 was produced due to
lower vehicles speed under congested conditions. Moreover, traffic lights which is a key
element in the urban transportation creates speed variation and stops for vehicles.

These speed fluctuations and stops were noted too sensitive to vehicle fuel consumption rate,
especially when it comes to aggressive acceleration rates after the stops. As a result, not only
significant emissions are generated but also costs for users also increases. One of the methods
that can be implemented to minimise emission is to optimise their travel route as they pass
through an intersection. This includes designing the signal timing at an intersection that allows
large percentage of the traffic volume to drive through with minimum acceleration or
deceleration and stops (Alvaro J. Calle-Laguna, 2019).

3.9 Traffic speed and speed limits
Speed of the existing road dictates the traffic flow of the facility as it relates to safety, time,
comfort, convenience and economics. Speed in general can be referred to as the travelling
distance over travelling time and is measured in meters per seconds (m/s). According to the
speed studies conducted, speeds can be categorised into the following (Office of Highway
Information Management , 1998):

 • Spot speeds: Refers to the instantaneous speed of a vehicle at a specific point on a
 facility.
 • Running speed: This is the average speed of the vehicle while it is actually in motion. It
 excludes the time of the journey in which the vehicle suffers delay.
 • Overall speed: It is the speed that a vehicle covers between two terminals including all
 the delays.
 • Time-mean speed: Associated with an average speed with single point along a facility
 over specified period of time.
 • Space-mean speed: It is average speed of all the vehicles passing at a specific location
 on a facility

 18 | P a g e
Traffic speed is often controlled by speed limits posted along the length of a facility. Speed
limit refers to the legal speed that a driver must not drive over. The purpose of speed limits is
to maximise safety for all road users as well as to reflect the characteristics of the facility such
as role and function of the road, type of road users, abutting land and access, road geometry,
hazards that might be present and crash history. Speed limits posted on the road can be on
temporary basis (due to the on-going construction) as well as permanent depending on the
facility (Austroads , 2008).

Operation speed also known as the 85th percentile speed is speed at which the roads are
designed for. It refers to the speed at or below which 85% of the vehicles are observed to
travel under free-flowing conditions while the remaining 15% of the vehicles exceed their
speed. Vehicles who exceed their speed are prone accidents and to increase risk safety they
are expected to maintain a higher level of alertness (Austroads, 2016).

The table below provides typical posted speed limits in km/h as a rough indication, factors
discussed earlier in this chapter must be considered prior of implementing these at a facility.

Table 3.2: Typical posted speed limits (km/h) (Austroads, 2016)

 19 | P a g e
3.10 Road users
The term “Road users” as defined in the earlier chapter of this paper refers to everyone who
uses the road. This includes vehicles, cyclists, and pedestrians. Since, vehicles are the majority
of the road users, according to Austroads 2016, the following classification system by vehicle
length has been adopted and categorised into four different groups.

Table 3.3: Vehicle classification by length (Austroads, 2006)

Additionally, these four classifications have been further broken down into 12-bin vehicle
classification system to allow for more detail and clarity (refer to the appendix A).

 20 | P a g e
3.11 Roundabouts
Roundabouts are a common type of unsignalised intersection which allow traffic flow to be
operated freely, and entirely based on traffic regulations. Certain give-way rules and road
signage are used to explain and indicate the road users of priority of accessing the roundabout
and to ensure that conflicts can be minimised and decrease the amount of collisions. Each
roundabout contains a circular island in the centre of the intersection and circulating lane
along the circular island. While following the usual give-way rule, vehicles about to enter the
roundabout also must give-way to the vehicles which are already in the circulating lanes.
Roundabouts can be designed in different shapes such as 3-leg and 4-leg roundabout
depending on the traffic volume and geometry constrains. This paper will focus on a 3-leg
roundabout which contains three approaches and exits with one or more circulating lanes. A
figure below illustrates a typical roundabout and its geometrical elements (Austroads , 2015).

 Figure 3.8: Geometric elements of roundabout (Austroads, 2015)

The major components in geometric design in roundabouts have been discussed according to
Austroads 2015, 4B:

 21 | P a g e
3.11.1 Number of legs and lanes
One of the primary reasons for using a roundabout intersection is because it significantly
reduces the number of conflict points. A single-lane roundabout can operate satisfactorily
with more than four legs. However, legs at angles should be avoided for a multi-leg
roundabout as it can create conflicts at exits and thus increase the likelihood of a collision.
Furthermore, the number of roundabout lanes provided should be checked to ensure that it
achieves the desired capacity and operating requirements for the future traffic volumes.
Circulating lanes are generally kept as two for safety considerations and must be equal to or
greater than the entry lanes on that approach. Entry lanes are dictated by the capacity or the
level of service on that approach and can be determined by capacity analysis. The number of
exit lane must not be greater than the number of circulating lanes. Additionally, left turn slip
lanes can be extremely beneficial when significant traffic volume is turning left. This can
possibly also avoid the need for an additional entry lane (Austroads , 2015).

3.11.2 Central Island
Central island can take the shapes of circular, elliptical, oblong or other shapes to suit unusual
site conditions, however, circular is preferred. When considering shapes other than circular,
different circulation speed for different section of the carriageway will be required. Central
island is raised on flat terrain and when the size of the roundabout is greater than 20-25m
diameter to ensure that drivers can recognise that they are approaching a roundabout and to
improve visibility of the island. It should be made sure that the roundabout is not excessively
large as it can promote high entry or circulating speeds and therefore the size should be large
enough to achieve the desired geometry (Austroads , 2015).

3.11.3 Approach and Entry Geometry
Approach and entry treatments are one of the most important geometric parameters for
roundabouts as they influence the entry speed of the traffic and consequently the safety
performance of the roundabout. Controlling the entry speed of the traffic minimises rear-end
type crashes and potential risk to pedestrians and cyclists. Roundabouts achieve this by
including a raised median island on the approach and a kerb along the left side and together
with the approach alignment create a physical restriction that slows the drivers. Successive
reverse curves treatments are implemented with approaches for high speed of greater than
80km/h. It significantly reduces the traffic speed by 20km/h. Blisters on the other hand are

 22 | P a g e
executed in low-speed areas and involve the extension of the kerb to create entry curvature
(Austroads , 2015).

3.11.4 Design Principles
Now that the geometrical parameters have been covered, there are several design principles
that should be applied to achieve a safe and efficient roundabout. According to Austroads
2015 4B, these are as following:

 • The most important design principle is providing drivers with sufficient approach sight distance
 in advance of approaching the roundabout.
 • To limit the entry speed, appropriate entry curvature should be implemented.
 • Entry speed should be adopted after considering all road users such as pedestrians and cyclists.
 • Exits should be designed in a way that all vehicles depart efficiently.
 • To avoid overlapping, the inscribed circle diameter must be large enough to accommodate all
 entries and exits to an appropriate standard.
 • Swept path analysis of the vehicles should be conducted to ensure that the width of circulating
 roadway is sufficient. Clearance to kerbs should also be provided for both through movements
 and right-turn movements.
 • To ensure that the roundabout operates at a satisfactory level of service, sufficient circulating
 and exit lanes must be provided.
 • For vehicles approaching the roundabout, sufficient visibility should be present so that they
 are able to see both circulating traffic as well as potentially conflicting traffic from the other
 approaches so that they can enter the roundabout safely.

3.11.5 Safety concerns on roundabouts
Numerous before and after type studies have established that in general, few motor vehicle
accidents resulting in casualty crashes occur at roundabouts when compared to other types
of intersections such as traffic signals, stop, or give-way signs. Thus, according to Austroads
2015, a well-designed roundabout is known to be the safest form of intersection control.
Lower speeds at the roundabouts is the primary reason for the improved safety. On the other
hand, safety aspects for pedestrians and cyclists are of concern at a roundabout intersection.
This is because roundabouts do not give priority to pedestrians over through or right-turning
traffic, and results is reduction in accessibility for pedestrians. While several treatments that
can be implemented at roundabout intersection for pedestrians and cyclist, it is not

 23 | P a g e
recommended to utilise a roundabout intersection where high level of cycle and pedestrian
traffic is expected (Austroads , 2015).

3.11.5.1 Pedestrians and Cyclists
The main issue for pedestrians is that they are unable to cross the road due to the traffic
coming in several directions at a roundabout intersection. As a result, stage crossing is often
implemented for a safer crossing as the size of the roundabout intersection is quite large.
Generally, installation of spitter island of sufficient size to hold and protect pedestrians allows
them to cross only one direction of traffic at a time. Where there is higher pedestrian volume
across one leg of an intersection compared to moderate to low pedestrian volume on the
other approaches, it may be appropriate to install signalised pedestrian crossing. This must
consider the traffic analysis and safety issues. Some of methods that will improve the level of
service and safety of pedestrians have been discussed below (Austroads Sydney , 2017):
 • Provision of pedestrian crossing on approaches
 • Crossing designed for disability
 • Crossing should be oriented to provide pedestrians to have a straight travel path across
 the road by the shortest route.
 • The location of the crossing on the approaches should be 6-12m back from the holding
 line and at exits it should be 12-24m to provide drivers with adequate time to observe
 and respond to the pedestrian.

For cyclists, studies have revealed that majority of the crashes involved an entering vehicle
colliding with a cyclist on the circulation lane. This issue suggests that entering vehicles have
difficulty in detecting the cyclists as they look out for larger vehicles approaching from their
right. Consequently, a separate cycle path may be the safest treatment where traffic volumes
are high. For instances, where large cyclist volumes have been recorded, an off-road bicycle
path around the roundabout should be constructed (Austroads Sydney , 2017).

 24 | P a g e
3.11.6 Travel way Characteristics
The basic characteristics of the travel way depends on the associated human and vehicle
characteristics. Some of the roadway characteristics that provides safe stopping and passing
manoeuvres have been discussed below:

Sight Distance: This refers to the length of the road that a driver can see ahead at any given
time. Sight distance consists of stopping sight distance (SSD). This is a minimum sight distance
that should be provided on the road to a driver traveling at the designed speed of the road so
that the driver can observe any obstruction on the road, and be able to stop without any
collision. Stopping sight distance is known to be the sum of the distance travelled during
reaction time and the braking distance. SSD can be expressed as the following equation:
 2
 = 0.028 +
 254.3(0.35 ± )
Where,
 is the design speed of the road (kmh/hr)
 is the grade of the roadway

Taking this into consideration, the sight distance at any point on the road should be at least
equal to the SSD. This sight distance is usually adequate for normal condition when the driver
expects the stimulus, however, it may not be adequate for situations when the stimulus is
unexpected or in situations where driver has no choice but to make unusual manoeuvre. In
that case, longer sight distance will provide the driver with an opportunity to perform evasive
manoeuvres, which is some cases may prove to be better than stopping (Lester A. Hoel, 2011).

3.11.6.1 Sight distance on roundabout
According to Austroads 2015b, there are three criteria that must be met for safe and efficient
roundabout. They are discussed below:
 • The configuration on the approach should provide the drivers with sufficient approach
 sight distance (ASD) from the holding line so that they have clear vision of the
 circulating carriageway. ASD is based on the speed of vehicles on the geometric
 element before entry curve.
 • Provide adequate sight distance so that driver entering a roundabout can see a vehicle
 entering from the approach directly to the right as well as travelling on the circulating
 roadway.
 25 | P a g e
You can also read