Resistance to different anthracycline chemotherapeutics elicits distinct and actionable primary metabolic dependencies in breast cancer - eLife

Page created by Jim Tran
 
CONTINUE READING
Resistance to different anthracycline chemotherapeutics elicits distinct and actionable primary metabolic dependencies in breast cancer - eLife
RESEARCH ARTICLE

                                   Resistance to different anthracycline
                                   chemotherapeutics elicits distinct and
                                   actionable primary metabolic
                                   dependencies in breast cancer
                                   Shawn McGuirk1,2, Yannick Audet-Delage3,4, Matthew G Annis2,5, Yibo Xue1,2,
                                   Mathieu Vernier2, Kaiqiong Zhao6,7, Catherine St-Louis3,4, Lucı́a Minarrieta3,4,
                                   David A Patten3,4, Geneviève Morin1,2, Celia MT Greenwood6,7,8,9,
                                   Vincent Giguère1,2, Sidong Huang1,2, Peter M Siegel2,5, Julie St-Pierre1,2,3,4*
                                   1
                                     Department of Biochemistry, Faculty of Medicine, McGill University, Montreal,
                                   Canada; 2Goodman Cancer Research Centre, McGill University, Montreal, Canada;
                                   3
                                     Department of Biochemistry, Microbiology, and Immunology, University of Ottawa,
                                   Ottawa, Canada; 4Ottawa Institute of Systems Biology, Ottawa, Canada;
                                   5
                                     Department of Medicine, Faculty of Medicine, McGill University, Montreal, Canada;
                                   6
                                     Department of Epidemiology, Biostatistics and Occupational Health, McGill
                                   University, Montreal, Canada; 7Lady Davis Institute, Jewish General Hospital,
                                   Montreal, Canada; 8Department of Human Genetics, McGill University, Montreal,
                                   Canada; 9Gerald Bronfman Department of Oncology, Montreal, Canada

                                   Abstract Chemotherapy resistance is a critical barrier in cancer treatment. Metabolic
                                   adaptations have been shown to fuel therapy resistance; however, little is known regarding the
                                   generality of these changes and whether specific therapies elicit unique metabolic alterations.
                                   Using a combination of metabolomics, transcriptomics, and functional genomics, we show that two
*For correspondence:               anthracyclines, doxorubicin and epirubicin, elicit distinct primary metabolic vulnerabilities in human
julie.st-pierre@uottawa.ca
                                   breast cancer cells. Doxorubicin-resistant cells rely on glutamine to drive oxidative phosphorylation
Competing interests: The           and de novo glutathione synthesis, while epirubicin-resistant cells display markedly increased
authors declare that no            bioenergetic capacity and mitochondrial ATP production. The dependence on these distinct
competing interests exist.         metabolic adaptations is revealed by the increased sensitivity of doxorubicin-resistant cells and
Funding: See page 20               tumor xenografts to buthionine sulfoximine (BSO), a drug that interferes with glutathione synthesis,
                                   compared with epirubicin-resistant counterparts that are more sensitive to the biguanide
Received: 24 November 2020
                                   phenformin. Overall, our work reveals that metabolic adaptations can vary with therapeutics and
Accepted: 12 June 2021
Published: 28 June 2021
                                   that these metabolic dependencies can be exploited as a targeted approach to treat
                                   chemotherapy-resistant breast cancer.
Reviewing editor: Matthew G
Vander Heiden, Massachusetts
Institute of Technology, United
States
                                   Introduction
   Copyright McGuirk et al. This
                                   Therapeutic resistance is a central problem in the clinical treatment of cancer. The incidence of
article is distributed under the
                                   breast cancer has risen to over one million new cases per year worldwide, where 20–30% of cases
terms of the Creative Commons
Attribution License, which         are diagnosed at an advanced or metastatic stage and another 30% recur or develop metastases
permits unrestricted use and       (Siegel et al., 2018; Murray et al., 2012). While both adjuvant and neoadjuvant therapies have
redistribution provided that the   proven effective to improve patient outcomes, not all patients respond to the same therapeutics.
original author and source are     Furthermore, drug resistance can manifest within months of treatment and is believed to cause treat-
credited.                          ment failure in over 90% of metastatic cancers (Garrett and Arteaga, 2011; Longley and Johnston,

McGuirk et al. eLife 2021;10:e65150. DOI: https://doi.org/10.7554/eLife.65150                                                     1 of 29
Resistance to different anthracycline chemotherapeutics elicits distinct and actionable primary metabolic dependencies in breast cancer - eLife
Research article                                                                                                    Cancer Biology

                                   2005). Consequently, due to intrinsic or acquired resistance, breast cancer patients often suffer dis-
                                   ease progression despite drug treatment (Murphy and Seidman, 2009; Moreno-Aspitia and Perez,
                                   2009).
                                       In the absence of targeted therapies, chemotherapy is a standard-of-care treatment for many
                                   aggressive breast cancers (Lebert et al., 2018). While this is efficient at killing fast-growing cells, it
                                   can also select for resistant cells or elicit adaptations that confer resistance in surviving populations.
                                   These may include genetic modulation of mechanisms that decrease intracellular drug concentration,
                                   like drug export through the ATP-binding cassette (ABC) transporter family (Hembruff et al., 2008)
                                   or lysosomal clearance (Guo et al., 2016), as well as adaptations that minimize or overcome ther-
                                   apy-associated insults like DNA damage or reactive oxygen species (ROS) (Morandi and Indraccolo,
                                   2017). Importantly, therapeutic agents elicit diverse resistance-conferring adaptations both across
                                   tumor subtypes and within tumors due to genetic and metabolic heterogeneity (Caro et al., 2012;
                                   Viale et al., 2015).
                                       Several recent reviews have emphasized the importance of metabolic adaptations in driving or
                                   supporting drug resistance (Morandi and Indraccolo, 2017; Viale et al., 2015; Wolf, 2014;
                                   Bosc et al., 2017; Ashton et al., 2018). Although glycolysis is likely to remain favored in resistant
                                   cancers undergoing hypoxia or with defective mitochondria (Xu et al., 2005; Zhou et al., 2012),
                                   increased reliance on mitochondrial energy metabolism and oxidative phosphorylation has been
                                   identified as a distinctive characteristic of drug resistance (Bosc et al., 2017) being central to thera-
                                   peutic resistance in ovarian (Matassa et al., 2016), pancreatic (Viale et al., 2014), colon
                                   (Vellinga et al., 2015), prostate (Ippolito et al., 2016), melanoma (Vazquez et al., 2013), and
                                   breast (Lee et al., 2017) cancers, as well as large B cell lymphoma (Caro et al., 2012) and acute
                                   (Farge et al., 2017) or chronic (Kuntz et al., 2017) myeloid leukemia.
                                       Despite these advances in our understanding of the metabolic status of treatment-resistant can-
                                   cers, little is known about the impact of different therapeutic drugs on the metabolic status of a
                                   given cancer. Addressing this knowledge gap is important, as numerous monotherapy and combina-
                                   tion therapy regimens are often available to treat each patient. Here, we show that breast cancer
                                   cells resistant to either doxorubicin or epirubicin, two anthracycline drugs that are used interchange-
                                   ably for breast cancer treatment (Mao et al., 2019), rely on distinct primary metabolic processes,
                                   and that exploiting these dependencies may impair the growth of treatment resistant breast
                                   cancers.

                                   Results
                                   Doxorubicin-resistant and epirubicin-resistant breast cancer cells
                                   display distinct global metabolic alterations
                                   As experimental models, we used well-established and published models of breast cancer therapeu-
                                   tic resistance (Hembruff et al., 2008; Guo et al., 2016; Veitch et al., 2009; Heibein et al., 2012).
                                   Briefly, these models were generated from human MCF-7 breast cancer cells, adapted to increasing
                                   concentrations of either doxorubicin or epirubicin to a maximum tolerated dose of 98.1 nM (DoxR
                                   cells) or 852 nM (EpiR cells), respectively, in a stepwise manner and over several months
                                   (Hembruff et al., 2008; Figure 1a). Parental control cells (Control cells) were maintained in DMSO
                                   throughout the extensive selection process (Hembruff et al., 2008; Figure 1a). At these maximally
                                   tolerated doses, it has been shown that resistance is not simply linked to drug exclusion by the cells.
                                   Indeed, augmenting intracellular drug levels by inhibiting ABC transporter activity in DoxR or EpiR
                                   has little effect on cell survival, highlighting the importance of adaptation mechanisms separate from
                                   that of the ABC transporters and independent of drug concentration (Hembruff et al., 2008).
                                       DoxR and EpiR cells maintained in culture with a stable dose of their respective drug grew slower
                                   than Control cells without treatment (Figure 1b), and acute exposure of Control cells to 98.1 nM of
                                   doxorubicin had a cytostatic effect, while treatment with 852 nM epirubicin was cytotoxic
                                   (Figure 1b,c). Finally, we verified that DoxR and EpiR cells are stably resistant, retaining their level of
                                   resistance even after a 7-week drug holiday (Figure 1—figure supplement 1a).
                                       In line with the chemical similarity and mechanism of action of both anthracycline drugs—nucleic
                                   acid intercalation, topoisomerase II inhibition leading to double-strand DNA breaks and apoptosis,
                                   and production of ROS (McGowan et al., 2017)—there was a considerable overlap in the signature

McGuirk et al. eLife 2021;10:e65150. DOI: https://doi.org/10.7554/eLife.65150                                                          2 of 29
Resistance to different anthracycline chemotherapeutics elicits distinct and actionable primary metabolic dependencies in breast cancer - eLife
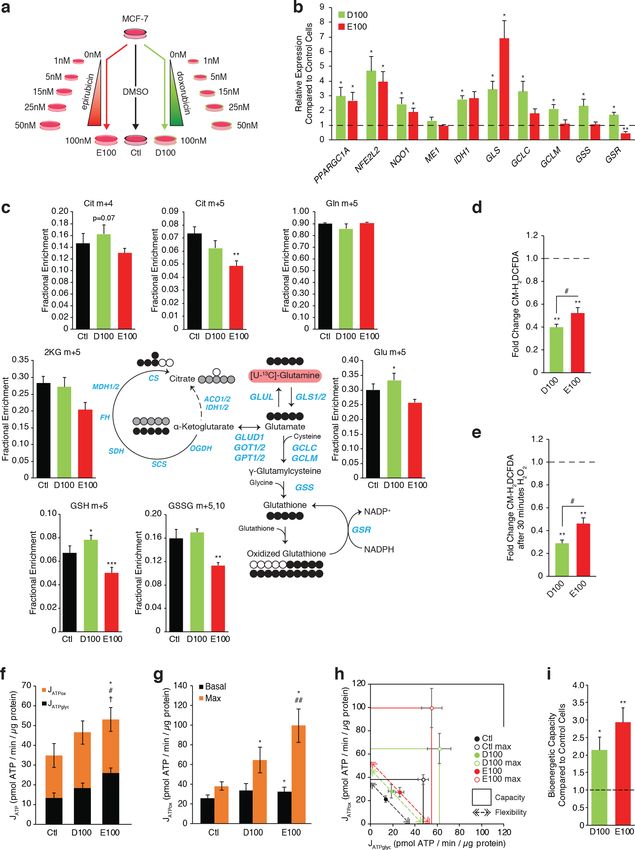
Research article                                                                                                              Cancer Biology

Figure 1. Transcriptomic and metabolomic analyses uncover distinct metabolic alterations in doxorubicin and epirubicin resistant breast cancer cells,
compared to anthracycline-sensitive Control cells. (a) Model detailing stepwise generation of Control, DoxR, and EpiR breast cancer cells, as previously
described (Hembruff et al., 2008). (b) Viable cell number of anthracycline-resistant cells in the presence of drugs and anthracycline-treated Control
cells compared to untreated Control (DMSO). N = 4, ***p
Resistance to different anthracycline chemotherapeutics elicits distinct and actionable primary metabolic dependencies in breast cancer - eLife
Research article                                                                                                                Cancer Biology

Figure 1 continued
Control vs Control +Epi, ‡p
Research article                                                                                                 Cancer Biology

                                      In parallel to these transcriptomics and metabolomics analyses, we performed pooled shRNA
                                   screens focused on 1215 druggable genes to identify primary vulnerabilities of DoxR and EpiR cells
                                   (Figure 1j). In this screen, the enrichment or depletion of shRNA barcodes in each cell system is
                                   measured over 7 days (post-integration of shRNAs); constructs whose barcodes are depleted over
                                   this span indicate gene targets whose knockdown impairs growth and/or cell viability. Analyzing
                                   depleted constructs via GSEA determined that DoxR cells were particularly sensitive to knockdown
                                   of glutathione metabolism genes (GSR and GPX family genes), while EpiR cells were vulnerable to
                                   suppression of genes involved in oxidative phosphorylation (NDUF and SDH family genes) and
                                   methionine metabolism (MAT1A, MAT2A, MAT2B, BHMT, DNMT1; Figure 1k and Figure 1—figure
                                   supplement 1e). In agreement with previous work (Veitch et al., 2009; Heibein et al., 2012), both
                                   DoxR and EpiR cells were sensitive to knockdown of aldo-keto reductase family genes, which are
                                   represented in the steroid hormone biosynthesis pathway (Figure 1k). Overall, results from the
                                   shRNA screens are consistent with our integrated transcriptional and metabolic network analysis
                                   (Figure 1i) and highlight distinct metabolic vulnerabilities supporting epirubicin and doxorubicin
                                   resistance.

                                   Doxorubicin-resistant breast cancer cells display altered glucose and
                                   glutamine metabolism
                                   To gain greater understanding of the reliance of anthracycline-resistant breast cancer cells on the
                                   pathways identified in the integrated analyses above, we confirmed gene expression profiles by RT-
                                   qPCR (Figure 2a) and performed stable isotope tracer analyses of [U-13C]-glucose (Figure 2b–d,
                                   Figure 2—figure supplement 1a,b) and [U-13C]-glutamine (Figure 2e,f, Figure 2—figure supple-
                                   ment 2a,b). The full kinetics of all stable isotope tracing experiments are shown in Figure 2—figure
                                   supplements 1 and 2, in accordance with the standard practice in the field (Buescher et al., 2015).
                                       DoxR cells exhibited significantly increased expression of anaplerotic metabolism genes (PC,
                                   ME1, ME2), glutamine metabolism genes (SLC1A5, GLS, GLUL), and, markedly, glutathione metabo-
                                   lism genes (GCLC, GCLM, GSS, GSR) compared to Control cells (Figure 2a). Accordingly, kinetic
                                   tracing of glucose carbons showed that while Control and EpiR cells replenish their pools of citric
                                   acid cycle intermediates (citrate and malate m + 2) principally through pyruvate dehydrogenase
                                   (PDH), DoxR cells significantly favor anaplerotic pyruvate metabolism (citrate, malate, and fumarate
                                   m + 3) through pyruvate carboxylase (PC) and/or malic enzymes (ME1/2; Figure 2d and Figure 2—
                                   figure supplement 1a,b). Interestingly, glutamate, alanine, and serine synthesis from glucose was
                                   decreased in DoxR cells compared to Control cells (Figure 2d and Figure 2—figure supplement
                                   1a,b). Kinetic tracing further showed that glutamine metabolism was enriched in DoxR cells com-
                                   pared to Control and EpiR cells, evidenced by increased labeling to glutamate, a-ketoglutarate, and
                                   citrate (Figure 2e,f and Figure 2—figure supplement 2a,b). Reductive carboxylation of glutamine
                                   was particularly increased in DoxR cells compared to Control and EpiR cells, as indicated by a signifi-
                                   cant increase in m + 5 labeling to citrate (Figre 2e,f and Figure 2—figure supplement 2a,b). More
                                   strikingly, DoxR cells largely favored the use of glutamine carbons for de novo production of gluta-
                                   thione, evidenced by a fourfold enrichment of labeling to GSH and GSSG compared to both Control
                                   and EpiR cells (GSH m + 5, GSSG m + 5,10; Figure 2f and Figure 2—figure supplement 2a,b). This
                                   may also be driven in part by exchange of glutamate for cystine through the glutamate/cystine anti-
                                   porter system (Habib et al., 2015) as DoxR cells were found to export significantly higher levels of
                                   glutamate than both Control and EpiR cells (Figure 2—figure supplement 3a).
                                       In agreement with these stable isotope tracing results, DoxR cells displayed a significantly higher
                                   total intracellular glutathione concentration than EpiR cells, and both had higher values than Control
                                   cells (Figure 2g). Both resistant lines had a significantly higher GSH:GSSG ratio than Control cells,
                                   with DoxR cells displaying an even greater enrichment of reduced glutathione compared to EpiR
                                   cells (Figure 2h). The elevated glutathione metabolism in DoxR cells is further supported by their
                                   decreased NADH:NAD and NADPH:NADP ratios (Figure 2i) compared to Control cells, as the
                                   reduced equivalent NADPH is required for the reduction of GSSG to GSH through glutathione
                                   reductase (GSR), whose expression was increased in DoxR but not EpiR cells compared to Control
                                   cells (Figure 2a). NADPH levels may also be depleted through the reductive carboxylation of gluta-
                                   mine, as this pathway relies on the NADPH-dependent isocitrate dehydrogenases (IDH1/2); the
                                   expression of IDH1 is significantly increased in DoxR cells compared to both EpiR and Control cells,
                                   in line with their increased engagement of this pathway (Figure 2a,f). Conversely, EpiR cells

McGuirk et al. eLife 2021;10:e65150. DOI: https://doi.org/10.7554/eLife.65150                                                      5 of 29
Research article                                                                                                                 Cancer Biology

Figure 2. Doxorubicin-resistant breast cancer cells fuel anaplerotic metabolism by altering glucose and glutamine metabolism. (a) Relative expression
of pyruvate metabolism, citric acid cycle, and glutamine and glutathione metabolism genes in DoxR and EpiR compared to Control cells. N = 3–6,
*p
Research article                                                                                                               Cancer Biology

Figure 2 continued
N = 3, **p
Research article                                                                                                                                                                                                                                                                                                                                                                                                                                                                        Cancer Biology

    a                                                                                                                              b                                                                                                                               c                                                                                                   d                                                                                                                    e
                                                                                                                                                                                                                                                                                                                                                                                                              70                                                                                                                          Basal
                                                                                                                                                                         14                                                                          #                                                 3.5                                                                                                                                              JATPox                                                  80%                                                       #
                                                                                                                                                                                                  Uncoupled                                                                                                                                                                                                                                                           *                                                                   Max

                                                                                                                                                                                                                                                                                                                                                                         JATP (pmol ATP / min / µg protein)
                                                                               Control    DoxR       EpiR                                                                                                                                                                                                                                                                                                                                               JATPglyc      #                                                                                              ***

                                                                                                                                      OCR (pmol O2 / min / µg protein)
                                                                                                                                                                                                                                                     **                                                                                                                                                                                                                                                         70%                    ###

                                                                                                                                                                                                                                                                       ECAR (mpH / min / µg protein)
                                                                                                                                                                                                  Coupled                                                                                                                                                                                                     60

                                                                                                                                                                                                                                                                                                                                                                                                                                                                                     % ATP produced by OXPHOS
                                                                       Oligo FCCP Rot/Myxo Mon                                                                           12                                                                                                                            3.0                                                                                                                                                                                                                                                ###                 **
                                                           2.5
    Control Cells Basal Respiration

                                                                    Basal Leak  Max     Non-   Max                                                                                                                                                                                                                                                                                                            50                                                                                                60%
     Relative OCR Compared to

                                                                                 ox     mito   glyc                                                                      10                                                                                                                            2.5
                                                           2.0                                                                                                                                                                                                                                                                                                                                                                                                                                                  50%
                                                                                                                                                                         8                                                                                                                             2.0                                                                                                    40
                                                           1.5                                                                                                                                                                                                                                                                                                                                                                                                                                                  40%
                                                                                                                                                                         6                                                                                                                             1.5                                                                                                    30
                                                                                                                                                                                                                                                                                                                                                                                                                                                                                                                30%
                                                           1.0
                                                                                                                                                                         4                                                                                                                             1.0                                                                                                    20
                                                                                                                                                                                                                                                                                                                                                                                                                                                                                                                20%
                                                           0.5                                                                                                           2                                                                                                                             0.5                                                                                                    10                                                                                                10%

                                                            0                                                                                                            0                                                                                                                                                  0                                                                                 0                                                                                                  0%
                                                                                                                                                                                 Control DoxR EpiR                                                                                                                                      Control DoxR EpiR                                                                           Control DoxR EpiR                                                                         Control DoxR                           EpiR

    f                                                100
                                                                                                            Control                                                           g                                                                                                                        h                                                                                                       i                                                                                                                j
                                                           90                                               Control max
                                                                                                                                                                                                                                                                                                                                       30%
                    JATPox (pmol ATP / min / µg protein)

                                                                                                            DoxR                                                                                                  1.6                                                                                                                                                                                                                                   30%
                                                           80                                               DoxR max                                                                                                                                                                                                                                                                                                                                                                                                                              14
                                                                                                                                                                              Fold Change Bioenergetic Capacity

                                                                                                                                                                                                                                                                                                                                                                                                                   Mitochondrial Volume / Cell Volume
                                                                                                                                                                                                                                                                                                                                                                                                                                                                                                                                                              ***

                                                                                                                                                                                                                                                                                                                                                                                                                                                                                                                      Compared to Control Cells
                                                                                                                                                                                                                                                                                                       % Bioenergetic capacitiy used
                                                                                                            EpiR                                                                                                  1.4                                         *                                                                        25%                                                                                                                                                                                                                               DoxR
                                                           70                                                                                                                                                                                                                                                                                                                                                                                                                                                                                     12
                                                                                                                                                                                  Compared to Control Cells

                                                                                                            EpiR max                                                                                                                                                                                                                                                                                                                                                                                                                                                     EpiR

                                                                                                                                                                                                                                                                                                                                                                                                                                                                                                                        Relative Expression
                                                                                                                                                                                                                                                                                                                                                                                                                                                                                           **
                                                                                                                                                                                                                  1.2                                                                                                                                                                                                                                                                                                                             10
                                                           60                                                           Capacity                                                                                                                                                                                                       20%
                                                                                                                                                                                                                                                                                                                                                                                                                                                        20%
                                                                                                                        Flexibility                                                                               1.0                                                                                                                                             *                                                                                                                                                                                8
                                                           50
                                                                                                                                                                                                                  0.8                                                                                                                  15%                                                                                                                                                                                                         6
                                                           40
                                                           30                                                                                                                                                     0.6                                                                                                                                                                                                                                                                                                                              4
                                                                                                                                                                                                                                                                                                                                       10%                                                                                                              10%
                                                           20                                                                                                                                                     0.4                                                                                                                                                                                                                                                                                                                              2                      **
                                                                                                                                                                                                                                                                                                                                       5%                                                                                                                                                                                                          0
                                                           10                                                                                                                                                     0.2

                                                                                                                                                                                                                                                                                                                                                                                                                                                                                                                                                         1A

                                                                                                                                                                                                                                                                                                                                                                                                                                                                                                                                                                    1B
                                                                                                                                                                                                                                                                                                                                                                                                                                                                                                                                                    C

                                                                                                                                                                                                                                                                                                                                                                                                                                                                                                                                                                C
                                                            0                                                                                                                                                      0                                                                                                                   0%                                                                                                               0%

                                                                                                                                                                                                                                                                                                                                                                                                                                                                                                                                                   G

                                                                                                                                                                                                                                                                                                                                                                                                                                                                                                                                                               G
                                                                                                                                                                                                                                                                                                                                                                                                                                                                                                                                                  AR

                                                                                                                                                                                                                                                                                                                                                                                                                                                                                                                                                              AR
                                                                0  10 20 30 40 50 60 70                                                                                                                                                     DoxR          EpiR                                                                                Control DoxR EpiR                                                                                               Control DoxR        EpiR

                                                                                                                                                                                                                                                                                                                                                                                                                                                                                                                                      PP

                                                                                                                                                                                                                                                                                                                                                                                                                                                                                                                                                         PP
                                                           JATPglyc (pmol ATP / min / µg protein)

    k                                                                                            l                                                                                                                  m                                                                                                                                           n                                                                                                            o
                                                                                                                       1.2                                                                                                                                                                                                                                                                                                                                                                                      1.4                                DoxR siPGC-1* +
                                                                                                                                                                         DoxR                                                               12                    DoxR, siCTL                                                                                                                                                                    DoxR siControl                                                                                    EpiR siPGC-1* +
                                                                                                                                                                         EpiR
                                                                                                                       1.0                                                                                                                                        DoxR, siPGC-1* +                                                                                                                                                               DoxR siPGC-1* +                                                1.2
                                                                                                 Relative Expression
                                                                                                 Compared to siCTL

                                                                                                                                 siPGC-1* +                                                                                                 10                                                                                                                                                                                                   EpiR siControl

                                                                                                                                                                                                                                                                                                                                                                                                                                                                             Relative Expression
                                                                                                                                                                                                                                                                                                                                                                                                                                                                             Compared to siCTL
                                                                                                                                                                                                                                                                  EpiR, siCTL
                                                                                                                                                                                                                    Live cells (x 100000)

                                                                                                                       0.8                                                                                                                                                                                                                                                                                                                                                                                      1.0
                                                                                                                                                                                                                                                                                                                                                                                                                                                 EpiR siPGC-1* +
                                                                                                                                                                                                                                                                  EpiR, siPGC-1* +
                                                                           l
                                                                         tro

                                                                                                                                                                                                                                            8
                                                                                R
                                                                                    iR

                                                                                                                                                                                                                                                                                                                                                                                    100%
                                                                      on

                                                                           ox

                                                                                                                       0.6                                                                                                                                                                                                                                                                                                                                                                                      0.8
                                                                                  Ep

                                                                                                                                                                                                                                                                                                                                                                                                                                                                                                                                                              **
                                                                     C

                                                                           D

                                                                                                                                                                                                                                                                                                                                                                                                                                                              **
                                                                                                                                                                                                                                                                                                                                                                Day 6 Viability

                                                                                         3*& +                                                                                                                                              6                                                                                                                                                                                                                                                                                                            **          **
                                                                                                                       0.4                                                ***                                                                                                                                                                                                                       80%                                                                                                         0.6
   100 kDa                                                                                                                                                                                                                                                                                                                                                                                                                                                                                                                                         ***
                                                                                         3*& *                                   * **
    50 kDa                                                                                                             0.2                                 ***                                                                              4                                                                                                                                                       60%                                                             ***                                         0.4
                                                                                         ACTIN
    37 kDa                                                                                                                                                                                                                                                                                                                                                 **                                       40%
                                                                                                                        0                                                                                                                   2                                                                                                ** ***   **   #                                                                                                                                                    0.2
                                                                                                                                                                                                                                                                                                                                             ## ##    #
                                                                                                                             1A

                                                                                                                                                          1B

                                                                                                                                                                                                                                                                                                                                                                                                    20%                                                                                                          0
                                                                                                                             C

                                                                                                                                             C
                                                                                                                         G

                                                                                                                                    G

                                                                                                                                                                                                                                            0
                                                                                                                       AR

                                                                                                                                 AR

                                                                                                                                                                                                                                                                                                                                                                                                                                                                                                                                                          SS

                                                                                                                                                                                                                                                                                                                                                                                                                                                                                                                                                                     SR
                                                                                                                                                                                                                                                                                                                                                                                                                                                                                                                      LC

                                                                                                                                                                                                                                                                                                                                                                                                                                                                                                                       M
                                                                                                                                                                                                                                                 0        1        2                                   3                   4 5                   6    7    8                                                  0%
                                                                                                                 PP

                                                                                                                                                                                                                                                                                                                                                                                                                                                                                                                   LC
                                                                                                                             PP

                                                                                                                                                                                                                                                                                                                                                                                                                                                                                                                                                         G
                                                                                                                                                                                                                                                                                                                                                                                                                                                                                                                    C

                                                                                                                                                                                                                                                                                                                                                                                                                                                                                                                                                                    G
                                                                                                                                                                                                                                                                                                                                                                                                                                                                                                                  G

                                                                                                                                                                                                                                                                                                                          Days                                                                                                                                                                                    G

Figure 3. PGC-1a is overexpressed and elevates OXPHOS capacity in epirubicin-resistant cells but is essential for sustaining growth and survival in both
doxorubicin and epirubicin resistant breast cancer cells. (a) Analysis of relative basal, leak (oligomycin), maximum (FCCP), and non-mitochondrial
(rotenone and myxothiazol) respiration, as well as after addition of monensin, in Control, DoxR, and EpiR cells. All values normalized to basal respiration
in Control cells. N = 9. (b) Quantification of coupled, uncoupled, and total Oxygen Consumption Rate (OCR) in Control, DoxR, and EpiR cells. N = 9,
**p
Research article                                                                                                             Cancer Biology

Figure 3 continued
Control, DoxR, and EpiR cells. (l) Relative expression of PPARGC1A and PPARGC1B mRNA in DoxR and EpiR 3 days after double siRNA knockdown of
PGC-1a and PGC-1b, compared to control siRNA. N = 5, *p
Research article                                                                                                                Cancer Biology

Figure 4. Doxorubicin-resistant breast cancer cells are reliant on glutamine to sustain their OXPHOS bioenergetic capacity. (a) Growth of Control,
DoxR, and EpiR cells in glutamine-rich (4 mM) or glutamine-deprived (0 mM) conditions. Cells were differentially seeded to reach a total of 200,000 cells
at day 3 under normal growth conditions; media was then changed for glutamine-rich or glutamine-depleted media, daily (day 3–11). N = 3, *p
Research article                                                                                                 Cancer Biology

                                   entirely abrogated the spare oxidative capacity of DoxR cells (Figure 4i, box height relative to basal
                                   point). This significantly reduced the total bioenergetic capacity (mitochondrial and glycolytic capaci-
                                   ties combined, Figure 4i box area, Figure 4g) of DoxR cells and their bioenergetic flexibility—the
                                   ability to dynamically shift glycolysis and OXPHOS rates while maintaining a constant ATP produc-
                                   tion rate (Figure 4i, dotted arrow length). Control and EpiR cells showed diminished oxidative
                                   capacity (box height) and increased glycolytic capacity (box width) as well as no change in flexibility
                                   after glutamine withdrawal (Figure 4h,j). However, the decrease in oxidative capacity in EpiR cells
                                   was greater than their increase in glycolytic capacity, leading to a reduced total bioenergetic capac-
                                   ity in the absence of glutamine (Figure 4g,j). The total bioenergetic capacity of EpiR cells remained
                                   nevertheless greater than that of DoxR cells (Figure 4g). Taken together, these data show that gluta-
                                   mine is specifically important for doxorubicin resistant breast cancer cells, not only for glutathione
                                   synthesis but also for mitochondrial ATP production.

                                   Independently-derived models of doxorubicin- and epirubicin-resistance
                                   confirm their respective dependance on glutathione metabolism and
                                   oxidative phosphorylation
                                   To independently confirm the distinct metabolic adaptations to doxorubicin and epirubicin of the
                                   well-characterized cells in this study (Hembruff et al., 2008), we generated new resistant cell lines
                                   from drug-naive MCF-7 cells over the course of 8 months, following a similar step-wise process and
                                   up to a common end-point dose of 100 nM doxorubicin (D100 cells) or epirubicin (E100 cells;
                                   Figure 5a). Matched parental control (Ctl) cells were maintained in 0.1% DMSO through parallel pas-
                                   sages (Figure 5a). Importantly, while we sought to confirm the distinct metabolic adaptations to
                                   each drug, it was expected that there would be some variability between these independently
                                   derived resistant cells and the cells used in the rest of study given that cancer cells may engage dif-
                                   ferent adaptation strategies to develop resistance to chemotherapy (Edwardson et al., 2013).
                                       As seen in DoxR and EpiR cells (Figure 2), key oxidative response genes (NFE2L2, NQO1) as well
                                   as GLS and IDH1 were significantly overexpressed in both D100 and E100 cells, while only D100 cells
                                   exhibited significant overexpression of glutathione metabolism genes (GCLC, GCLM, GSS, GSR)
                                   compared to parental control (Ctl) cells (Figure 5b). Accordingly, stable isotope tracing analyses
                                   confirmed that D100 have significantly increased de novo synthesis of glutathione from glutamine
                                   compared to Ctl cells, whereas it was significantly decreased in E100 cells (Figure 5c and Figure 5—
                                   figure supplement 1a). D100 cells also displayed a lower ROS signal than E100 cells, both at base-
                                   line (Figure 5d) and after H2O2 treatment (Figure 5e), while both resistant cells had lower ROS sig-
                                   nals than Ctl cells.
                                       Similar to EpiR cells (Figure 3), E100 cells also had significantly higher expression of PPARGC1A
                                   (Figure 5b), along with increased oxygen consumption and extracellular acidification rates, increased
                                   total ATP production rates, increased basal and maximum oxidative ATP production rates (JATPox),
                                   as well as greater bioenergetic capacity compared with Ctl cells (Figure 5—figure supplement 1b,c
                                   and Figure 5f–i). Interestingly, and in contrast to DoxR cells, D100 cells displayed a significant
                                   increase in the expression of PPARGC1A (Figure 5b), as well as elevated maximum oxidative ATP
                                   production rate and bioenergetic capacity compared to Ctl (Figure 5g–i). Despite these differences
                                   in bioenergetics between the two cell models of doxorubicin resistance, these results confirm that
                                   epirubicin resistant cells display higher oxidative capacity than doxorubicin-resistant
                                   cells (Figure 5g–h).
                                       Overall, these independently derived cell models of doxorubicin and epirubicin resistance broadly
                                   replicate the central findings of the manuscript, namely that doxorubicin-resistant cells have an ele-
                                   vated usage of glutamine for glutathione synthesis and that epirubicin-resistant cells display
                                   markedly increased OXPHOS capacity. Furthermore, given that the independently derived cell lines
                                   were selected to a common end-point dose of 100 nM of doxorubicin or epirubicin, these data fur-
                                   ther demonstrate that these metabolic adaptations are specific to the drug and not the dose.

                                   Tailored metabolic adaptations underpinning resistance to doxorubicin
                                   and epirubicin lead to primary actionable vulnerabilities
                                   Despite some similar mechanisms supporting resistance to doxorubicin and epirubicin in breast can-
                                   cer cells, our results have thus far shown that drug-dependent dominant metabolic adaptations arise

McGuirk et al. eLife 2021;10:e65150. DOI: https://doi.org/10.7554/eLife.65150                                                      11 of 29
Research article                                                                                                                 Cancer Biology

Figure 5. Independently derived resistant models confirm specific metabolic adaptations to doxorubicin and epirubicin. (a) Model detailing generation
of breast cancer cells resistant to increasing concentrations of anthracyclines, to a final stable extracellular concentration of 100 nM of doxorubicin
(D100) or epirubicin (E100). Control cells (Ctl) were maintained in DMSO in parallel passages. (b) Relative expression of PPARGC1A and selected
metabolic, glutathione, and oxidative response genes in D100 and E100 compared to Ctl. N = 3–6. *p
Research article                                                                                                                 Cancer Biology

Figure 5 continued
JATPox #p
Research article                                                                                                                  Cancer Biology

Figure 6. Tailored metabolic adaptations underpinning resistance to doxorubicin and epirubicin lead to primary actionable vulnerabilities in vitro and in
vivo. (a) Relative viable cell count of Control, DoxR, and EpiR cells after 3 days treatment with a combination of phenformin and their respective drug
(DMSO, 98.1 nM doxorubicin, or 852 nM epirubicin). Data are shown as relative viable cell count of phenformin-treated cells compared to cells treated
with vehicle (water). N = 4, *p
Research article                                                                                                                  Cancer Biology

Figure 6 continued
primary metabolic dependencies are actionable, as epiribucin-resistant cells are more sensitive to phenformin treatment than doxorubicin-resistant
cells, and the latter are specifically sensitive to inhibition of glutathione synthesis by buthionine sulfoximine (BSO) both in vitro and in vivo. Unless
otherwise noted, all data presented as averages ± S.E.M.

                                      more sensitive than epirubicin-resistant cells to therapeutic intervention with BSO, which interferes
                                      with glutathione synthesis. Given that side effects such as cardiotoxicity limit the use of anthracy-
                                      clines in patients to a restrictive cumulative total lifetime dose, there is important clinical relevance in
                                      reducing tumor growth in anthracycline-resistant patients through a secondary treatment option
                                      such as BSO without administrating additional anthracycline chemotherapy (Barrett-Lee et al.,
                                      2009). In contrast to doxorubicin-resistant cells, epirubicin-resistant cells display a drastic increase in
                                      OXPHOS and oxidative bioenergetic capacity and were more sensitive than doxorubicin-resistant
                                      cells to treatment with phenformin. This aligns with the compendium of evidence showing that
                                      dependence on mitochondrial energy metabolism and oxidative phosphorylation is a widespread
                                      characteristic of drug resistance, across several cancer types and therapeutic interventions
                                      (Caro et al., 2012; Bosc et al., 2017; Matassa et al., 2016; Viale et al., 2014; Vellinga et al.,
                                      2015; Ippolito et al., 2016; Vazquez et al., 2013; Lee et al., 2017; Farge et al., 2017;
                                      Kuntz et al., 2017; Thompson et al., 2017).
                                          Our findings are particularly interesting given the structural similarity of doxorubicin and epirubi-
                                      cin. In line with this, breast cancer cells resistant to either drug displayed well-known mechanisms of
                                      resistance to anthracyclines, including increased drug efflux, lysosomal activity, and oxidative stress
                                      response (Hembruff et al., 2008; Guo et al., 2016). Their different metabolic state may, in part, be
                                      due to minor structural differences between the two drugs, leading to distinct on- and off-target
                                      effects under sustained treatments with either drug (Salvatorelli et al., 2006). For example, while
                                      cardiotoxicity is a common side effect of sustained anthracycline treatment, epirubicin has been
                                      shown to induce less cardiotoxic effects than doxorubicin, even if both drugs display equivalent
                                      response rate to treat breast cancer (Mao et al., 2019). Given that cardiotoxicity is linked to oxida-
                                      tive stress, it is possible that breast cancer cells treated with doxorubicin may face a greater oxida-
                                      tive challenge over the course of treatment than those treated with epirubicin, which aligns with a
                                      greater dependence of doxorubicin-resistant cells on de novo glutathione synthesis
                                      (Salvatorelli et al., 2006). Accordingly, doxorubicin-resistant cells also displayed much greater
                                      engagement of oxidative stress response than epirubicin-resistant cells. Interestingly, epirubicin-
                                      resistant cells displayed an elevated level of uncoupled respiration, which may represent an alternate
                                      approach to minimizing ROS production in this model (Echtay et al., 2002; Brand, 2000). Indeed,
                                      targeting uncoupling proteins has previously been shown to sensitize multi-drug-resistant leukemia
                                      cells to both doxorubicin and epirubicin (Mailloux et al., 2010).
                                          Crucially, our study further upholds the viability of exploiting metabolic alterations associated
                                      with resistance to chemotherapeutic drugs to increase their success rate (Zaal and Berkers, 2018).
                                      This strategy has already shown success in numerous cancers; for example, inhibition of amino acid
                                      recycling sensitized neuroblastomas to cisplatin (Gunda et al., 2020), fueling histidine catabolism via
                                      histidine supplementation increases sensitivity of leukemic xenografts to methotrexate
                                      (Kanarek et al., 2018), and the glutaminase inhibitor CB-839 synergistically enhances the cytotoxic-
                                      ity of carfilzomib in treatment-resistant multiple myeloma cells, notably through its inhibition of glu-
                                      tamine-fueled mitochondrial respiration (Thompson et al., 2017).
                                          It is also notable that the master regulator of mitochondrial metabolism PGC-1a regulates a sig-
                                      nificant number of pathways implicated in therapy resistance, including OXPHOS (Mootha et al.,
                                      2003), oxidative stress response (St-Pierre et al., 2006), glutamine metabolism (McGuirk et al.,
                                      2013), and glutathione metabolism (Guo et al., 2018). The context-dependent roles of PGC-1a may
                                      therefore underpin specific metabolic vulnerabilities in both doxorubicin and epirubicin resistance in
                                      breast cancer. Accordingly, both doxorubicin- and epirubicin-resistant cells were sensitive to PGC-
                                      1a knockdown in our study. This aligns with the emerging role of PGC-1a in driving bioenergetic
                                      flexibility and metabolic plasticity in the face of survival challenges involved in cancer progression
                                      (Tan et al., 2016; McGuirk et al., 2020; Andrzejewski et al., 2017); advanced cancers need to be
                                      adaptable, and thereby the context-dependent adaptations conferred by PGC-1a could further con-
                                      tribute to the difficulty in treating advanced cancers. Indeed, similar to OXPHOS and mitochondrial

McGuirk et al. eLife 2021;10:e65150. DOI: https://doi.org/10.7554/eLife.65150                                                                        15 of 29
Research article                                                                                                 Cancer Biology

                                   energy metabolism, PGC-1a has been shown to be implicated in drug resistance across cancer types
                                   and through various mechanisms (see Supplementary file 1). While therapeutically targeting tran-
                                   scription factors that relay PGC-1a effects may represent an effective strategy in some cases
                                   (De Vitto et al., 2019; Deblois et al., 2016), attempts to directly target PGC-1a have unfortunately
                                   shown little success thus far.
                                      Ultimately, targeting global regulators of metabolic plasticity like PGC-1a may be promising as a
                                   broad strategy for treatment of therapeutic-resistant cancers. However, targeted interventions
                                   exploiting the primary metabolic dependencies associated to specific resistant cancers—such as
                                   using BSO as a therapeutic intervention for doxorubicin-resistant breast cancer—may represent a
                                   more immediate and effective approach.

                                   Materials and methods
                                   Tissue culture and generation of stable cell lines
                                   MCF-7CC, MCF-7DOX-2, and MCF-7EPI cells were obtained from Dr. Amadeo Parissenti
                                   (Hembruff et al., 2008). Briefly, MCF-7DOX-2 and MCF-7EPI were selected over 12 sequential dose
                                   increases with their respective anthracycline drug (doxorubicin, epirubicin) to maximal doses of 98.1
                                   nM and 852 nM (Hembruff et al., 2008). MCF-7CC cells were maintained in 0.1% DMSO through
                                   parallel passages (Hembruff et al., 2008). For simplicity, MCF-7CC, MCF-7DOX-2, and MCF-7EPI cells
                                   are referred to only as Control, DoxR, and EpiR in this study. Cells were cultured in high-glucose Dul-
                                   becco’s Modified Eagle’s Medium (DMEM, Wisent #319–005 CL), 10% FBS, and penicillin/streptomy-
                                   cin at 37˚C and 5% CO2. New resistant MCF-7 models were derived from MCF-7 cells obtained from
                                   the American Type Culture Collection (ATCC) and cultured in similar media under increasing doses
                                   of doxorubicin (Abmole Biosciences #M1969) or epirubicin (Sigma Aldrich #E9406) from 0.1 nM to a
                                   final dose of 100 nM, over the course of 8 months. Ctl cells were maintained in 0.1% DMSO through
                                   parallel passages. All cells were maintained in culture with a constant dose of their respective drug
                                   or DMSO control, at all times unless otherwise specified.

                                   Proliferation and viability
                                   Proliferation assays were performed by seeding 200,000 cells in 35 mm plates and growing in full
                                   media as described above. For glutamine withdrawal experiments, media was replaced on day three
                                   with glutamine-free media or glutamine-free media re-supplemented with 4 mM glutamine. To
                                   determine cell counts, cells were washed, trypsinized, and counted using a TC10 automated cell
                                   counter (Bio-Rad). Viability was determined by exclusion of trypan blue dye.

                                   Mouse experiments
                                   Four million DoxR or EpiR cells were injected into opposing mammary fat pads of NOD Scid Gamma
                                   mice supplemented twice weekly with subcutaneous injection of 5 micrograms of estrogen in corn
                                   oil. Seventy days after tumor cell injection mice were divided into two groups and treated daily by
                                   intraperitoneal injection with either 450 mg/kg of L-Buthionine-sulfoximine (Sigma Aldrich #B2515)
                                   or vehicle (PBS). Tumor volume was measured weekly using caliper measurements and the
                                   formula length  width2  p6 .

                                   Gene expression
                                   Total RNA from cultured cells was extracted using the Aurum Total RNA Mini Kit (Bio-Rad, Missis-
                                   sauga, Canada) and was reverse transcribed with iScript cDNA Synthesis kit (Bio-Rad). mRNA expres-
                                   sion analyses by real-time PCR were performed using iQ SYBR Green Supermix (Bio-Rad) and gene-
                                   specific primers with the MyiQ2 Real-Time Detection System (Bio-Rad). Values were normalized to
                                   TATA-binding protein (TBP) expression. All primer sequences are listed in Supplementary file 2.

                                   Gene expression profiling, enrichment analyses, and ranked gene list
                                   comparisons
                                   Gene expression profiling of Control, DoxR, and EpiR cells was performed with Genome Québec
                                   (Montreal, Canada) using the Affymetrix Human Gene 2.0 ST Array (HT) system, for which RNA was
                                   isolated as described above. The .CEL files were analyzed and pre-processed using the Affymetrix

McGuirk et al. eLife 2021;10:e65150. DOI: https://doi.org/10.7554/eLife.65150                                                     16 of 29
Research article                                                                                                 Cancer Biology

                                   Transcriptome Analysis Console software (RRID:SCR_016519). These data have been deposited in
                                   NCBI’s Gene Expression Omnibus (RRID:SCR_005012, Edgar et al., 2002) and are accessible
                                   through GEO Series accession number GSE125187 (https://www.ncbi.nlm.nih.gov/geo/query/acc.
                                   cgi?acc=GSE125187). Gene Set Enrichment Analysis (GSEA, RRID:SCR_003199) was performed on
                                   ranked gene lists, where ranks were designated by the sign of the fold change multiplied by the log-
                                   arithm of the p-value (Subramanian et al., 2005).
                                       To compare with patient data, differential expression analyses of this microarray and a publicly
                                   available patient dataset (GEO accession GSE43816, Gruosso et al., 2016) were performed using
                                   the R (RRID:SCR_001905) Bioconductor (RRID:SCR_006442) package ‘LIMMA’ and lists were ranked
                                   by t-test statistics (R Development Core Team, 2019; Phipson et al., 2016). There are 34,744 and
                                   20,474 genes in the cell line and GEO data set, respectively. 19,038 genes appeared in both data
                                   sets. To compare the observed size of overlap between two ordered gene lists to the expected
                                   overlap when two lists are independent, we followed the methods outlined by Yang et al., 2006.
                                   Specifically, we measured the expected overlap by randomly shuffling the rank order of one list and
                                   measuring the size of overlap, repeating this over 1000 permutations. The R Bioconductor (RRID:
                                   SCR_006442) package ‘OrderedList’ was used to calculate the expected overlap.

                                   shRNA screen for drug target genes
                                   A list of 1215 genes related to clinically-approved drugs was generated based on DrugBank and The
                                   NCGC Pharmaceutical Collection (Huang et al., 2011). A library with 7847 shRNAs targeting these
                                   genes (FDA library) was constructed from the arrayed and sequence-verified RNAi Consortium (TRC)
                                   human genome-wide shRNA collection, provided by The McGill Platform for Cell Perturbation
                                   (MPCP) of the Rosalind and Morris Goodman Cancer Research Centre and Biochemistry Department
                                   at McGill University. This druggable library consists of 11 plasmid pools. Lentiviral supernatants were
                                   generated as described at http://www.broadinstitute.org/rnai/public/resources/protocols. DoxR and
                                   EpiR cells were infected separately by the 11 virus pools. Cells were then pooled and plated at
                                   500,000 cells per 15 cm dish with 1000 times of coverage in presence of doxorubicin or epirubicin
                                   (respectively), for a total of 32 dishes per cell line. Genomic DNA was extracted from the remaining
                                   cells in the original pool, as well as in a pool of all 32 dishes after 7 days of growth, and sequencing
                                   libraries were built as previously described (Huang et al., 2012). shRNA stem sequence was segre-
                                   gated from each sequencing reads and aligned to TRC library. The matched reads were counted,
                                   normalized, and analyzed in R (RRID:SCR_001905) using MAGeCK (v0.5.5) (Li et al., 2014). Hits
                                   were ranked by p-value from most depleted to most enriched in DoxR or EpiR after 7 days, and
                                   ranked lists were further analyzed for over-represented pathways using Gene Set Enrichment Analy-
                                   sis (RRID:SCR_003199, Mootha et al., 2003; Subramanian et al., 2005).

                                   Stable isotope tracer analysis
                                   Stable isotope tracer analyses (SITA) were performed in GC/MS as previously described
                                   (McGuirk et al., 2013). Briefly, cells were seeded in 6-well dishes to achieve 70–80% confluency
                                   after 48 hr. Media was then replaced by DMEM without glucose, sodium pyruvate or L-glutamine
                                   (Wisent #319–062) supplemented with 10% dialyzed FBS, 25 mM glucose, 1X sodium pyruvate, and
                                   4 mM glutamine for 2 hr to equilibrate metabolism. Media was further changed to equivalent
                                   labeled media made with either 25 mM [U-13C]-glucose or 4 mM [U-13C]-glutamine for the indicated
                                   time points. DMSO, doxorubicin, or epirubicin were present in the media throughout. Cells were
                                   washed twice with saline at 4˚C, quenched in 80% HPLC-grade methanol at 80˚C, sonicated, and
                                   centrifuged. Supernatants were supplemented with internal control (750 ng myristic acid-D27) and
                                   dried in a cold trap overnight (Labconco) at 1˚C. Pellets were solubilized in 10 mg/mL methoxy-
                                   amine-HCl in pyridine, incubated 30 min at 70˚C, and derivatized with N-tert-Butyldimethylsilyl-N-
                                   methyltrifluoroacetamide (MTBSTFA) for 1 hr at 70˚C. 1 mL was injected into an Agilent 5975C GC/
                                   MS in SCAN mode and analyzed using Chemstation (Agilent Techologies, RRID:SCR_015742) and
                                   Masshunter softwares (Agilent Technologies, RRID:SCR_015040).
                                      Tracing glutamine carbons to glutathione was done using a similar labeling method as above.
                                   Cells were washed twice with 150 mM ammonium formate buffer in HPLC water at 4˚C, quenched in
                                   50% HPLC-grade methanol at 20˚C on dry ice, and phase-separated using acetonitrile, water, and
                                   dichloromethane after vigorous bead-beating and vortexing. The aqueous phase was collected and

McGuirk et al. eLife 2021;10:e65150. DOI: https://doi.org/10.7554/eLife.65150                                                      17 of 29
Research article                                                                                                  Cancer Biology

                                   dried in a cold trap overnight at 1˚C. Pellets were solubilized in HPLC water and 5 mL was injected
                                   into an Agilent 6540 UHD Accurate-Mass Q-TOF LC/MS system coupled to ultra-high pressure liquid
                                   chromatography (UHPLC, 1290 Infinity LC System) and analyzed using Masshunter software.
                                      All isotopic corrections were performed using an in-house algorithm designed by SM as previ-
                                   ously described (McGuirk et al., 2013).

                                   Metabolomics
                                   Steady-state metabolite abundances were determined using GC/MS and LC/MS systems, using unla-
                                   beled media. Citric acid cycle, glycolytic intermediates, and fatty acids were measured in GC/MS as
                                   described above. Amino acids were measured in a Q-TOF system as described above. Nucleotide
                                   abundances were determined by washing 70–80% confluent 10 cm plates of cells with 150 mM
                                   ammonium formate at 4˚C, quenched in 80% HPLC-grade methanol at 80˚C on dry ice, after which
                                   the cell slurry was quickly transferred to tubes equilibrated in liquid nitrogen. After 24 hr, these were
                                   phase-separated using water and dichloromethane after vigorous bead-beating and vortexing. The
                                   aqueous phase was collected and flash-frozen in liquid nitrogen, then dried in a cold trap at 1˚C.
                                   Once dry, pellets were maintained at 80˚C and solubilized in HPLC water immediately before injec-
                                   tion into an Agilent 6430 Triple Quadrupole LC/MS system coupled to ultra-high pressure liquid
                                   chromatography (UHPLC, 1290 Infinity LC System) separation for fast targeted analysis.
                                      Glutathione levels were quantified using an Agilent 1100 series HPLC (Mailloux et al., 2014).
                                   Three days post-seeding, cells grown in 6-well plates were washed twice with ice-cold PBS, flash-fro-
                                   zen on dry ice and kept at 80˚C until further processing. Cells from parallel plates were counted for
                                   normalization. Cells were lysed on ice for 20 min using a mix of 125 mM sucrose, 1.5 mM EDTA, 5
                                   mM Tris, 0.5% TFA and 0.5% MPA in 50% mobile phase (10% HPLC grade methanol, 0.09% TFA –
                                   0.2 mm filtered). Lysates were then centrifuged for 20 min at 14,000 g, 4˚C. Each sample was run in
                                   duplicate on a Pursuit5 C18 column (150  4.6 mm, 5 mm; Agilent Technologies, Santa Clara, CA)
                                   with a 1 mL/min flow rate and detected at 215 nm. Standards were diluted in the same buffer and
                                   interpolated between the samples. All LC/MS data were analyzed using the Masshunter software
                                   (Agilent Technologies, RRID:SCR_015040).
                                      Media metabolite levels were determined using a BioProfile 400 Analyzer (BioNova). Briefly, 2 mL
                                   media was collected from cells after 72 hr incubation at 37˚C in a CO2 incubator. These were centri-
                                   fuged to remove any cell debris, and 1 mL was used to measure glucose, lactate, glutamine, gluta-
                                   mate, NH+4 , and H+ levels. To control for natural degradation of metabolites, values were compared
                                   to that of media incubated in parallel wells which contained no cells.

                                   Integrated metabolic network analysis
                                   Integrated metabolic network analysis was performed as previously described (Vincent et al., 2015)
                                   using the Shiny GAM application (https://artyomovlab.wustl.edu/shiny/gam/; Sergushichev et al.,
                                   2016) and visualized using Cytoscape (RRID:SCR_003032, Shannon et al., 2003). FDR was set to
                                     0.25 for metabolites and 3.9 for gene expression for comparison of DoxR and Control, and to
                                     0.1 and 3.4 respectively for comparison of EpiR and Control. Absent metabolite score was set to
                                     0.5 for all analyses.

                                   ROS measurements
                                   Cells were seeded in a 96-well dish for 48 hr prior to the experiment to achieve 75–80% confluence.
                                   Cells were maintained under normal drug conditions throughout. After PBS wash, cells were incu-
                                   bated with 20 mM CM-H2DCFDA (Thermo Fisher Scientific #C6827) in serum-free high-glucose
                                   DMEM for 30 min at 37˚C, covered in foil to prevent light exposure. Control wells without CM-
                                   H2DCFDA were supplemented with equivalent volume of DMSO. After 30 min, cells were washed
                                   with PBS and incubated an additional 30 min with high-glucose DMEM supplemented with either
                                   water or 0.03% (vol/vol) H2O2. Fluorescence was then measured in an Omega plate reader (BMG
                                   LabTech) at excitation/emission wavelengths of 495/520 nm.

                                   Immunoblots
                                   Total proteins from cultured cells were extracted with lysis buffer (50 mM Tris–HCl pH 7.4, 1% Triton
                                   X-100, 0.25% sodium deoxycholate, 150 mM NaCl, 1 mM EDTA) supplemented with inhibitors (2

McGuirk et al. eLife 2021;10:e65150. DOI: https://doi.org/10.7554/eLife.65150                                                       18 of 29
Research article                                                                                              Cancer Biology

                                   mg/mL pepstatin, 1 mg/mL aprotinin, 1 mg/mL leupeptin, 0.2 mM phenylmethylsulfonyl fluoride and 1
                                   mM sodium orthovanadate) and quantified using a BCA protein assay kit (Thermo Fisher Scientific
                                   #PI123225). The blots were incubated according to the manufacturer’s instructions with the following
                                   primary antibodies: PGC-1a (Calbiochem #ST1202, RRID:AB_2237237), PGC-1b (Millipore #ABC218,
                                   RRID:AB_2891214), and Actin (Santa Cruz Biotechnology #sc-1616, RRID:AB_630836) and with
                                   horseradish peroxidase-conjugated secondary antibodies (anti-mouse, KPL #KP-074–1806; anti-rab-
                                   bit, KPL #KP-074–1506; anti-goat, Abcam #ab6881, RRID:AB_955236). The results were visualized
                                   using Clarity ECL (Bio-Rad #1705060).

                                   Respirometry, bioenergetics, and JATP calculations
                                   Oxygen consumption rate (OCR) and extracellular acidification rate (ECAR) were measured using a
                                   Seahorse XFe96 Analyzer (Agilent Technologies, RRID:SCR_019545). Briefly, 10,000 cells were plated
                                   in 100 mL of their standard growth media and, after overnight culture, washed twice with XF media
                                   at pH 7.4, and equilibrated in XF media supplemented with 25 mM glucose, 4 mM glutamine, and
                                   sodium pyruvate (1X) at pH 7.4 in a CO2-free 37˚C incubator for 1 hr. Three sequential measure-
                                   ments of OCR and ECAR were taken to assay bioenergetics under basal, proton leak (1 mM oligomy-
                                   cin, Sigma Aldrich #O4876), maximal respiration (1 mM FCCP, Sigma Aldrich #C2920), OXPHOS
                                   inhibition (1 mM each rotenone and myxothiazol, Sigma Aldrich #R8875 and #T5580), and high glyco-
                                   lytic ATP demand (20 mM monensin, Sigma Aldrich #M5273) conditions. ECAR data was corrected
                                   for media buffering power as previously described (Mookerjee et al., 2016) and both OCR and
                                   ECAR were normalized on protein levels. ATP production rates (JATP), glycolytic index, bioenergetic
                                   capacity, and ATP supply flexibility were determined quantitatively as previously described
                                   (Mookerjee et al., 2017). Glutamine deprivations were performed over 4 hr in supplemented XF
                                   media as described above compared to media without supplemented glutamine, prior to measure-
                                   ment of OCR and ECAR as described.

                                   Immunofluorescence and quantification of mitochondrial volume
                                   Cells were seeded onto 18 mm #1.5 glass coverslips and placed in 12-well plates overnight, then
                                   fixed with 4% PFA for 15 min at 37˚C. Blocking and permeabilization was carried out by incubation
                                   with PBS containing 1% BSA and 0.5% Triton X-100. Mitochondria were visualized through staining
                                   with rabbit polyclonal anti-Tom20 antibody (Proteintech #11802–1-AP, RRID:AB_2207530) and goat
                                   anti-rabbit secondary antibody conjugated to Alexa Fluor 568 (Thermo Fisher Scientific #A-11011,
                                   RRID:AB_143157). Cytoplasm was visualized using HCS CellMask Green stain (Thermo Fisher Scien-
                                   tific #H32714), and nuclei were stained with DAPI. Coverslips were mounted onto microscope slides
                                   using ProLong Glass Antifade Mountant (Thermo Fisher Scientific #P36982) and kept at 4˚C in the
                                   dark until imaging. Images were taken with an Axio Observer Z1 epifluorescent microscope (Zeiss),
                                   using a 63x Plan-Apochromat oil objective. Deconvolution of images was carried out in Autoquant
                                   X2 software (MediaCybernetics, RRID:SCR_002465) using an adaptive PSF with 10 iterations. Seg-
                                   mentation and surface rendering of mitochondria, cytoplasm, and nuclei was performed in Imaris v8
                                   (Bitplane, RRID:SCR_007370).

                                   ChIP
                                   For ChIP analyses, chromatin was prepared from Control, DoxR, and EpiR cells maintained in drug
                                   prior harvesting. Standard ChIP was performed as described previously (Deblois et al., 2016). Quan-
                                   tification of ChIP enrichment by real-time quantitative PCR was carried out using the LightCycler480
                                   instrument (Roche). ChIPs are normalized against background enrichment on anti-IgG antibody ChIP
                                   control and average enrichment on two negative control unbound regions. The antibodies used are:
                                   anti-PGC1a (Santa Cruz Biotechnology #sc-13067, RRID:AB_2166218), anti-ERRa (Abcam
                                   #Ab76228, RRID:AB_1523580). The ChIP primers are listed in Supplementary file 3.

                                   siRNA knockdowns
                                   Cells were subjected to either 40 nM control siRNA (Dharmacon #D-001810–10- 05) or a combined
                                   40 nM pool of four siRNA specifically targeting PPARGC1A (Qiagen FlexiTube-GeneSolution
                                   #GS10891) and four siRNA specifically targeting PPARGC1B (Qiagen FlexiTube-GeneSolution

McGuirk et al. eLife 2021;10:e65150. DOI: https://doi.org/10.7554/eLife.65150                                                  19 of 29
Research article                                                                                                 Cancer Biology

                                   #GS133522). Cells were transfected using Lipofectamine RNAiMax (ThermoFisher #13778–150) and
                                   incubated for 72 hr before pursuing subsequent experiments.

                                   Statistical analyses
                                   All statistical analyses were performed using GraphPad Prism (GraphPad Software Inc, RRID:SCR_
                                   002798), Microsoft Excel (Microsoft Corporation, RRID:SCR_016137), or R (R Foundation for Statisti-
                                   cal Computing, RRID:SCR_001905 R Development Core Team, 2019).

                                   Acknowledgements
                                   SM was recipient of a Vanier Canada Graduate Scholarship (Canadian Institutes of Health Research,
                                   CIHR), Doctoral Training Award (Fonds de Recherche du Québec – Santé, FRQS), Canderel Student-
                                   ship Award (Goodman Cancer Research Centre, GCRC). YAD was supported by a Postdoctoral
                                   Training Award from FRQS. YX was supported by Rolande and Marcel Gosselin Graduate Student-
                                   ship and Charlotte and Leo Karassik Foundation Oncology Fellowship. KZ was supported by a Doc-
                                   toral Training Award (FRQS) and Gerald Clavet award (Faculty of Medicine, McGill University). JSP
                                   received salary support from FRQS and Canada Research Chair in Cancer and Metabolism. This
                                   work was supported by grants from CIHR (MOP-106603 to JSP; PJT-148650 to PS and JSP; MOP-
                                   130540 to SH) and Terry Fox Research Institute and Québec Breast Cancer Foundation (#242122 to
                                   JSP, PS, and VG). We acknowledge contributions from the Metabolomics Core Facility (MCF) of the
                                   GCRC, as well as technical assistance from Daina Avizonis, Mariana De Sa Tavares Russo, Gaëlle Bri-
                                   don, and Luc Choinière. The MCF is funded by the John R and Clara M Fraser Memorial Trust, Terry
                                   Fox Research Institute and Québec Breast Cancer Foundation (#242122 to JSP, PS, and VG), and
                                   McGill University. The authors thank Amadeo Parissenti for providing resistant cell lines, and Simon-
                                   Pierre Gravel, Ouafa Najyb, David Papadopoli, Sylvia Andrzejewski, Valérie Chénard, Tina Gruosso,
                                   Uri David Akavia, Russell G Jones, and Nicole Beauchemin for thoughtful discussions. The authors
                                   extend special thanks to the staff, students, and fellows of McGill University and of the University of
                                   Ottawa who enabled a safe environment to complete this study during the COVID-19 pandemic.

                                   Additional information
                                   Funding
                                   Funder                          Grant reference number     Author
                                   Canadian Institutes of Health   Vanier Scholarship         Shawn McGuirk
                                   Research
                                   Fonds de Recherche du Qué-     Doctoral Training Award    Shawn McGuirk
                                   bec - Santé
                                   McGill University               Canderel Studentship       Shawn McGuirk
                                                                   Award
                                   Fonds de Recherche du Qué-     Postdoctoral Training      Yannick Audet-Delage
                                   bec - Santé                    Award
                                   McGill University               Charlotte & Leo Karassik   Yibo Xue
                                                                   Foundation Oncology
                                                                   Fellowship
                                   McGill University               Rolande & Marcel Gosselin Yibo Xue
                                                                   Graduate Studentship
                                   Fonds de Recherche du Qué-     Doctoral Training Award    Kaiqiong Zhao
                                   bec - Santé
                                   McGill University               Gerald Clavet Award        Kaiqiong Zhao
                                   Fonds de Recherche du Qué-     Salary Award               Julie St-Pierre
                                   bec - Santé
                                   Canada Research Chairs          Tier 1 - Cancer and        Julie St-Pierre
                                                                   Metabolism
                                   Canadian Institutes of Health   MOP-106603                 Julie St-Pierre

McGuirk et al. eLife 2021;10:e65150. DOI: https://doi.org/10.7554/eLife.65150                                                     20 of 29
Research article                                                                                                 Cancer Biology

                                   Research
                                   Canadian Institutes of Health   PJT-148650                  Peter M Siegel
                                   Research                                                    Julie St-Pierre
                                   Canadian Institutes of Health   MOP-130540                  Sidong Huang
                                   Research
                                   Terry Fox Research Institute    242122                      Vincent Giguère
                                                                                               Peter M Siegel
                                                                                               Julie St-Pierre
                                   Quebec Breast Cancer Foun-      Grant with TFRI             Vincent Giguère
                                   dation                                                      Peter M Siegel
                                                                                               Julie St-Pierre

                                   The funders had no role in study design, data collection and interpretation, or the
                                   decision to submit the work for publication.

                                   Author contributions
                                   Shawn McGuirk, Conceptualization, Resources, Data curation, Formal analysis, Funding acquisition,
                                   Validation, Investigation, Visualization, Methodology, Writing - original draft, Project administration,
                                   Writing - review and editing; Yannick Audet-Delage, Formal analysis, Validation, Investigation, Visu-
                                   alization, Methodology, Writing - original draft, Project administration, Writing - review and editing;
                                   Matthew G Annis, Investigation, Methodology, Writing - review and editing; Yibo Xue, Investigation,
                                   Methodology; Mathieu Vernier, Formal analysis, Investigation, Visualization, Methodology, Writing -
                                   review and editing; Kaiqiong Zhao, Formal analysis, Visualization; Catherine St-Louis, Lucı́a Minar-
                                   rieta, Investigation, Writing - review and editing; David A Patten, Formal analysis, Validation, Writing
                                   - review and editing; Geneviève Morin, Methodology; Celia MT Greenwood, Resources, Supervision,
                                   Methodology, Writing - review and editing; Vincent Giguère, Peter M Siegel, Resources, Supervision,
                                   Funding acquisition, Writing - review and editing; Sidong Huang, Resources, Formal analysis, Super-
                                   vision, Funding acquisition, Visualization, Methodology, Writing - review and editing; Julie St-Pierre,
                                   Conceptualization, Resources, Supervision, Funding acquisition, Visualization, Writing - original draft,
                                   Project administration, Writing - review and editing

                                   Author ORCIDs
                                   Shawn McGuirk         https://orcid.org/0000-0002-7183-7962
                                   Yannick Audet-Delage          http://orcid.org/0000-0002-8467-6168
                                   Matthew G Annis         http://orcid.org/0000-0002-8776-004X
                                   Yibo Xue      http://orcid.org/0000-0003-4252-4446
                                   Mathieu Vernier       http://orcid.org/0000-0001-9356-7353
                                   Celia MT Greenwood           https://orcid.org/0000-0002-2427-5696
                                   Sidong Huang        http://orcid.org/0000-0002-2838-4726
                                   Peter M Siegel       http://orcid.org/0000-0002-5568-6586
                                   Julie St-Pierre     https://orcid.org/0000-0002-2815-7099

                                   Ethics
                                   Animal experimentation: Mice were housed in facilities managed by the McGill University Animal
                                   Resources Centre and all animal experiments were conducted under a University approved animal
                                   use protocol (AUP2012-5129) in accordance with guidelines established by the Canadian Council on
                                   Animal Care.

                                   Decision letter and Author response
                                   Decision letter https://doi.org/10.7554/eLife.65150.sa1
                                   Author response https://doi.org/10.7554/eLife.65150.sa2

McGuirk et al. eLife 2021;10:e65150. DOI: https://doi.org/10.7554/eLife.65150                                                      21 of 29
Research article                                                                                                          Cancer Biology

                                   Additional files
                                   Supplementary files
                                   . Supplementary file 1. PGC-1a supports therapeutic resistance across several cancer types.

                                   .   Supplementary file 2. List of primer sequences for RT-qPCR.
                                   .   Supplementary file 3. List of primer sequences for ChIP.
                                   .   Transparent reporting form

                                   Data availability
                                   Microarray data have been deposited in GEO under accession code GSE125187.

                                   The following dataset was generated:
                                                                                                                         Database and Identifier
                                   Author(s)            Year Dataset title                     Dataset URL
                                   McGuirk S, St-Pierre 2019 Gene expression data in         https://www.ncbi.nlm.       NCBI Gene Expression
                                   J                         Control, Doxorubicin-resistant, nih.gov/geo/query/acc.      Omnibus, GSE125187
                                                             and Epirubicin-resistant breast cgi?acc=GSE125187
                                                             cancer cells

                                   The following previously published dataset was used:
                                                                                                                              Database and
                                   Author(s)            Year Dataset title                         Dataset URL                Identifier
                                   Gruosso T, Kieffer   2016 Response to Neoadjuvant               https://www.ncbi.nlm.      NCBI Gene
                                   Y, Mechta-                Chemotherapy in Triple Negative       nih.gov/geo/query/acc.     Expression Omnibus,
                                   Grigoriou F               Breast tumors                         cgi?acc=GSE43816           GSE43816

                                   References
                                   Andrzejewski S, Klimcakova E, Johnson RM, Tabariès S, Annis MG, McGuirk S, Northey JJ, Chénard V, Sriram U,
                                     Papadopoli DJ, Siegel PM, St-Pierre J. 2017. PGC-1a promotes breast Cancer metastasis and confers
                                     bioenergetic flexibility against metabolic drugs. Cell Metabolism 26:778–787. DOI: https://doi.org/10.1016/j.
                                     cmet.2017.09.006, PMID: 28988825
                                   Ashton TM, McKenna WG, Kunz-Schughart LA, Higgins GS. 2018. Oxidative phosphorylation as an emerging
                                     target in Cancer therapy. Clinical Cancer Research 24:2482–2490. DOI: https://doi.org/10.1158/1078-0432.
                                     CCR-17-3070, PMID: 29420223
                                   Barrett-Lee PJ, Dixon JM, Farrell C, Jones A, Leonard R, Murray N, Palmieri C, Plummer CJ, Stanley A, Verrill
                                     MW. 2009. Expert opinion on the use of anthracyclines in patients with advanced breast Cancer at cardiac risk.
                                     Annals of Oncology 20:816–827. DOI: https://doi.org/10.1093/annonc/mdn728, PMID: 19153118
                                   Bosc C, Selak MA, Sarry JE. 2017. Resistance is futile: targeting mitochondrial energetics and metabolism to
                                     overcome drug resistance in Cancer treatment. Cell Metabolism 26:705–707. DOI: https://doi.org/10.1016/j.
                                     cmet.2017.10.013, PMID: 29117545
                                   Brand MD. 2000. Uncoupling to survive? The role of mitochondrial inefficiency in ageing. Experimental
                                     Gerontology 35:811–820. DOI: https://doi.org/10.1016/S0531-5565(00)00135-2
                                   Buescher JM, Antoniewicz MR, Boros LG, Burgess SC, Brunengraber H, Clish CB, DeBerardinis RJ, Feron O,
                                     Frezza C, Ghesquiere B, Gottlieb E, Hiller K, Jones RG, Kamphorst JJ, Kibbey RG, Kimmelman AC, Locasale
                                     JW, Lunt SY, Maddocks OD, Malloy C, et al. 2015. A roadmap for interpreting (13)C metabolite labeling
                                     patterns from cells. Current Opinion in Biotechnology 34:189–201. DOI: https://doi.org/10.1016/j.copbio.2015.
                                     02.003, PMID: 25731751
                                   Caro P, Kishan AU, Norberg E, Stanley IA, Chapuy B, Ficarro SB, Polak K, Tondera D, Gounarides J, Yin H, Zhou
                                     F, Green MR, Chen L, Monti S, Marto JA, Shipp MA, Danial NN. 2012. Metabolic signatures uncover distinct
                                     targets in molecular subsets of diffuse large B cell lymphoma. Cancer Cell 22:547–560. DOI: https://doi.org/10.
                                     1016/j.ccr.2012.08.014, PMID: 23079663
                                   De Vitto H, Bode AM, Dong Z. 2019. The PGC-1/ERR network and its role in precision oncology. Npj Precision
                                     Oncology 3:9. DOI: https://doi.org/10.1038/s41698-019-0081-6, PMID: 30911677
                                   Deblois G, Smith HW, Tam IS, Gravel SP, Caron M, Savage P, Labbé DP, Bégin LR, Tremblay ML, Park M,
                                     Bourque G, St-Pierre J, Muller WJ, Giguère V. 2016. Erra mediates metabolic adaptations driving lapatinib
                                     resistance in breast Cancer. Nature Communications 7:12156. DOI: https://doi.org/10.1038/ncomms12156,
                                     PMID: 27402251
                                   Drew R, Miners JO. 1984. The effects of buthionine sulphoximine (BSO) on glutathione depletion and xenobiotic
                                     biotransformation. Biochemical Pharmacology 33:2989–2994. DOI: https://doi.org/10.1016/0006-2952(84)
                                     90598-7

McGuirk et al. eLife 2021;10:e65150. DOI: https://doi.org/10.7554/eLife.65150                                                               22 of 29
You can also read