Microbiota-derived short chain fatty acids modulate microglia and promote Ab plaque deposition
←
→
Page content transcription
If your browser does not render page correctly, please read the page content below
RESEARCH ARTICLE

                                    Microbiota-derived short chain fatty acids
                                    modulate microglia and promote Ab
                                    plaque deposition
                                    Alessio Vittorio Colombo1, Rebecca Katie Sadler2, Gemma Llovera2,
                                    Vikramjeet Singh2, Stefan Roth2, Steffanie Heindl2, Laura Sebastian Monasor1,
                                    Aswin Verhoeven3, Finn Peters1, Samira Parhizkar4, Frits Kamp4,
                                    Mercedes Gomez de Aguero5, Andrew J MacPherson5, Edith Winkler1,4,
                                    Jochen Herms1,6,7, Corinne Benakis2, Martin Dichgans2,6, Harald Steiner1,4,
                                    Martin Giera3, Christian Haass1,4,6, Sabina Tahirovic1†*, Arthur Liesz2,6†*
                                    1
                                     German Center for Neurodegenerative Diseases (DZNE), Munich, Germany;
                                    2
                                     Institute for Stroke and Dementia Research (ISD), University Hospital, LMU Munich,
                                    Munich, Germany; 3Center for Proteomics and Metabolomics, Leiden University
                                    Medical Center (LUMC), Leiden, Netherlands; 4Metabolic Biochemistry, Biomedical
                                    Center (BMC), Faculty of Medicine, Ludwig-Maximilians-Universität München,
                                    Munich, Germany; 5Maurice Müller Laboratories (DKF), Universitätsklinik für
                                    Viszerale Chirurgie und Medizin Inselspital, Bern, Switzerland; 6Munich Cluster for
                                    Systems Neurology (SyNergy), Munich, Germany; 7Center for Neuropathology and
                                    Prion Research, Ludwig-Maximilians University Munich, Munich, Germany

                                    Abstract Previous studies have identified a crucial role of the gut microbiome in modifying
*For correspondence:
                                    Alzheimer’s disease (AD) progression. However, the mechanisms of microbiome–brain interaction in
sabina.tahirovic@dzne.de (ST);
                                    AD were so far unknown. Here, we identify microbiota-derived short chain fatty acids (SCFA) as
Arthur.Liesz@med.uni-muenchen.
de (AL)
                                    microbial metabolites which promote Ab deposition. Germ-free (GF) AD mice exhibit a substantially
                                    reduced Ab plaque load and markedly reduced SCFA plasma concentrations; conversely, SCFA
†
 These authors contributed          supplementation to GF AD mice increased the Ab plaque load to levels of conventionally colonized
equally to this work
                                    (specific pathogen-free [SPF]) animals and SCFA supplementation to SPF mice even further
Competing interest: See             exacerbated plaque load. This was accompanied by the pronounced alterations in microglial
page 18                             transcriptomic profile, including upregulation of ApoE. Despite increased microglial recruitment to
Funding: See page 18                Ab plaques upon SCFA supplementation, microglia contained less intracellular Ab. Taken together,
                                    our results demonstrate that microbiota-derived SCFA are critical mediators along the gut-brain
Received: 11 June 2020
                                    axis which promote Ab deposition likely via modulation of the microglial phenotype.
Accepted: 28 March 2021
Published: 13 April 2021

Reviewing editor: Peter
Turnbaugh, University of
California, San Francisco, United
                                    Introduction
States                              Alzheimer’s disease (AD) is a progressive neurodegenerative disorder characterized by the aggrega-
                                    tion and deposition of amyloid-b (Ab) and tau. The identification of several AD risk genes such as
   Copyright Colombo et al. This
                                    TREM2, CD33, or CR1 as key regulators of microglial function triggered mechanistic studies reveal-
article is distributed under the
                                    ing the contribution of the brain’s resident innate immune cells to AD pathology. In particular, trig-
terms of the Creative Commons
Attribution License, which          gering microglial phagocytic clearance of Ab can reduce amyloid plaque pathology (Daria et al.,
permits unrestricted use and        2017; Hansen et al., 2018). Besides the already well-acknowledged contribution of amyloidogenic
redistribution provided that the    protein processing and neuroinflammation to AD pathology, the gut microbiome is emerging as a
original author and source are      novel and highly relevant modifier of brain pathology. A key function of the gut microbiome has
credited.                           been established over the past decades in a number of neurological diseases spanning across

Colombo et al. eLife 2021;10:e59826. DOI: https://doi.org/10.7554/eLife.59826                                                      1 of 23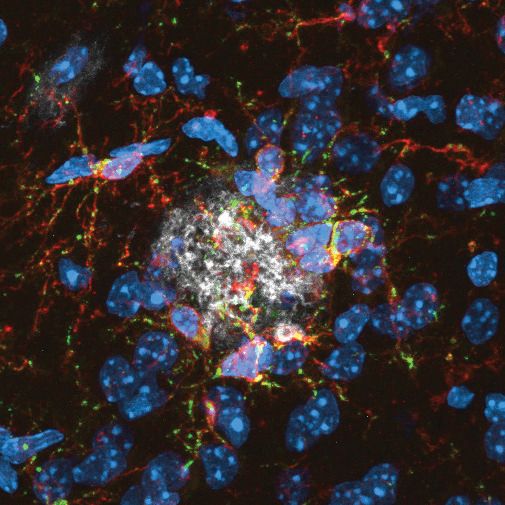
Research article                                                                      Immunology and Inflammation Neuroscience

                                   neurodevelopment, stroke, Parkinson’s disease, and neuropsychiatric disorders (Tremlett et al.,
                                   2017). For example, we have previously described an intricate bidirectional link between the gut
                                   and brain after acute stroke, where stroke changes the gut microbiota composition (Singh et al.,
                                   2016). In turn, post-stroke dysbiosis induced changes in the immune response to stroke. Most
                                   importantly, the gut microbiota composition can be modulated to improve the disease outcome in
                                   stroke and other neurological disorders (Benakis et al., 2020), a finding that was robustly repro-
                                   duced across disease entities and laboratories (Cryan and O’Mahony, 2011).
                                       Only recently, a role of gut microbiota was also established in AD. AD patients have an altered
                                   gut microbiome compared to matched control patients, characterized by reduced species diversity
                                   and an increased abundance of Bacteroidetes (Vogt et al., 2017). Similar findings were obtained in
                                   5xFAD and APPPS1 amyloidosis mouse models (Brandscheid et al., 2017; Harach et al., 2017).
                                   Other studies have identified that antibiotic treatment-induced changes in microbiota composition
                                   as well as microbial deficiency in germ-free (GF) animals were associated with reduced Ab pathology
                                   (Dodiya et al., 2019; Harach et al., 2017; Minter et al., 2017; Minter et al., 2016). This effect
                                   could result from reduced Ab production or increased clearance. Interestingly, GF animals as well as
                                   antibiotic-mediated dysbiotic animals exhibited reduced microglial activation (Minter et al., 2017).
                                   While previous studies documented a link between the gut microbiome and Ab pathology, the
                                   underlying mechanisms and molecular mediators remain elusive. To address this key question, we
                                   generated a GF amyloidosis mouse model which allowed us to explore and identify bacterial metab-
                                   olites that mediate gut-brain axis in AD. Moreover, we performed a detailed analysis of the gut
                                   microbiome’s impact on amyloidogenesis and neuroinflammation, in order to differentiate between
                                   direct effects on Ab generation and effects mediated via microglial cells. Our findings identify micro-
                                   biota-derived short chain fatty acids (SCFA), bacterial fermentation products of fiber, as the sufficient
                                   mediator to promote Ab plaque deposition. We further identified microglial transcriptomic and func-
                                   tional alterations that may underscore increased Ab deposition triggered by SCFA.

                                   Results
                                   The gut microbiome promotes AD pathology
                                   In order to study mechanisms of microbiota–brain interaction in AD, we generated a GF amyloidosis
                                   mouse model (APPPS1) by embryo transfer into axenic mice. GF APPPS1 mice were generated inde-
                                   pendent of previous studies using a similar approach (Harach et al., 2017; Minter et al., 2016). In
                                   accordance with these reports, we also observed a striking reduction in cerebral Ab plaque load in 5
                                   months old GF APPPS1 animals compared to their littermate GF APPPS1 animals which have been
                                   naturally recolonized (Rec) or APPPS1 mice housed under conventional, specific pathogen-free (SPF)
                                   conditions (Figure 1A). Although not powered to specifically investigate sex differences, an increase
                                   of plaque load by bacterial colonization was apparent also in a sex-specific analysis (Figure 1—fig-
                                   ure supplement 1). Correspondingly, GF APPPS1 mice demonstrated a significantly better cognitive
                                   performance in a spatial memory task compared to recolonized and SPF mice (Figure 1B). We fur-
                                   ther analyzed the size distribution of Ab plaques between the GF and SPF animals using an auto-
                                   mated analysis paradigm of three-dimensional plaque segmentation and quantification in the frontal
                                   cortex (Peters et al., 2018) (Figure 1C). This showed that GF mice display a significantly decreased
                                   density of small (4–8 mm) Methoxy-X04-positive plaques compared to SPF, while larger plaques were
                                   not affected (Figure 1D). This result suggests that bacterial colonization might preferentially affect
                                   plaque formation rather than plaque growth.

                                   SCFA are bacterial metabolites contributing to AD pathology
                                   As our initial experiments indicated a specific effect of the gut microbiome on the formation of small
                                   plaques, we focused our mechanistic studies on the early phase of Ab plaque deposition, which cor-
                                   responds to the 3 months of age in APPPS1 mouse model. Previous studies have demonstrated that
                                   SCFA (acetate, butyrate, and propionate) are metabolites produced by the gut microbiota which are
                                   critical mediators in various brain diseases such as stroke, Parkinson’s disease, and neuropsychiatric
                                   disorders (Dalile et al., 2019). Therefore, we quantitatively analyzed the total plasma SCFA concen-
                                   trations of acetate, butyrate, and propionate (C:2 C:4 SCFA) using gas chromatograph/mass spec-
                                   trometry (GC/MS) based analysis in GF, recolonized and SPF mice. We observed an increase in

Colombo et al. eLife 2021;10:e59826. DOI: https://doi.org/10.7554/eLife.59826                                                        2 of 23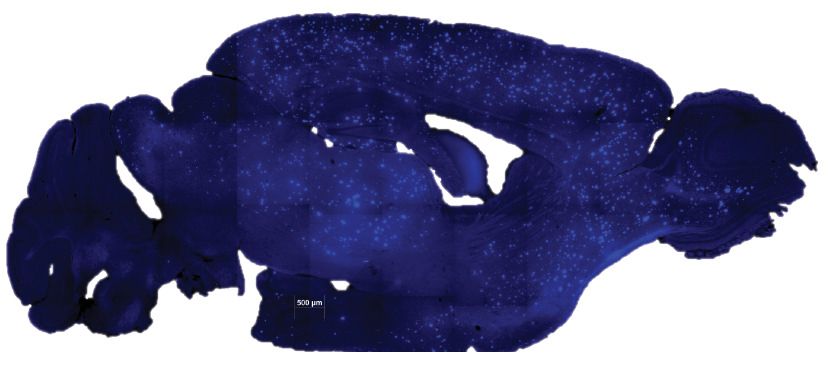
Research article                                                                                                                                                           Immunology and Inflammation Neuroscience

   A
                                                                                                                                                     250                      p=0.0057
                                                                                                                                                                         p=0.0001
                                                                                                                                                     200

                                                                                                                             % Plaque load
                                                                                                                                                     150

                                                                                                                                                     100

                                                                                                                                                                    50
    GF                          Rec                         SPF                                                    200 µm

                                                                                                                                                                     0
                                                                                                                                                                         GF     Rec SPF
   B
                                                                                                                                                                              p=0.0008
                                                                                                                                                                    12

                                                                                                                                 Frequency of error zone entering
                                                                                                                                                                         p=0.0108

                                                                                                                                                                    10

                                                                                                                                                                    8

                                                                                                                                                                    6

                                                                                                                                                                    4

                                                                                                                                                                    2

                 GF                         Rec                                                SPF                                                                  0
                                                                                                                                                                         GF     Rec      SPF

   C                                                               D
                                                                                                      3000    *   p=0.0198
                                                                                                                                                                                      GF
                                                                       Plaque density (plaques/mm3)

                                                                                                                                                                                      SPF

                                                           500µm                                      2000

                                                                                                      1000

                                                                                                         0
                                                                                                             4-8        8-12 12-16 16-20 20-24
                                                                                                                   Bins for plaque radius (µm)

Figure 1. Germ-free APPPS1 mice show reduced Alzheimer’s disease (AD) pathology. (A) Representative images and analysis of brain cortices from 5
months old germ-free (GF), naturally recolonized (Rec) and conventionally colonized (specific pathogen-free [SPF]) APPPS1 mice immunostained for Ab
(clone 6E10). Quantification of parenchymal plaque load reveals significantly reduced Ab burden in GF mice compared to the Rec and SPF groups.
Values are expressed as percentages of amyloid plaque area and normalized to GF group (ANOVA; n(GF) = 9, n(Rec) = 6, n(SPF) = 9). (B)
Representative results and quantification from Barnes maze behavioral analysis of 5 months old GF, Rec and SPF APPPS1 mice. Quantification of
frequency of error zone entering in the Barnes maze reveals a better performance in GF mice compared to Rec and SPF mice (ANOVA; n(GF) = 6, n
(Rec) = 8, n(SPF) = 6). (C) Sagittal overview image indicating the analysis ROIs in the frontal cortex (blue: Methoxy-X04-positive plaques) and
representative image demonstrating segmentation of Methoxy-X04 fluorescence intensity into individual plaques. The images show maximal intensity
projections. Individual plaques are labeled with different colors. (D) Frequency distribution of plaque radius in 5 months old GF and SPF APPPS1 mice
(two-way ANOVA; n(GF) = 5, n(SPF) = 5). All data are derived from at least three individual experiments and presented as mean ± SEM.
The online version of this article includes the following figure supplement(s) for figure 1:
Figure supplement 1. Sex-specific analysis of amyloid plaque load.

                                      plasma concentrations for all three SCFA in SPF APPPS1 mice compared to GF conditions
                                      (Figure 2A). In order to study a causal link between SCFA and Ab deposition, we performed a SCFA
                                      supplementation experiment by providing SCFA to GF APPPS1 mice. We used a combination of all
                                      three SCFA (Figure 2B), because all three were affected in plasma by bacterial colonization and this
                                      combination was also used by us and others in previous studies (Erny et al., 2015; Sadler et al.,
                                      2020). In accordance with previous reports, the used amounts of supplemented SCFA in the

Colombo et al. eLife 2021;10:e59826. DOI: https://doi.org/10.7554/eLife.59826                                                                                                                                          3 of 23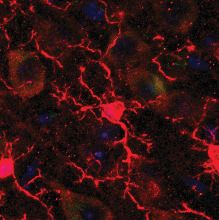
Research article                                                                                  Immunology and Inflammation Neuroscience

    A                                                                                                B
                                            Acetate         Propionate          Butyrate
                                    250                30                 20                                                   25.9mM Sodium proprionate
                                            p=0.0076                      18                                                       40mM Sodium butyrate
        Plasma concentration (PM)

                                    200                25                 16                                                       67.5mM Sodium acetate
                                                       20                 14
                                    150                                   12
                                                       15                 10
                                    100   p=0.0001                         8
                                                       10                  6
                                    50                                     4                                                 4 weeks old                                   12 weeks old
                                                       5                                                              (supplementation begins)                               (sacrifice)
                                                                           2
                                      0                0                   0
                                          GF Rec SPF        GF Rec SPF         GF Rec SPF

                                                                                                                                                               350        p=0.0397
    C
                                                                                                                                                               300   p=0.0079

                                                                                                                                                               250

                                                                                                                                               % Plaque load
                                                                                                                                                               200
                                                                                                                                                               150
                                                                                                                                                               100

               GF                                              Rec                              GF+SCFA                               200 µm                   50
                                                                                                                                                                0
                                                                                                                                                                     GF     Rec GF +
                                                                                                                                                                                SCFA

   D                                                                                                            300    p=0.01142

                                                                                                                250
                                                                                                % Plaque load

                                                                                                                200

                                                                                                                150

                                                                                                                100

                SPF                                                                    200 µm                   50
                                                               SPF+SCFA
                                                                                                                 0
                                                                                                                      Ctrl     SCFA
                                                                                                                             SPF

Figure 2. Short chain fatty acids (SCFA) are mediators of Ab plaque deposition. (A) Plasma SCFA concentrations of acetate, butyrate, and propionate
were quantified using GC/MS-based metabolomics analysis, showing an increase in specific pathogen-free (SPF) compared to germ-free (GF) mice
(ANOVA; n(GF) = 4, n(Rec) = 5, n(SPF) = 4; two individual experiments). (B) Experimental plan for SCFA supplementation in GF mice. Four weeks old
GF mice have been treated with SCFA in drinking water for 8 weeks. (C) Representative images from GF (control-treatment), Rec, and GF
supplemented with SCFA mice showing a significant increase in Ab plaque load upon SCFA administration (ANOVA; n(GF) = 7, n(Rec) = 9, n(GF
+SCFA) = 6; three individual experiments). (D) SPF APPPS1 mice were supplemented with control or SCFA in drinking water for 4 weeks (from 8 to 12
weeks of age). Histological analysis revealed a significantly increased plaque load in SCFA-supplemented SPF mice compared to control treatment
(unpaired T-test; n(Ctrl) = 4, n(SCFA) = 5; one individual experiment). All data in this figure are presented as mean ± SEM.
The online version of this article includes the following figure supplement(s) for figure 2:
Figure supplement 1. Total short chain fatty acids (SCFA) concentrations.

Colombo et al. eLife 2021;10:e59826. DOI: https://doi.org/10.7554/eLife.59826                                                                                                              4 of 23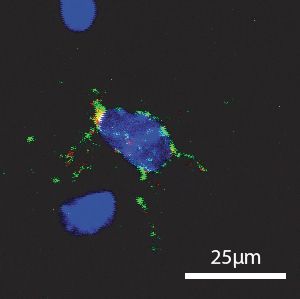
Research article                                                                      Immunology and Inflammation Neuroscience

                                   drinking water were sufficient to normalize plasma SCFA levels comparable to SPF mice (Figure 2—
                                   figure supplement 1). Strikingly, SCFA supplementation of GF APPPS1 mice was sufficient to nearly
                                   double cerebral Ab plaque load (Figure 2C). Next, we treated SPF APPPS1 mice (4 weeks supple-
                                   mentation, starting at 8 weeks of age) in order to test a bona fide disease-promoting function of
                                   SCFA. Indeed, SCFA treatment of SPF mice significantly increased plaque load compared to control-
                                   treated SPF mice, revealing the potential of SCFA to worsen Ab pathology in APPPS1 mice
                                   (Figure 2D). Taken together, our results demonstrate that SCFA are sufficient to mediate effects of
                                   bacterial gut colonization onto Ab pathology.

                                   SCFA mildly increase amyloidogenic processing
                                   After identifying SCFA as the key and sufficient mediator of the gut microbiome’s effect on Ab
                                   pathology, we aimed to identify the underlying mechanism. First, we explored potential direct
                                   effects of SCFA on amyloid precursor protein (APP) expression and processing by immunoblot analy-
                                   sis of brain tissue of GF APPPS1 mice with SCFA or control supplementation (Figure 3A,B). In accor-
                                   dance with the histological plaque load analysis, we identified markedly increased Ab levels in SCFA-
                                   compared to control-supplemented GF APPPS1 mice. However, levels of the full-length APP
                                   (APP FL) were comparable between the groups. We observed only a mildly reduced ratio of the APP
                                   C-terminal fragment (CTFs) C83 (** in Figure 3A, produced by ADAM10 cleavage) and C99 (* in
                                   Figure 3A, produced by BACE1 cleavage). However, this slightly increased amyloidogenic APP proc-
                                   essing upon SCFA supplementation to GF APPPS1 mice is unlikely to explain alone the substantially
                                   increased levels of Ab (Figure 3B). We further analyzed protein levels of secretases responsible for
                                   APP processing (BACE1, ADAM10, and a catalytic subunit of g-secretase PSEN1), but could not
                                   detect any alterations upon the SCFA supplementation of GF APPPS1 mice (Figure 3A,B). More-
                                   over, using an in vitro g-secretase activity assay (Figure 3C), we show that addition of SCFA does
                                   not change g-secretase activity or processivity as reflected by comparable levels of total Ab and
                                   unaltered profiles of Ab species (Ab37, 38, 40, and 42/43) in this cell free assay. In contrast to a pre-
                                   vious study (Ho et al., 2018), we could exclude a direct effect of SCFA on Ab aggregation
                                   (Figure 3D) as similar Ab aggregation kinetics were determined in the presence or absence of SCFA
                                   in a Thioflavin T aggregation assay. Taken together, our data suggest that increased levels of Ab
                                   triggered by SCFA in vivo are not mediated by major quantitative or qualitative changes in Ab pro-
                                   duction but may rather be triggered by alterations in Ab deposition and clearance.

                                   SCFA supplementation results in increased microglial activation
                                   Given the critical role of microglia in AD and a demonstrated link between microglial function and
                                   Ab pathology, we next focused on microglia as the potential cellular mediators of the SCFA effect
                                   on Ab pathology (Dodiya et al., 2019). First, we observed that microglia in SCFA-supplemented GF
                                   APPPS1 mice had a significantly increased circularity index (CI; i.e. more amoeboid shape) indicating
                                   a more activated microglial phenotype (Figure 4A). We combined single molecule fluorescent in situ
                                   hybridization (smFISH, for microglial identification by Cx3cr1 expression) and immunofluorescence
                                   (for plaque identification by staining with anti-Ab 2D8 antibody) to visualize and quantify clustering
                                   of microglia around Ab plaques. We observed increased microglial recruitment to Ab plaques in
                                   SCFA- compared to control-treated APPPS1 GF mice (Figure 4B). Next, we investigated the influ-
                                   ence of bacterial colonization on microglial reactivity in the WT background. To this end, we injected
                                   brain homogenates from 8 months old APPPS1 mice containing abundant Ab into the hippocampus
                                   of GF or SPF WT mice (Figure 4C) and subsequently analyzed microglial abundance and Trem2
                                   mRNA expression as a marker of microglial activation by smFISH. We observed a significant increase
                                   in overall microglial cell counts at the peri-injection site of SPF compared to GF WT mice
                                   (Figure 4D). Moreover, microglia in SPF mice expressed significantly more Trem2 mRNA puncta per
                                   microglia compared to GF WT mice (Figure 4E). Next, we questioned whether this SCFA-induced
                                   change in microglial recruitment and reactivity might also be associated with an altered phagocytic
                                   capacity of microglia, which is one of the most intensively investigated microglial functions in the
                                   context of AD. Therefore, we assessed the recruitment of microglia to Ab plaques and their phago-
                                   cytic uptake. This was analyzed by SCFA- or control-treatment in SPF APPPS1 mice to avoid poten-
                                   tial counteracting effects of GF mice on microglial recruitment or phagocytosis. Corresponding to
                                   the increased recruitment and reactivity in GF SCFA-supplemented mice, we also observed a

Colombo et al. eLife 2021;10:e59826. DOI: https://doi.org/10.7554/eLife.59826                                                        5 of 23
Research article                                                                                                           Immunology and Inflammation Neuroscience

    A                               GF                                    B
                        Ctrl                      SCFA                                                    500                            p=0.007                APP FL
                                                                                                          450                                                   PSEN1
                                                              APP FL                                      400                                                   C83/C99

                                                                                Relative quantification
   100kDa
                                                                                                          350                                                   AE
                                                           * CTFs

                                                                                    (% of control)
    10kDa                                                  **                                             300                                                   BACE1
                                                                                                          250                                                   ADAM10 (m)
        5kDa                                                  AE                                                                  p=0.001
                                                                                                          200
    64kDa
                                                              BACE1                                       150
                                                           im                                             100
    78kDa                                                     ADAM10
                                                           m                                              50
    25kDa                                                     PSEN1                                        0
                                                                                                                       Ctrl                         SCFA
                                                              Calnexin                                                                   GF

    C                                                                     D                         150
                                 SCFA                                                                                                              Ctrl
                                                                                                                                                   SCFA GF
                                375 µM

                                         750 µM

                                                                          flourescence (a.u.)
                                                                           Normalised ThT
                         Ctrl
                  GSI

                                                                                                    100
    17kDa                                           C100-His 6

                                                                                                          50
        5kDa                                        AE

    17kDa                                           C100-His 6
                                                                                                          0
                                                    AE37                                                       0   2             4            6        8
                                                    AE38                                                                      Time (h)
                                                    AE40
                                                    AE42/43

Figure 3. Short chain fatty acids (SCFA) mildly increase amyloidogenic processing. (A) Western blot analysis and (B) its densitometry quantification of 3
months old brain homogenates of control (Ctrl)- and SCFA-supplemented germ-free (GF) APPPS1 animals. The Ab level is significantly increased in
SCFA group in comparison to Ctrl, despite unaffected APP FL levels. APP CTFs show a decreased C83 (**) to C99 (*) ratio. We could not detect
alterations in protein levels of secretases involved in APP processing (ADAM10, BACE1, and g-secretase/PSEN1). m = ADAM10 mature form; im =
ADAM10 immature form. Data represent mean ± SEM (unpaired T-test; n(Ctrl) = 3, n(SCFA) = 3). (C) Upper panel: g-Secretase reconstituted into lipid
vesicles was incubated at 37˚C together with the C99-based substrate C100-His6 in the presence of increasing doses of a SCFA mixture (375 and 750
mM final concentration of total SCFA of an equimolar mixture of Na-acetate, Na-propionate, and Na-butyrate) for 24 hr. Production of Ab was analyzed
by immunoblotting. g-Secretase inhibitor (GSI) L-685,458 (0.4 mM) was used as a negative control. No alterations in Ab levels were detected in the
presence of SCFA. Lower panel: Qualitative analysis of individual Ab species via Tris-Bicine-Urea SDS-PAGE reveals that SCFA treatment does not alter
the ratio among the different Ab species (Ab37-38-40-42/43) suggesting no direct effects on modulation of g-secretase cleavage. (D) Aggregation
kinetics of monomeric Ab40 recorded by the increase in fluorescence of Thioflavin T incubated with either 30 mM NaCl (Ctrl) or 30 mM SCFA mixture
do not show any significant difference, suggesting that SCFA do not directly modify Ab fibrillarization. Data points represent mean ± SD from three
independent experiments.

                                                    significantly increased microglial recruitment to Ab plaques in SCFA-supplemented SPF
                                                    APPPS1 mice (Figure 4F). In contrast to control-treated mice, we detected significantly less micro-
                                                    glia with intracellular Ab in SCFA-treated mice that is in accordance with the increased Ab pathology
                                                    (Figure 4F right). However, when using an ex vivo amyloid plaque clearance assay, we did not

Colombo et al. eLife 2021;10:e59826. DOI: https://doi.org/10.7554/eLife.59826                                                                                                6 of 23
Research article Immunology and Inflammation Neuroscience
A B
0.04 p=0.0152
15 Cx3cr1 mRNA particle
Iba-1+ cell circularity index
Image from steffi 35 p=0.0168
8 Aȕ
0.03 DAPI 30
Cx3cr1+ cells/ field of view
14
9
5 1 25
0.02 13
4 2 20
12 3
0.01 6 15
area 11 7
20 µm perimeter 10 10
0.00
Ctrl SCFA 5
GF 0
Ctrl SCFA
10 µm GF
C D
25 p=0.0003
Cx3cr1+ cells/ analysis area
20
CA1 15
CA2 10
DG CA3 5
Analysis area
Injection site 0
0 18
Cx3cr1+ cells per FOV GF SPF
E
Cx3cr1 Trem2
20 p< 0.0001
puncta/microglia
15
Trem2 mRNA
10
DAPI Merge
5
0
25 µm GF SPF
F
p=0.0027
180 p=0.0096 120
CD68 Iba1 AE Hoechst
160
100
% Recruited microglia
140
% microglia AE pos.
120 80
100
60
80
60 40
40
20
20
10 µm 0 0
SPF SPF+SCFA Ctrl SCFA Ctrl SCFA
SPF SPF
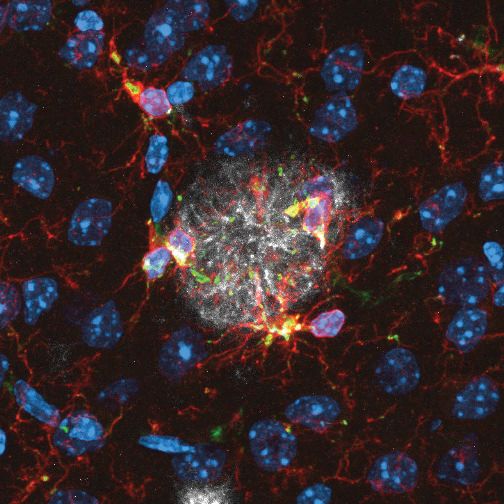
Figure 4. Short chain fatty acids (SCFA) modulate microglia. (A) Morphological analysis of microglia shows an increase in the circularity index, indicating
a more activated phenotype, in SCFA- compared to control-treated germ-free (GF) APPPS1 mice. Iba1 (red) has been used as microglial marker. For
each group, each shade of color represents the microglia from a single mouse (U test; n(Ctrl) = 6, n(SCFA) = 5). (B) smFISH analysis of microglial cells
(red, Cx3cr1 mRNA particles) surrounding amyloid plaques (green, anti-Ab clone 2D8) shows an increased number of Cx3cr1-positive cells (>4 puncta)
Figure 4 continued on next page
Colombo et al. eLife 2021;10:e59826. DOI: https://doi.org/10.7554/eLife.59826 7 of 23Research article Immunology and Inflammation Neuroscience
Figure 4 continued
clustering around Ab plaques in SCFA- compared to control-supplemented GF APPPS1 mice. DAPI (blue) was used as nuclear dye (U test; n(Ctrl) = 5, n
(SCFA) = 5 mice, 5 FOV per mouse). (C) Experimental outline for APPPS1 brain homogenate injection into a WT mouse brain showing the injection site
(red dot). (D) smFISH analysis of Cx3cr1-positive cells (>4 puncta) surrounding the APPPS1 brain homogenate injection site (analysis area relative to
injection site for all brains) showing an enhanced recruitment of microglial cells in specific pathogen-free (SPF) versus GF WT mice. (E) APPPS1 brain
homogenate injection induces higher microglial activation in SPF in comparison to GF WT mice as shown by the higher amount of Trem2 mRNA puncta
(red) per Cx3cr1-positive (green) microglia. DAPI (blue) was used as nuclear dye. In D and E, each different shade of color represents the microglia from
a single mouse (U test, n(GF) = 3, n(SPF) = 3; two individual experiments, 120 analyzed images (with multiple microglia) per mouse). (F) Microglial
recruitment and Ab plaque uptake were histologically quantified in SCFA- and control-supplemented SPF APPPS1 mice. Although significantly more
CD68-positive (green) and Iba1-positive (red) microglial cells were located at Ab plaques (white, anti-Ab clone 3552), the number of Ab-positive
microglia was significantly reduced in the SCFA- compared to the control-treated group. Values are expressed as percentages and normalized to the
control-treated group (unpaired T-test; n(Ctrl) = 4, n(SCFA) = 5; one individual experiment).
The online version of this article includes the following figure supplement(s) for figure 4:
Figure supplement 1. Ex vivo amyloid plaque clearance assay.
detect a direct effect of SCFA-treatment on the phagocytic capacity of microglia (Figure 4—figure
supplement 1).
Microglia-derived ApoE expression is increased upon supplementation
by SCFA
To analyze the effect of SCFA on microglia in more detail, we performed a transcriptome Nanostring
analysis of brain samples from control- and SCFA-supplemented GF APPPS1 mice at 3 months of
age. Corresponding to the results of the smFISH and histological analysis (Figure 4A,B), we found
numerous candidate genes previously associated with microglial activation to be upregulated in
SCFA-supplemented APPPS1 animals (Figure 5A,B). Many of the most abundantly regulated micro-
glial genes were associated with secretory functions (chemokines and complement factor secretion)
and with pathogen recognition (e.g. Tlr7, Trem2, Tyrobp, and Myd88) (Figure 5B). A biological net-
work analysis revealed upregulation of ApoE and subsequent activation of the ApoE-TREM2 path-
way as a central biological pathway effected by SCFA (Figure 5C). In accordance with the
transcriptomic data, we further confirmed an increase in ApoE protein expression in SCFA- com-
pared to control-supplemented GF APPPS1 mice by immunohistochemistry (Figure 5D). Previous
studies have indicated astrocytes and microglia as major sources of cerebral ApoE (Holtzman et al.,
2012; Shi and Holtzman, 2018). Therefore, we analyzed by immunohistochemistry the amounts of
ApoE protein in control- and SCFA-supplemented GF APPPS1 mice and detected an increase of
ApoE coverage colocalizing with microglial cells but not with GFAP-positive astrocytes. Correspond-
ingly to bacterial colonization at 5 months of age (Figure 1D), also SCFA treatment of 3 months old
APPPS1 mice resulted specifically in an increase of small plaques (4–8 mm radius) (Figure 5F).
A direct effect of SCFA on the microglial transcriptomic profile was further confirmed by treating
cultured primary microglia from SPF WT mice with SCFA. As expected and previously described, the
overall transcriptomic profile between microglia in vitro differed from the in vivo profile, as also illus-
trated by the reduced ApoE expression (Bohlen et al., 2017; Butovsky et al., 2014). Nevertheless,
the combined SCFA treatment induced a pronounced upregulation of genes previously associated
with inflammatory functions of microglia (Figure 5—figure supplement 1A). Next, using this model
system, we compared the impact of individual SCFA (acetate, butyrate, and propionate) and the
combined treatment on the microglial transcriptome. Analysis of individual genes as well as biologi-
cal processes by pathway analysis revealed a more abundant overlap of butyrate and propionate
than acetate with the combined SCFA treatment effect (Figure 5—figure supplement 1B,C). Yet,
none of the individual SCFA effects were sufficient to achieve the changes in the transcriptomic pro-
file of the combined SCFA treatment, suggesting a synergistic effect of single SCFA on modulating
microglia.
Discussion
Recent studies have demonstrated a key role of the gut microbiome in Ab pathology in AD. How-
ever, the mechanisms by which the microbiome modulates disease progression and the molecular
Colombo et al. eLife 2021;10:e59826. DOI: https://doi.org/10.7554/eLife.59826 8 of 23Research article Immunology and Inflammation Neuroscience
A Cluster 1 Cluster 2 B Top 20 upregulated genes (SCFA/control)
2
ApoE Hmgb1
log2FC
Trem2
Clec7a
Tlr7
CD68
Tyrobp
0
Sumo1
Fkbp3
Lilrb4a
Ccl3
C4a
Clec7a
Trem2
Tyrobp
C1qa
Cd68
Mpeg1
Mafb
C1qb
CD14
Ctss
Ptpn6
Ptprc
Inpp5d
Mertk
Tlr7
ApoE
C1qa
C4a Myd88
Mafb
Hdac1
C1qb
NFkB (complex)
CD14
C APOE
CD83
C3a FKBP5
C1qc TREM2 CD14 CASP7 TLR7
Ccl3 LDL
MYD88
IRAK4
Cd86
Casp7 TYROBP CD86
IFNȖ MERTK
Icam2
C1q IFNĮ
CD68
Fcrls
Cd83
Tspan18
C4A/C4B LILRB4 IRF8
Ctrl SCFA CLEC7A
GF
Relative expression Ttr
Ctrl SCFA
min max
GF
D
140 p=0.0448
120
(ApoE area mm2)
100
ApoE
80
60
40
50µm 20
0
Ctrl SCFA
GF
E F
Microglia Astrocytes
90 100
Plaque density (plaques/mm3)
p=0.0165 p=0.3132
2500 * p< 0.0001
80 90
80 Ctrl
ApoE coverage (mm2)
ApoE coverage (mm2)
70 2000 SCFA GF
60 70
60 1500
50
50 1000
40
40
30 30 500
20 20
0
10 10 4-8 8-12 12-16 16-20 20-24
0 0 Bins for plaque radius (µm)
Ctrl SCFA Ctrl SCFA
GF GF
Figure 5. Increased ApoE expression marks microglial activation upon short chain fatty acids (SCFA) supplementation. (A) Heatmap of Nanostring
transcriptomic analysis from control- and SCFA-supplemented germ-free (GF) APPPS1 mice at 3 months of age. Row values were scaled using unit
variance scaling. Genes previously associated with microglial function have been annotated on the heatmap. Three mice per group have been
analyzed. (B) Top 20 upregulated genes in SCFA- versus control-treated samples. Most of transcriptome hits have been previously associated with
Figure 5 continued on next page
Colombo et al. eLife 2021;10:e59826. DOI: https://doi.org/10.7554/eLife.59826 9 of 23Research article Immunology and Inflammation Neuroscience
Figure 5 continued
microglial activation. (C) Functional gene interaction network analysis using Ingenuity Pathway Analysis. Genes are colored based on fold-change values
determined by RNA-Seq analysis, where red indicates an increase in SCFA- and green in control-treated animals. Network analysis revealed
upregulation of the ApoE-TREM2 axis as one of the principal biological pathways upregulated by SCFA. (D) Representative sagittal brain section
indicating location of the analyzed region of interest in the frontal cortex and representative image showing ApoE (green) distribution. Quantification of
ApoE signal showed a SCFA-dependent increase of ApoE expression (unpaired T-test; n(Ctrl) = 5, n(SCFA ) = 5; three individual experiments). (E)
Quantification of ApoE colocalization (absolute coverage area in mm2) with microglia and astrocytes in control- and SCFA-supplemented GF APPPS1
mice at 3 months of age (unpaired T-test; n(Ctrl) = 5, n(SCFA) = 5; two individual experiments). (F) Analysis of Methoxy-X04-stained brain sections
showed a specific increase in plaques of smaller sizes (4–8 mm radius) in 3 months old SCFA- compared to Ctrl-supplemented GF APPPS1 mice
(unpaired T-test per bin; n(Ctrl) = 5, n(SCFA) = 5; three individual experiments). Data represent mean ± SEM.
The online version of this article includes the following figure supplement(s) for figure 5:
Figure supplement 1. Effect of individual short chain fatty acids (SCFA) on microglial polarization.
mediators along the gut-brain axis have remained unknown. In this study, we identified microbiota-
derived SCFA as microbial metabolites contributing to Ab plaque deposition in the brain. GF
APPPS1 mice have markedly reduced SCFA concentrations and reduced plaque load, and supple-
mentation with SCFA is sufficient to mimic the microbiome’s effect and increase Ab plaque burden.
We identified microglia as the key cell population responsive to SCFA and increased microglial
ApoE may mediate accelerated Ab deposition during early stages of amyloidogenesis.
The gut bacteria have an intricate function in preserving the integrity of an intestinal–epithelial
barrier, but exceeding this function, they have also been demonstrated to be critical for shaping the
immune system, host metabolism, and nutrient processing (Bäckhed et al., 2004; Hooper et al.,
2001; Round et al., 2011). Indeed, the functions of the gut microbiome extend beyond the intesti-
nal tract. With their rich repertoire of antigens, metabolites, and direct interaction with the auto-
nomic nervous system the microbiome potently influences remote organ function including the
brain. The microbiome plays an important role in microglial maturation during development and in
adulthood (Abdel-Haq et al., 2019). Previously believed to be shielded from the peripheral immune
system and blood-borne mediators, it became apparent that the brain is accessible for microbial
metabolites to affect cerebral immunity in health and disease (Abdel-Haq et al., 2019;
Janakiraman and Krishnamoorthy, 2018).
In accordance with our observation of SCFA to be the mediator along the gut-brain axis in AD,
multiple lines of evidence have indicated that SCFA might be the key microbial metabolite group
acting on brain function. Particularly, SCFA have been demonstrated to induce microglial maturation
using a similar analysis paradigm by SCFA supplementation in GF mice as used in our study
(Erny et al., 2015). In a Parkinson’s disease mouse model, SCFA were sufficient to induce neuroin-
flammation and disease progression in the absence of the gut microbiome (Sampson et al., 2016).
Moreover, SCFA have been implicated in a wide range of brain disorders or physiological functions
under cerebral control such as mood disorders, autism spectrum disease, or energy metabolism
(Cryan et al., 2019; Li et al., 2018; van de Wouw et al., 2018). Specifically, for AD patients it has
previously been shown that they have alterations in microbiota composition (Haran et al., 2019;
Vogt et al., 2017). Thus, it is conceivable that SCFA concentrations might be altered in AD patients
(Nagpal et al., 2019). One previous clinical study focusing on the association between SCFA con-
centration and AD disease burden suggested a correlation between amyloid load and blood SCFA
concentrations (Marizzoni et al., 2020). Yet, all these clinical evidence of a potential association
between SCFA concentrations and disease progression in AD is rather preliminary and requires con-
firmation in prospectively recruited and larger cohorts.
Over the past decade, microglial cells have come into the focus of experimental AD research.
This has been driven by the identification of several genetic AD risk loci being associated with micro-
glial cells (Long and Holtzman, 2019). Moreover, microglia have been demonstrated in murine AD
models to actively contribute to various pathophysiological process in AD such as plaque seeding,
plaque phagocytosis, and neuronal dysfunction by synaptic pruning (Heneka et al., 2014;
Heneka et al., 2013; Hong et al., 2016; Sarlus and Heneka, 2017). Previous proof-of-concept stud-
ies investigating a potential role of the microbiome in AD have already indicated an effect of micro-
bial colonization or antibiotic treatment on microglial activation (Dodiya et al., 2019; Harach et al.,
2017; Minter et al., 2017). Although previous studies did not reveal a mechanistic link between
Colombo et al. eLife 2021;10:e59826. DOI: https://doi.org/10.7554/eLife.59826 10 of 23Research article Immunology and Inflammation Neuroscience
microbiome function and Ab plaque pathology, they have reproducibly shown that microbiota eradi-
cation (GF mice) or impairing the microbiome’s metabolic function (antibiotic treatment) reduced
microglial activation and Ab plaque load, which is in accordance with our study. This may at first
glance appear contradicting with the research hypothesis supporting microglial activation and their
corresponding increased phagocytic clearance as an approach to reduce Ab plaque load
(Daria et al., 2017; Guillot-Sestier et al., 2015). However, we should bear in mind a potentially dual
nature of microglial responses and their concomitant beneficial and detrimental roles in AD
(Lewcock et al., 2020). Accordingly, previous studies have unequivocally demonstrated a role of
microglia in promoting plaque seeding and growth, particularly at early stages of AD pathology. For
example, microglia have been attributed to promote plaque seeding by the release of pro-inflamma-
tory protein complexes, the so-called ASC specks (Venegas et al., 2017). A recent elegant study
using sustained microglia depletion starting before plaque pathogenesis revealed a critical role of
microglia in the formation of Ab plaques and plaque density (Spangenberg et al., 2019). On the
other hand, preventing microglial activation, such as upon loss of Trem2, increased amyloid seeding
due to reduced phagocytic clearance of Ab seeds, but at the same time reduced plaque-associated
ApoE (Parhizkar et al., 2019). Previous studies demonstrated that ApoE co-aggregates with Ab
fibrils and contributes to plaque seeding and plaque core stabilization (Liao et al., 2015), thus
underscoring the complexity of microglia–ApoE interactions during amyloidogenesis.
ApoE is predominantly produced by astrocytes under physiological conditions, but upregulated
in AD microglia (Sala Frigerio et al., 2019; Sebastian Monasor et al., 2020). Indeed, microglial
depletion in the 5xFAD mouse model resulted in a marked reduction of plaque-associated ApoE
(Spangenberg et al., 2019). In the present study we identified upregulation of microglial ApoE
expression. We hypothesize that increased ApoE expression may contribute to SCFA-driven micro-
glial activation and increased plaque load. However, final proof for this link requires investigation of
SCFA effects in mice with microglia-specific ApoE depletion and awaits future studies.
SCFA use membrane-receptors as well as receptor-independent mechanisms to enter target cells
and exert their functions. Receptors specifically activated by SCFA (free fatty-acid receptor-2 and -3)
have been identified in several organs, including the brain (Layden et al., 2013). Yet, the SCFA can
also freely enter target cells by simple diffusion or fatty acid transporters and exert their biological
function intracellularly, independent of specific receptors (Lin et al., 2012; Moschen et al., 2012).
Therefore, the most likely target mechanism to interfere with SCFA effects in microglia could be on
the level of chromatin remodeling and regulation of target gene expression as it has previously been
demonstrated (Davie, 2003; Huuskonen et al., 2004). However, the detailed mechanistic under-
standing of SCFA on microglial transcriptomic and functional regulation remains unclear and requires
future investigations.
Besides direct effects on brain function including glial cell homeostasis, SCFA can also affect
peripheral immune cells and thereby indirectly modulate neuroinflammatory mechanisms
(Cryan et al., 2019). SCFA have been demonstrated to be potent immune modulators particularly
of T cell function and their polarization into pro- and anti-inflammatory subpopulations (Smith et al.,
2013). In fact, we have previously demonstrated that the effect of SCFA on post-stroke recovery in
an experimental brain ischemia model was dependent on circulating T cells (Sadler et al., 2020;
Sadler et al., 2017). In these previous studies, circulating T cells mediated the effects of SCFA on
the cerebral micromilieu either by their reduction in cerebral invasion or by polarization of the
secreted cytokine profile. However, in contrast to AD, stroke induces a pronounced neuroinflamma-
tory response to the acute tissue injury with the invasion of large numbers of circulating T cells,
which have been demonstrated to contribute substantially to stroke pathology (Cramer et al., 2019;
Liesz et al., 2009). Therefore, while the peripheral polarization of T cells and their consecutive
impact on local neuroinflammation is conceivable after stroke, this pathway seems less likely in AD
with only very limited invasion of circulating immune cells into the brain, particularly in the early
stages of AD pathology. Moreover, the effect of SCFA on the peripheral immune compartment is
most likely site-dependent and might occur within the intestinal wall, blood circulation of secondary
lymphatic organs. It is a limitation of this study that SCFA supplementation was performed only by
oral administration (in drinking water) which might lead to unphysiologically high SCFA concentra-
tions in the upper gastrointestinal tract while physiological SCFA as fermentation products of the
microbiota occurs predominantly in the colon (Morrison and Preston, 2016). While site-specific
Colombo et al. eLife 2021;10:e59826. DOI: https://doi.org/10.7554/eLife.59826 11 of 23Research article Immunology and Inflammation Neuroscience
effects of SCFA and differing resorption routes were beyond the scope of the present proof-of-con-
cept study, these aspects are critical for the clinical translation and require further studies.
Interestingly, the biological effect of SCFA on microglia seems to be largely dependent on the
specific disease condition. While SCFA in neurodegenerative conditions, as also in our study, have
been associated with microglial reactivity and activation, their function in primary autoimmune and
acute brain disorders has mainly been described to be anti-inflammatory. For example, we have
been previously shown that SCFA treatment promotes anti-inflammatory mechanisms and improve
neuronal function in ischemic stroke and similar findings have also been reported in experimental
autoimmune encephalitis (Haghikia et al., 2015; Sadler et al., 2020). The detailed cause of this
divergent functions of SCFA in different disease conditions is currently still unknown and requires
further exploration for the potential use of personalized treatment approaches. Yet, in light of our
results in the AD compared to the stroke model, it seems likely that the different effects of SCFA
treatment on disease outcome could be due to engaging different mechanistic routes, such as
peripheral lymphocyte polarization in EAE and stroke versus local effects on microglia in AD.
Our study suggests that SCFA-regulated pathways might be promising drug targets in the
peripheral circulation for early-stage AD to prevent microglial activation, ApoE production, and the
development of amyloid pathology. However, the therapeutic targeting and neutralization of SCFA,
e.g. by specific SCFA-scavengers, in order to chronically reduce circulating SCFA blood concentra-
tions is currently not established. Also attempting to reduce SCFA concentrations by reduction of
nutritional fiber intake is not a feasible therapeutic approach. Reduced fiber intake correlates with
increased risk of metabolic syndrome and cardiovascular events such as myocardial infarction and
stroke. Furthermore, dietary fiber restriction will most likely not be efficient to affect microglial acti-
vation in early-stage AD because a near-complete reduction of blood SCFA concentrations, as seen
in GF mice, will not be achieved by dietary intervention.
In conclusion, our study identifies SCFA as molecular mediators along the gut-brain axis in AD.
Identification of this novel pathway will open up new avenues for therapeutic targeting of the micro-
biome-SCFA-microglia axis to reduce the inflammatory impact on AD development.
Materials and methods
Key resources table
Reagent type (species)
or resource Designation Source or reference Identifiers Additional information
Genetic reagent APPPS1 doi: MGI:3765351 C57BL/6 background
(Mus musculus) 10.1038/sj.embor.7400784
Antibody Anti-IBA1 SYSY Cat# 234 004, IHC (1:500)
(guinea pig polyclonal) RRID:AB_2493179
Antibody Anti-IBA1 Wako Cat#:019–19741, IHC (1:500)
(rabbit polyclonal) RRID:AB_839504
Antibody Anti-CD68 Bio-Rad Cat#:MCA1957G, IHC (1:500), WB (1:1000)
(rat monoclonal) RRID:AB_324217
Antibody Anti-Amyloid Y188 Abcam Cat#:1565–1, WB (1:1000)
(rabbit monoclonal) RRID:AB_562042
Antibody Anti-Amyloid beta 3552 doi: IHC (1:500), WB (1:2000)
(rabbit polyclonal) 10.1523/JNEUROSCI.5354–05.2006
Antibody anti-beta-Amyloid, 6E10 BioLegend Cat# 803002, IHC (1:500)
(mouse monoclonal) RRID:AB_2564654
Antibody Anti-Presenilin 1 (NT1) BioLegend Cat# SIG-39194–500, WB (1:1000)
(mouse monoclonal) RRID:AB_10720504
Antibody Anti-Human Adam10 R and D Systems Cat# MAB1427, WB (1:1000)
(mouse monoclonal) RRID:AB_2223057
Antibody Anti-BACE1 Epitomics Cat# 2882–1, WB (1:1000)
(rabbit monoclonal) RRID:AB_2061494
Antibody Anti-Calnexin Stressgen Cat# ADI-SPA-860, WB (1:1000)
(rabbit monoclonal) RRID:AB_10616095
Continued on next page
Colombo et al. eLife 2021;10:e59826. DOI: https://doi.org/10.7554/eLife.59826 12 of 23Research article Immunology and Inflammation Neuroscience
Continued
Reagent type (species)
or resource Designation Source or reference Identifiers Additional information
Chemical compound, drug Sodium butyrate 98% Sigma Aldrich 303410 In vitro: 250 mM
In vivo: 40 mM
Chemical compound, drug Sodium propionate 99.0% Sigma Aldrich P1880 In vitro: 250 mM
In vivo: 25.9 mM
Chemical compound, drug Sodium acetate anhydrous 99% Sigma Aldrich S2889 In vitro: 250 mM
In vivo: 67.5 mM
Antibody Anti-Amyloid beta 2D8 DOI: 10.1016/j.nbd.2007.04.011 WB (1:1000)
(rat polyclonal) IHC (1:300)
Antibody Anti-P2Y12 AnaSpec Cat# 55043A, IHC (1:100)
(rabbit polyclonal) RRID:AB_2298886
Antibody Anti-GFAP Dako Cat# Z0334, IHC (1:200)
(rabbit polyclonal) RRID:AB_10013382
Antibody Anti-APOE DOI Clone HJ6.3B IHC (1:50)
(mouse monoclonal) 10.1172/JCI96429
Chemical compound, drug Thiazine red VWR Chemicals 27419.123 IHC (2 mM)
Chemical compound, drug Hoechst 33342 ThermoFisher H3570 IHC (1:2000)
Animal experiments
All animal experiments were performed under the institutional guidelines for the use of animals for
research and were approved by the governmental ethics committee of Upper Bavaria (Regierung-
spraesidium Oberbayern, license number #160–14). SPF B6.Cg-Tg (Thy1-APPSw,Thy1-PSEN1*L166P)
21Jckr (APPPS1) (Radde et al., 2006) mice were bred for this project at the core animal facility of
the Center for Stroke and Dementia Research in Munich. SPF mice in this study were kept at the
core animal facility of the Center for Stroke Dementia Research (Munich, Germany) in individually
ventilated cage systems at 12 hr dark–light cycle with ad libitum access to food and water.
GF mouse generation and handling
APPPS1 mice were rederived to GF status in the Clean Mouse Facility, University of Bern, Switzer-
land as previously reported (Harach et al., 2017) and housed in flexible-film isolators. All mouse
handling and cage changes were performed under sterile conditions. GF and SPF mice all received
the same autoclaved chow and sterile water. For SCFA treatment, mice were given a sterile-filtered
solution containing 25.9 mM sodium propionate, 40 mM sodium butyrate, and 67.5 mM sodium ace-
tate in sterile water ad libitum starting from 4 (treatment of GF mice) or 8 (treatment of SPF mice)
until 12 weeks of age. The SCFA water solution was renewed every 3 days. For surgical interventions
(stereotactic injection, see below) in GF mice, the whole surgical procedure and post-surgical care
was performed in a microbiological safety cabinet as previously described in detail (Singh et al.,
2018). Animals were regularly checked for germ-free status by aerobic and anaerobic cultures, cecal
DNA fluorescence stain, and 16 s rRNA PCR of fecal pellets. GF status of all animals used in this
study (control and SCFA-supplemented) has been confirmed after sacrificing the mice.
Natural recolonization of GF mice
GF littermate mice were naturally colonized through co-housing with conventional SPF mice from
the same SPF animal facility in which the conventional SPF APPPS1 mice were housed (Center for
Stroke and Dementia Research, Munich). Co-housing was started at 4 weeks of age and maintained
until sacrifice of the animals at 3 months of age. Animals were housed in HAN-gnotocage mini-isola-
tors and received sterile food pellets and water as GF mice.
Histological analysis of Ab plaque load and density
Mice were transcardially perfused with PBS followed by overnight post fixation with 4% PFA solu-
tion. Free floating 30 mm sagittal brain sections have been permeabilized and blocked for 1 hr in
PBS/0.5% Triton x-100/5% normal goat serum (NGS). Next, samples have been incubated overnight
Colombo et al. eLife 2021;10:e59826. DOI: https://doi.org/10.7554/eLife.59826 13 of 23Research article Immunology and Inflammation Neuroscience
at 4˚C with primary antibody anti b-amyloid (Ab) (clone 6E10, 1:500, BioLegend) diluted in blocking
buffer and stained with the corresponding goat secondary antibody. Immunostainings have been
performed on six brain sections/animal collected every 300 mm starting from the interhemispheric fis-
sure. Three 10 images/section (front, middle, and rear cortex) have been acquired and the plaque
load (6E10 coverage area) has been determined using the particle analysis tool in ImageJ software
(NIH) and normalized on total tissue area. Analysis has been performed at least on five mice per
group/time point. Histological analysis has been performed by an investigator (AVC) blinded to
treatment groups. For analysis of plaque density, 30 mm sections were stained with Methoxy-X04
and confocal images were collected in Z-stacks. Eight ROI were selected across the cortex and
acquired across the different cortical layers. Image data analysis was performed as previously
reported in detail (Peters et al., 2018). In brief, local background correction was applied to diminish
intensity variations among different stacks and to account for the intensity decline in the axial dimen-
sion due to absorption and scattering of photons. For this purpose, the voxel intensity was normal-
ized in each Z-layer to the 70th percentile of Methoxy-X04 fluorescence intensity. Subsequently,
amyloid plaques were defined by applying the 90th percentile in the Methoxy-X04 fluorescence data
stacks. The radius of each individual plaque was calculated from the Z-plane with the largest area
extension in XY (radius=H(area/p)), assuming spherical shape of plaques (Hefendehl et al., 2011).
All plaques that contacted the image border were excluded from the analysis. The cut-off size was
set to a minimal plaque radius of 2 mm.
Barnes maze test for memory deficits
A modified version of Attar et al., 2013 was used to perform the Barnes maze test. The elevated
20-hole apparatus (diameter: 100 cm, hole diameter: 10 cm) had a target box which was placed
under the maze. The protocol includes three phases of interaction of mice with the maze: (1) habitu-
ation to the maze, (2) a 2-day training period, and (3) a probe trial 48 hr later. Before each day of
training or probe mice were placed 30 min prior procedure in the testing room for acclimatization.
On day 1 mice were habituated to the maze. Therefore, mice were placed in the center of the maze
in a 2 l glass beaker. After 1 min of acclimatization, mice were guided slowly by moving the glass
beaker toward the target hole. This was done three consecutive times per mouse. On day 2 mice
were placed in center and given the possibility to freely explore and find the target hole. If mice did
not reach the target hole within 3 min the glass beaker was used to slowly guide them to the target.
This was done in three consecutive trials. On day 3 mice were placed under the beaker and 10 s after
placement the beaker was removed, and mice were allowed to explore freely and find the target
hole. Again, three consecutive trials were performed with every mouse. This procedure was
repeated for the actual probe 48 hr later. Acquisition and zone-dependent analysis were performed
with Ethovision XT (Noldus). Data acquisition and analysis were performed by an investigator (SR)
blinded to treatment groups.
GC/MS-based SCFA analysis
The SCFA acetate, propionate, and butyrate were quantified as described before (Hoving et al.,
2018). Briefly, 10 ml of plasma was transferred to a glass vial containing 250 ml acetone (Sigma-
Aldrich), 10 ml one ppm internal standards solution containing acetic acid-d4, propionic acid-6, and
butyric acid-d8 (Sigma Aldrich), and 10 ml ethanol. Thereafter, samples were derivatized with penta-
fluorobenzyl bromide (PFBBr), as follows: 100 ml 172 mM PFBBr (Thermo) in acetone was added,
samples were mixed and heated to 60˚C for 30 min. After the samples had cooled down to room
temperature a liquid–liquid extraction was performed using 500 ml n-hexane (Sigma-Aldrich) and 250
ml LC-MS grade water. The upper n-hexane layer was transferred to a fresh glass vial and subse-
quently used for GC-MS analysis. Calibration standards were prepared analogous. For calibration
standards no plasma was added and 10 ml of EtOH was replaced by 10 ml standards solution (Sigma-
Aldrich) in EtOH. Samples were analyzed on a Bruker Scion 436 GC fitted with an Agilent VF-5ms
capillary column (25 m 0.25 mm i.d., 0.25 mm film thickness) coupled with a Bruker Scion TQ MS.
Injection was performed using a CTC PAL autosampler (G6501-CTC): 1 ml sample was injected split-
less at 280˚C. Helium 99.9990% was used as carrier gas at a constant flow of 1.20 ml/min. The GC
temperature program was set as follows: 1 min constant at 50˚C, then linear increase at 40˚C/min to
60˚C, kept constant for 3 min, followed by a linear increase at 25˚C/min to 200˚C, linearly increased
Colombo et al. eLife 2021;10:e59826. DOI: https://doi.org/10.7554/eLife.59826 14 of 23Research article Immunology and Inflammation Neuroscience
at 40˚C/min to 315˚C, kept constant for 2 min. The transfer line and ionization source temperature
were 280˚C. The pressure of the chemical ionization gas, methane (99.9990%), was set at 15 psi.
Negatively charged ions were detected in the selected ion monitoring mode, and acetic acid, acetic
acid-d4, propionic acid, propionic acid-d6, butyric acid, and butyric acid-d8 were monitored at m/z
59, 62, 73, 78, 87, and 94 respectively.
Sample preparation for biochemical analyses
Mouse brains were isolated and immediately snap frozen in liquid nitrogen. Frozen brains were then
mechanically pulverized for further applications and stored at 80˚C. Aliquots of brain powder were
lysed for 20 min in lysis buffer (150 mM NaCl, 50 mM Tris pH 7.5, 1% Triton X-100) supplemented
with protease and phosphatase inhibitor cocktail (Roche) on ice. Samples were then centrifuged at
17,000 g for 30 min at 4˚C. Supernatants were collected (soluble fraction) and stored at 80˚C.
In vitro amyloid aggregation assay
Synthetic Ab40 peptide (rPeptide) was solubilized (1 mg/ml) in 50 mM NH4OH (pH >11). Upon 15
min incubation at RT and subsequent water bath sonication (5 min), fractions of 100 mg Ab40 were
lyophilized and stored at 20˚C. 100 mg Ab40 was resuspended in 1 ml of 20 mM NaPi, 0.2 mM
EDTA, pH 8.0. After water bath sonication, the Ab40 solution was filtered through an Anatop 0.02
mm filter and stored on ice. Final Ab40 concentration was assessed from the UV spectrum ([Ab40] =
(A275-A340)/1280 mol/l). Circular Dichroism measurements (Jasco 810 Spectropolarimeter) con-
firmed the random coil conformation of the Ab peptide. For the rtQuic aggregation experiments,
Ab40 was diluted to 20 mM final concentration in 20 mM NaPi, 0.2 mM EDTA, pH 8.0 containing 100
mM Thioflavin T. 50 ml of this Ab40 solution was either mixed with 50 ml SCFA mixture (60 mM total
SCFA, i.e. a mixture of Na-acetate, Na-propionate, and Na-butyrate dissolved in equimolar ratios in
water containing 100 mM Thioflavin T) or mixed with 50 ml saline solution (60 mM NaCl, 100 mM Thio-
flavin T) to compare the aggregation of Ab40 (final concentration 10 mM) in 20 mM NaPi, 0.2 mM
EDTA buffer (pH 8.0), either enriched with 30 mM SCFA mixture or with 30 mM NaCl. Experiments
were performed in triplicates. Ab40 solution aliquots were incubated at 37˚C in 96-well plates under
constant double-orbital shaking in a FLUOStar Omega plate reader (BMG Labtech). The formation
of amyloid fibrils was monitored by the Thioflavin T fluorescence. Data were assessed every 15 min
(lex = 440 nm), (lem = 480 nm). In control experiments (blanks), 100 mM Thioflavin T was diluted in
the 20 mM NaPi, 0.2 mM EDTA, pH 8.0 alone, or enriched with the SCFA mixture (30 mM) or saline
solution (30 mM NaCl).
Immunoblot analysis of mouse brain
For western blot analysis, the soluble fraction from 3 months old APPPS1 mice have been quantified
using Bradford assay (Biorad) according to manufacturer’s protocol. At least 10 mg per sample have
been loaded either on a bis-tris acrylamide (APP, NT, ADAM10, and BACE1) or a Novex 10–20%
Tris-Tricine gel (Ab, C83, and C99) followed by blotting on nitrocellulose membrane (Millipore) using
the following antibodies: anti-C-term APP (Y188, 1:1000, Abcam), anti-Ab (3552, 1:1000,
Yamasaki et al., 2006), anti-Presenilin 1 (N terminus) (NT, 1:1000, BioLegends), anti-ADAM10 N-ter-
minal (1:1000; R and D Systems), and anti-BACE1 (1:1000, Epitomics). Blots have been developed
using horseradish peroxidase-conjugated secondary antibodies (Promega) and the ECL chemilumi-
nescence system (Amersham). An antibody against calnexin (1:1000, Stressgen) has been used as
loading control. Three mice per group were analyzed.
Densitometry analysis has been performed using gel analyzer tool on ImageJ (NIH).
Cell free g-secretase activity assay
g-Secretase cleavage assays using C100-His6 as substrate were carried out using purified g-secretase
reconstituted into small unilamellar vesicles (SUV) composed of POPC essentially as described
(Winkler et al., 2012) except that the reconstitution was performed 0.5 PBS, pH 7.4, instead of 35
mM sodium citrate, pH 6.4. The SCFA mixture (Na-acetate, Na-propionate, and Na-butyrate dis-
solved in water in equimolar ratios) was added to the assay samples at the indicated final concentra-
tions from stock solutions. Following separation of the assay samples by SDS-PAGE on Tris-Tricine
Colombo et al. eLife 2021;10:e59826. DOI: https://doi.org/10.7554/eLife.59826 15 of 23You can also read