Anatomical distribution and functional roles of electrical synapses in Drosophila
←
→
Page content transcription
If your browser does not render page correctly, please read the page content below
Article

Anatomical distribution and functional roles of
electrical synapses in Drosophila
Highlights                                                                Authors
d   An immunohistochemistry-based map of innexin gap                      Georg Ammer, Rene e M. Vieira,
    junctions in the Drosophila CNS                                       Sandra Fendl, Alexander Borst

d   VS/HS cells are electrically coupled to large cell networks via       Correspondence
    shakB gap junctions
                                                                          gammer@neuro.mpg.de
d   Loss of electrical synapses from VS/HS cells induces voltage
    and calcium oscillations
                                                                          In brief
                                                                          Ammer et al. first map the broad
d   Electrical synapses play functional roles in both ON and OFF          distribution of electrical synapses in the
    vision pathways                                                       fly nervous system. Next, they find that
                                                                          electrical synapses are required for the
                                                                          intrinsic stability of VS/HS cells. Further-
                                                                          more, electrical synapses play differential
                                                                          roles in ON and OFF visual pathways but
                                                                          are not necessary for the emergence of
                                                                          direction selectivity.

           Ammer et al., 2022, Current Biology 32, 2022–2036
           May 9, 2022 ª 2022 The Author(s). Published by Elsevier Inc.
           https://doi.org/10.1016/j.cub.2022.03.040                                                        ll
ll
       OPEN ACCESS

Article
Anatomical distribution and functional roles
of electrical synapses in Drosophila
                     e M. Vieira,1 Sandra Fendl,1 and Alexander Borst1
Georg Ammer,1,2,* Rene
1Max  Planck Institute of Neurobiology, Am Klopferspitz 18, 82152 Martinsried, Germany
2Lead  contact
*Correspondence: gammer@neuro.mpg.de
https://doi.org/10.1016/j.cub.2022.03.040

SUMMARY

Electrical synapses are present in almost all organisms that have a nervous system. However, their brain-
wide expression patterns and the full range of contributions to neural function are unknown in most species.
Here, we first provide a light-microscopic, immunohistochemistry-based anatomical map of all innexin gap
junction proteins—the building blocks of electrical synapses—in the central nervous system of Drosophila
melanogaster. Of those innexin types that are expressed in the nervous system, some localize to glial cells,
whereas others are predominantly expressed in neurons, with shakB being the most widely expressed
neuronal innexin. We then focus on the function of shakB in VS/HS cells—a class of visual projection neu-
rons—thereby uncovering an unexpected role for electrical synapses. Removing shakB from these neurons
leads to spontaneous, cell-autonomous voltage and calcium oscillations, demonstrating that electrical syn-
apses are required for these cells’ intrinsic stability. Furthermore, we investigate the role of shakB-type elec-
trical synapses in early visual processing. We find that the loss of shakB from the visual circuits upstream of
VS/HS cells differentially impairs ON and OFF visual motion processing pathways but is not required for the
computation of direction selectivity per se. Taken together, our study demonstrates that electrical synapses
are widespread across the Drosophila nervous system and that they play essential roles in neuronal function
and visual information processing.

INTRODUCTION                                                          resolution of current electron microscopic imaging techniques
                                                                      used for generating large EM datasets. Thus, most of our knowl-
Neurons communicate via two fundamentally different types of          edge about electrical synapses comes from studies that focused
synapses. At chemical synapses, neurotransmitters released            on particular cell types or small neural circuits. The best-studied
from presynaptic sites activate receptors on postsynaptic neu-        example is the giant fiber escape circuit of Drosophila. Here, elec-
rons, leading to direct opening of ion channels or to an initiation   trical connections formed by shakB-type gap junctions exist at all
of intracellular signaling cascades. In contrast, electrical synap-   nodes of the circuit, from sensory neurons to interneurons to motor
ses consist of channel-forming gap junction proteins, which allow     neurons.13–17 The proposed function of the strong electrical
for a direct, bidirectional flow of ions between two connected        coupling in the giant fiber circuit is to speed up signal transmission
cells. In invertebrates, gap junctions are composed of innexin pro-   for enabling fast escape maneuvers, as electrical synapses essen-
teins, of which eight different types are encoded in the Drosophila   tially introduce no synaptic delay. Additional examples of electrical
genome.1,2 Two hemichannels, composed of eight innexin pro-           synaptic connections in the Drosophila brain include coupling be-
teins each, form a functional channel that bridges the cytoplasm      tween olfactory projection neurons18 and coupling between
of two cells.3 Apart from forming electrical synapses between         different types of neurons in the mushroom body.19–21
neurons, innexins play essential roles in other biological pro-          Extensive electrical connections also exist in the fly visual sys-
cesses such as embryonic development,4 stem cell division,5           tem. Here, several studies have investigated the vertical system
the formation of the blood-brain barrier,6 or spermatogenesis.7       (VS) and horizontal system (HS) cells—subtypes of the lobula
   In Drosophila, the molecular components, physiology, and func-     plate tangential cells (LPTCs)—in the blowfly Calliphora. LPTCs
tion of chemical synapses have been studied in great detail.8 In      are wide-field neurons that project their axons from the optic
addition, in recent years, large-scale efforts have been undertaken   lobe to the central brain or the contralateral optic lobe.22 They
to generate a connectome of the Drosophila nervous system—a           receive direction-selective input from small-field T4 and T5 cells,
complete map of every chemical synaptic connection—based              the output neurons of ON and OFF motion pathways, which
on electron-microscopic9 reconstructions.9–11 Conversely, the         respond to moving luminance increments and decrements,
nervous-system-wide distribution of electrical synapses is un-        respectively.23 Spatial integration of these inputs renders
known. Importantly, electrical synapses are completely absent         LPTCs selective to a particular pattern of optic flow that is
from all published Drosophila connectomic studies. This is largely    dependent on the neuronal subtype.24 In addition to spatial
due to their small size of around 10–20 nm,12 which is below the      integration, some LPTCs perform nonlinear amplification of

2022 Current Biology 32, 2022–2036, May 9, 2022 ª 2022 The Author(s). Published by Elsevier Inc.
This is an open access article under the CC BY license (http://creativecommons.org/licenses/by/4.0/).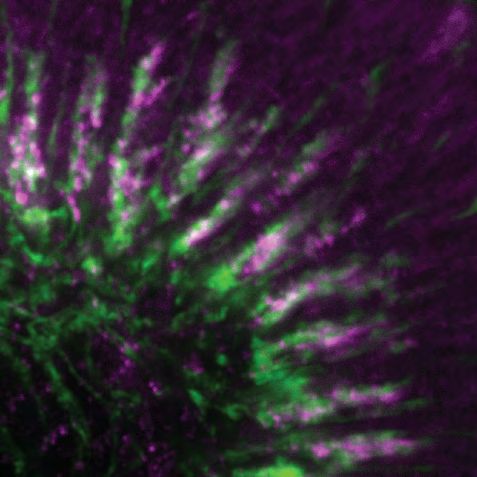
ll
Article                                                                                                                                                OPEN ACCESS

                A                                                                          B

                C                                                                          D

                E                                                                          F

                G                                                                          H

Figure 1. Expression patterns of innexin gap junction proteins in the Drosophila central nervous system
Immunostainings for the gap junction proteins ogre (inx1) (A), inx2 (B), inx3 (C), zpg (inx4) (D), inx5 (E), inx6 (F), inx7 (G), and shakB (inx8) (H). Horizontal sections of
the optic lobes (left panels) and maximum intensity projections of the central brain (middle panels) and ventral nerve cord (right panels) are shown.
Scale bars, 30 mm (optic lobe), 50 mm (central brain), 100 mm (VNC), and 40 mm (inset in F).
See also Figures S1–S3.

high-frequency inputs in the temporal domain.25 Different sub-                          RESULTS
types of LPTCs form electrical synapses both with each other
and with descending neurons.26–29 Electrical coupling between                           A map of gap junction expression across the central
the axons of VS cells broadens their axonal receptive fields                            nervous system
and thereby increases the robustness of optic flow representa-                          To determine the distribution of electrical synapses in the central
tion under noisy conditions.30–34 Similarly, HS cells form electri-                     nervous system of Drosophila melanogaster, we performed immu-
cal synapses with other HS cells and additionally with the H2 cell                      nostainings against each of the eight innexin gap junction proteins
from the contralateral hemisphere.35 However, which type of in-                         (Figures 1 and S1–S3). We found that six of the eight innexins show
nexin is mediating the electrical coupling between LPTCs is un-                         expression in the nervous system (Figure 1). Three of those, ogre
known. Furthermore, experimental studies that directly test the                         (inx1), inx2, and inx3, exclusively localized to glial cells
effects of removing electrical synapses on the physiology of                            (Figures 1A–1C). We performed colabeling of these innexins
LPTCs are lacking.                                                                      together with markers for glial subtypes. Consistent with earlier
   Here, we first describe the distribution of innexins across the                      work, ogre localized to subperineural glia and partly to perineural
entire central nervous system (CNS) in adult Drosophila. Next,                          glia, which are crucial components of the blood-brain barrier.5,6
to assess the importance of electrical synapses in neuronal func-                       inx3 was detected exclusively and strongly in neuropil ensheathing
tion, we investigate the role of shakB, the most widely expressed                       glia, and inx2 colocalized with all of the three glial subtypes (Fig-
neuronal gap junction protein, in VS and HS cells. We find that                         ure S2). Two of the other innexins showed only very sparse expres-
loss of electrical synapses drives these cells into spontaneous                         sion: whereas diffuse inx5 signal was visible only in the lamina (Fig-
membrane potential oscillations and induces large periodic cal-                         ure 1E), inx6 was exclusively detected in the dorsal fan-shaped
cium fluctuations. These oscillations arise cell autonomously and                       body in the central brain (Figures 1F and S3A).21,36 In stark
involve voltage-gated sodium channels (Nav) and Ih channels.                            contrast, shakB (inx8) was broadly expressed in the optic lobes,
Moreover, we record from VS/HS cells and presynaptic T4/T5                              in many regions of the central brain and in the ventral nerve cord
cells and demonstrate that loss of shakB affects visual process-                        (VNC) (Figure 1H). We obtained similar results by using a different
ing in both ON and OFF pathways.                                                        set of antibodies (Figure S1). Together, these protein expression

                                                                                                            Current Biology 32, 2022–2036, May 9, 2022 2023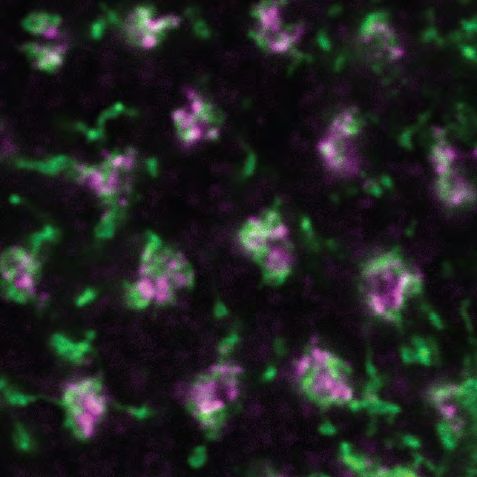
ll
     OPEN ACCESS                                                                                                                Article

patterns are largely in agreement with RNA sequencing data.37–40        LPTCs form large electrically coupled networks via
According to these studies, the mRNAs of ogre, inx2, inx3, and          shakB gap junctions
shakB are the most strongly expressed innexin transcripts in the        After describing the anatomical distribution of gap junctions
nervous system, whereas zpg (inx4), inx5, inx6, and inx7 were           across the Drosophila nervous system, we sought to study the
either not detected at all or only at very low levels (Figure S3B).     functional role of electrical synapses in a restricted number of
                                                                        cells. We chose to investigate the VS and HS cells of the lobula
Electrical synapses formed by shakB are widely                          plate tangential cell system for several reasons: First, these cells
distributed across the CNS                                              provide output from the optic lobes to the central brain. Given
As shakB was broadly and strongly expressed in the neuropil, we         that shakB is strongly expressed in the optic lobes, we specu-
analyzed the expression pattern of this innexin in more detail          lated that any effects of removing this protein would likely affect
(Figures 2 and S1H–S1M). Correlation analysis between relative          the response properties of LPTCs. Second, VS and HS cells have
fluorescence intensities of shakB and nc82, a marker for chemical       already been shown to be electrically coupled to each other and
presynaptic sites, revealed a weak anticorrelation (Figure S3C).        to other LPTCs.26–28 Third, VS and HS cells are easily accessible
This suggests that the number of shakB electrical synapses              by electrophysiological and functional imaging experiments.
does not simply scale with the number of chemical synapses but             VS and HS cells project their axons to the posterior slope in the
that these two types of synapses have distinct anatomical distribu-     central brain (Figure 3A). Since we observed shakB expression in
tions. shakB localized to all four neuropils of the optic lobe in a     this brain area, we reasoned that VS and HS cells might possess
layered fashion: the proximal lamina; layers 1, 3, 5, and 10 of the     shakB gap junctions. When we visualized VS/HS cells with GFP
medulla; layer 3 of the lobula; and to the lobula plate (Figure 1H).    and stained for shakB, we indeed observed colocalization be-
In the central brain, we detected particularly strong expression of     tween their axon terminals and shakB (Figure 3B). To identify
shakB in the anterior mechanosensory and motor center, the ante-        the neurons that are coupled to VS and HS cells via shakB gap
rior ventrolateral protocerebrum, the wedge, the subesophageal          junctions, we performed whole-cell patch clamp recordings
ganglion, the giant fiber, the posterior slope, and the cervical con-   from individual cells and filled them with the gap junction-perme-
nective. Additionally, we observed weaker expression in the             able molecule neurobiotin. Staining against neurobiotin revealed
antennal lobes, the optic tubercle, the superior medial protocere-      large dye-coupled neuronal networks, irrespective of the partic-
brum, and the lateral horn (Figures 2A–2J). In the VNC, shakB local-    ular subtype of VS or HS cell (dye-coupling in 10/10 cells;
ized to the leg neuropils, the tectulum, and the wing and haltere       Figures 3C, 3D, 3F, 3G, and S5A). VS and HS cells were dye-
neuropils (Figure 2K). Importantly, no shakB immunolabeling was         coupled to neighboring VS and HS cells, respectively, as
detected in shakB2-mutant flies that carry a null allele for six of     described before.27,28 Moreover, both cell types were strongly
the eight shakB isoforms (Figure S3D).41 This suggests that the re-     coupled to descending neurons.29 Interestingly, in contrast to
maining two isoforms (isoforms A, E) are either not expressed in the    HS cells, VS cells were additionally coupled to dozens of smaller
adult CNS or only at very low levels. Similarly, shakB staining was     neurons (putatively lobula plate columnar cells) as revealed by
absent when we expressed an RNAi construct that targets all eight       the labeling of small cell bodies and thin neurites projecting to
shakB isoforms pan-neuronally (Figure S3E), thereby confirming          the central brain. Importantly, dye-coupling was abolished
the specificity of the antibody. Given the abundant and widespread      when injecting VS or HS cells in the shakB2-mutant background
expression of shakB in the Drosophila nervous system, we focused        (dye-coupling in 0/8 cells), demonstrating that electrical synap-
our further investigations on this gap junction type.                   ses between VS/HS cells and other cells are exclusively formed
                                                                        by shakB-type gap junctions (Figures 3E, 3H, and S5B). VS and
Candidate cell types forming shakB-type electrical                      HS cells are thus part of large electrically coupled networks con-
synapses                                                                nected by shakB gap junctions.
As a next step, we generated a genetic driver line that is based
on the MiMIC-Trojan-Gal4 system (Figure S4A).42 To do so, we            Spontaneous membrane potential oscillations in VS and
used a published fly line in which a MiMIC transposon is in-            HS cells of shakB-deficient flies
serted into an intron of the shakB gene that is common to the           To investigate the functional relevance of electrical synapses in
same six isoforms that are affected by the shakB2 mutation.43           VS/HS cells and upstream visual circuits, we performed electro-
This MiMIC insertion was then exchanged with a Trojan-Gal4              physiological recordings from these neurons in control and
exon that codes for a T2A-sequence followed by the Gal4 tran-           shakB-deficient flies. Without visual stimulation, VS/HS cells
scription factor. Consequently, every cell that expresses one of        from control flies showed small spontaneous membrane potential
those shakB isoforms should express Gal4 as well, thereby al-           fluctuations, corresponding to excitatory postsynaptic potentials
lowing us to label most shakB-expressing cells. When using the          (EPSPs) and inhibitory postsynaptic potentials (IPSPs) but gener-
shakB-Trojan-Gal4 line to drive GFP, we observed many                   ally had stable resting potentials (Figures 4A and 4C). In contrast, a
labeled cells across the CNS (Figure 2L). The neuropil regions          large fraction of recorded cells from shakB2-mutant flies sponta-
that showed strong shakB immunolabeling were also strongly              neously displayed fast, high-amplitude membrane potential oscil-
innervated by neurons labeled by this line (Figures 2M–2O). A           lations. Frequently, sudden, large drops in membrane potential,
second fly line in which the Trojan-Gal4 cassette was integrated        which again occurred periodically, interrupted these fast oscilla-
into a different intronic region revealed a highly similar expres-      tions (Figure 4B). Both of these types of oscillations also occurred
sion pattern (Figures S4B–S4I). This confirms that shakB gap            in flies in which the expression of shakB was knocked down pan-
junctions are widely expressed in the central nervous system            neuronally using RNA interference (hereafter referred to as shakB-
of the fly by a large number of different cell types.                   RNAi flies) (Figure 4D). This makes it unlikely that secondary

2024 Current Biology 32, 2022–2036, May 9, 2022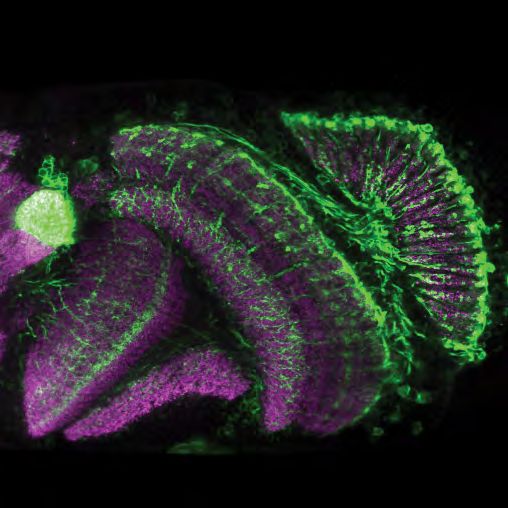
ll
Article                                                                                                                                          OPEN ACCESS

            A                        B                        C                          D                 E                         F

            G                            H                            K                           K’                           K’’

            I                            J

            L                                      M                         M’                        M’’                        M’’’

                                                   N                                     O                     O’                        O’’

Figure 2. Distribution of shakB electrical synapses across the fly central nervous system
(A–J) In the central brain, shakB (green) is expressed in the antennal mechanosensory and motor center (AMMC) and anterior ventrolateral protocerebrum (AVLP)
(A), the antennal lobe (AL) (B), the optic tubercle (OPTU) and superior medial protocerebrum (SMP) (C), the lateral horn (LH) (D), the wedge (WED) (E), the giant fiber
(GF) (F), the subesophageal ganglion (SOG) (G and H), the posterior slope (PS) (I), and the cervical connective (CV) (J).
(K–K00 ) In the VNC, shakB localizes to regions in the ventral (K), medial (K0 ), and dorsal (K00 ) parts.
(L) Expression of GFP driven by shakB-Trojan-Gal4. Maximum intensity projection (MIP) of the brain and VNC.
(M–M%) shakB-Trojan-Gal4-driven GFP expression in the central brain. MIPs of anterior (M), anteromedial (M0 ), posteromedial (M00 ), and posterior (M%) parts.
(N) Cell types in the optic lobe labeled by the shakB-Trojan-Gal4 line (horizontal section).
(O–O00 ) Cell types in the VNC labeled by the shakB-Trojan-Gal4 line. MIPs of ventral (O), medial (O0 ), and dorsal (O00 ) regions are shown.
Scale bars, 20 mm (A–J), 50 mm (K), 100 mm (L), and 50 mm (M–O).
See also Figures S1I–S1M, S3, and S4.

mutations or off-target effects cause the oscillations. Although                     indicative of a functional link between these two oscillation types.
cells from control flies never displayed any of these two types of                   We also noted that resting membrane potentials were slightly less
oscillations (CS-control: 0/21, RNAi-control: 0/16), both in mutant                  negative in both types of flies that lacked shakB when compared
and knockdown flies, fast oscillations occurred in more than fifty                   with controls (Figure 4F). Why does only a subset of neurons oscil-
percent of the neurons (shakB2-mutant: 17/30, shakB-RNAi:                            late spontaneously? Interestingly, we found that subtle current
9/16), of which around half showed slow oscillations (shakB2-                        injections could switch neurons from a non-oscillatory into an
mutant: 9/17, shakB-RNAi: 4/9) (Figure 4E). Importantly, neurons                     oscillatory state and vice versa (Figures S5C–S5F). This suggests
only oscillated slowly if they also exhibited fast oscillations,                     that most (or all) cells that lack shakB are intrinsically unstable,

                                                                                                        Current Biology 32, 2022–2036, May 9, 2022 2025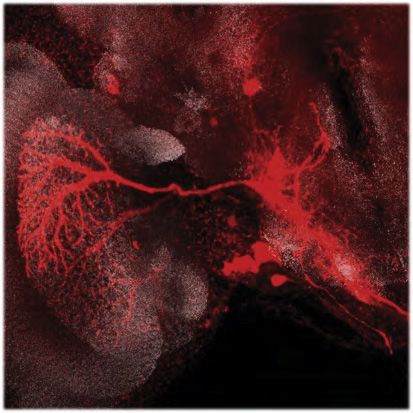
ll
     OPEN ACCESS                                                                                                                  Article
                                                                                             Figure 3. VS and HS cells form electrical
A                             B                             B’
                                                                                             synapses via shakB gap junctions
                                                                                             (A) Posterior view of the brain with VS and HS cells
                                                                                             labeled with GFP.
                                                                                             (B) shakB localizes to the axon terminals of VS and
                                                                                             HS cells. Brain area corresponds to boxed region
                                                                                             in (A).
                                                                                             (B0 ) Magnification of HS cell terminals highlighted
                                                                                             in (B).
                                                                                             (C and D) Neurobiotin injections (red) into single VS
                                                                                             cells. In (C), we included the gap junction-imper-
                                                                                             meable dye Alexa 488 (green) in the electrode. The
C                             D                             E                                patched VS cell appears yellow because both
                                                                                             neurobiotin (red) and Alexa 488 (green) are pre-
                                                                                             sent. Arrows and arrowheads indicate neurites or
                                                                                             somata of dye-coupled small neurons.
                                                                                             (E) Dye-coupling is abolished when injecting neu-
                                                                                             robiotin into a VS cell of a shakB2-mutant fly.
                                                                                             (F–H) Similar to (C)–(E) but for HS cells. Note the
                                                                                             strong coupling to descending neurons (arrows).
                                                                                             Scale bars, 50 mm (A), 10 mm (B), 3 mm (B’), and
                                                                                             25 mm (C–H).
                                                                                             See also Figures S5A and S5B.
F                             G                             H

                                                                                             prevent their membrane from spontane-
                                                                                             ously falling into an unstable, oscillatory
                                                                                             state.

                                                                                              Calcium oscillations in the VS and
                                                                                              HS cells of shakB-deficient flies
                                                                                              Our electrophysiological experiments only
                                                                                              allowed us to record from one cell at a
                                                                                              time. To study the oscillations that arise
                                                                                              in VS/HS cells at the network level and to
however, yet unknown variables determine whether a given             link the membrane potential oscillations we observed after shakB
neuron oscillates spontaneously or not.                              removal to corresponding changes in intracellular calcium levels,
   To analyze the amplitudes and frequencies of the sponta-          we performed two-photon calcium imaging of VS and HS cells.
neous oscillations, we performed Fourier spectrum analysis of        Neurons from control flies did not show any spontaneous calcium
the cells’ membrane potential fluctuations. Control flies showed     activity without visual stimulation (Figure 5A). In contrast, neurons
a power spectrum that fell off with increasing frequency, indica-    from shakB2-mutant flies displayed slow, large periodic rises and
tive of pure low-pass filtering. In contrast, the power spectra of   decays in calcium levels (Figure 5B; Video S1). We observed cal-
both shakB2-mutant and shakB-RNAi flies exhibited two promi-         cium oscillations in the majority of cells (on average 5.2 [=57.8%]
nent peaks (Figures 4G and 4H). We defined two frequency             of maximally 9 labeled LPTCs per fly) in these flies. The calcium
bands around these peaks and named them ultraslow-wave               oscillations were not restricted to the soma but occurred synchro-
(USW, 0.02–0.2 Hz) and b-oscillations (10–30 Hz), respectively,      nously throughout dendrites and axons as well (Video S2). Next,
in accordance with the nomenclature of brain oscillations            we performed pan-neuronal calcium imaging in flies that ex-
observed in the mammalian cortex.44,45 The average power in          pressed both GCaMP6f and shakB-RNAi in all neurons. Again,
both of these frequency bands was strongly increased in              LPTCs displayed large calcium oscillations—in fact, these cells
shakB-deficient flies when compared with control flies               were clearly distinguishable from all other labeled cells mainly
(Figures 4I and 4J). The median oscillation frequencies were         because of their large fluorescence changes (Figure 5C; Video
0.04 and 0.05 Hz for USW oscillations and 17.8 and 15.8 Hz for       S3). We did not observe obvious large calcium transients in the
b-oscillations, for shakB2-mutant and shakB-RNAi flies, respec-      rest of the lobula plate, suggesting that the induction of oscilla-
tively (Figures 4K and 4L). Notably, the oscillations in the b       tions after shakB removal is specific to LPTCs (Video S3). In addi-
frequency band displayed maximum frequencies that were just          tion to shakB2 mutant and shakB-RNAi flies, we also tested flies in
around or above the corner frequency of the low-pass filter-like     which the pan-neuronal knockdown of shakB was restricted to
power spectrum of control flies (Figures 4G and 4H). Interest-       adulthood by using the temperature-sensitive tubGal80ts trans-
ingly, this frequency range is highly reminiscent of the reported    gene (shakB-RNAi-tubGal80ts flies). We confirmed that tub-
resonant frequency of HS cells.25 Thus, VS and HS cells from         Gal80ts allowed for adult-specific RNAi knockdown by performing
flies that lack shakB often show spontaneous large-amplitude         immunohistochemical and electrophysiological control experi-
membrane potential oscillations, suggesting that, among others,      ments (Figures S6A–S6I). Importantly, shakB-RNAi-tubGal80ts
one possible function of electrical synapses in LPTCs is to          flies showed large spontaneous calcium oscillations similar to

2026 Current Biology 32, 2022–2036, May 9, 2022
ll
Article OPEN ACCESS
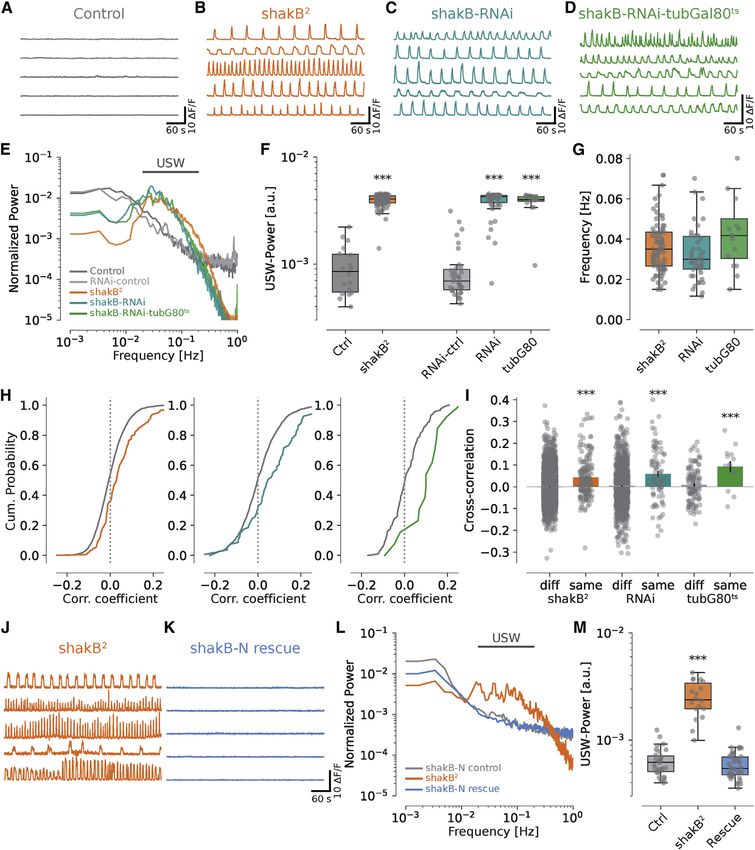
Figure 4. Electrophysiological recordings of VS/HS cells from shakB2-mutant and shakB-RNAi flies
(A) Membrane potential traces of VS and HS cells from Canton-S control flies without visual stimulation. Traces below show zoom-ins of a stretch of traces above.
(B–D) Similar to (A) but for shakB2-mutant (B), RNAi-control (C), and shakB-RNAi flies (D).
(E) Percentage of recorded cells showing none (light gray), only fast (b, medium gray), or fast and slow (b + USW, dark gray) membrane potential oscillations.
(F) Resting membrane potentials of indicated genotypes.
(G and H) Power spectra of membrane potentials for CS-control and shakB2-mutant (G) or RNAi-control and shakB-RNAi flies (H).
(I and J) Average power in the ultraslow frequency band (I) and b frequency band (J).
(K and L) Maximum oscillation frequency in the ultraslow frequency band (K) and b frequency band (L).
Data in (E) are from CS-control, n = 21; shakB2-mutant, n = 21; RNAi-control, n = 16; shakB-RNAi, n = 16 cells; in (F) from CS-control, n = 21; shakB2-mutant, n =
16; RNAi-control, n = 16; shakB-RNAi, n = 14 cells; and in (G)–(L) from CS-control, n = 21; shakB2-mutant, n = 12; RNAi-control, n = 16; shakB-RNAi, n = 9 cells.
Data in (F) are mean ± SEM. Boxplots in (I)–(L) show median (horizontal line), interquartile range Q1–3 (boxes), and Q1/Q3–1.5*IQR (whiskers). Dots show data
points from individual cells. Statistical analysis: (F) Welch’s t test and (I–L) Mann-Whitney U test. *p < 0.05, **p < 0.01, ***p < 0.001.
See also Figures S5C–S5F.
shakB2-mutant flies and flies in which RNAi expression occurred frequency of these slow oscillations (shakB2-mutant: 0.035 Hz,
throughout development (Figure 5D). Thus, the oscillations were shakB-RNAi: 0.030 Hz, shakB-RNAi-tubGal80ts: 0.042 Hz) was
not due to a defect caused by depletion of shakB during develop- similar to the USW oscillations of the cells’ membrane potential,
ment. Similar to the electrophysiological experiments, the power suggesting a correspondence between these two phenomena
in the USW band was significantly higher in shakB2-mutant and (Figure 5G). Importantly, the temporal properties of the calcium in-
both shakB-RNAi fly lines when compared with control flies dicator excluded the detection of possible fast b-oscillations at
(Figures 5E and 5F). Power spectrum analysis revealed that the the calcium level.
Current Biology 32, 2022–2036, May 9, 2022 2027
ll
      OPEN ACCESS                                                                                                                                 Article

Figure 5. Calcium imaging of VS/HS cells from shakB2-mutant, shakB-RNAi, and shakB-N rescue flies
(A–D) Calcium traces of VS and HS cells from control (A), shakB2-mutant (B), shakB-RNAi (C), and shakB-RNAi-tub-Gal80ts (D) flies.
(E) Power spectra of calcium traces.
(F) Average power in the ultraslow frequency band.
(G) Maximum oscillation frequency in the USW frequency band.
(H) Cumulative probability of the correlation coefficients for shakB2-mutant (left), shakB-RNAi (middle), and shakB-RNAi-tubGal80ts flies from cells within flies
(colors) and across flies (gray).
(I) Average correlation coefficients within (same) and across (diff) flies.
(J and K) Calcium traces of VS/HS cells from shakB2-mutant (J) and shakB-N rescue (K) flies.
(L and M) Power spectra (L) and USW power (M) of shakB-N control (gray), shakB2-mutant (orange), and shakB-N rescue (light blue) flies.
Data in (E)–(I): Ctrl, n = 4/18; shakB2-mutant, n = 16/83; shakB-RNAi-Ctrl, n = 7/35; shakB-RNAi, n = 11/46; shakB-RNAi-tubGal80ts, n = 11/16 flies/cells. Data in
(L) and (M): shakB-N control, n = 8/31; shakB2, n = 11/18; shakB-N rescue, n = 10/41 flies/cells. Boxplots in (F), (G), and (M) show median (horizontal line), in-
terquartile range Q1–3 (boxes), and Q1/Q3–1.5*IQR (whiskers). Data in (I) are mean ± SEM. Dots show data from individual cells (F and G) or pairwise correlations
(I). Statistical test in (F), (G), and (I): Mann-Whitney U test (Holm-corrected when comparing >2 experimental groups). *p < 0.05, **p < 0.01, ***p < 0.001.
See also Figure S6 and Videos S1, S2, and S3.

2028 Current Biology 32, 2022–2036, May 9, 2022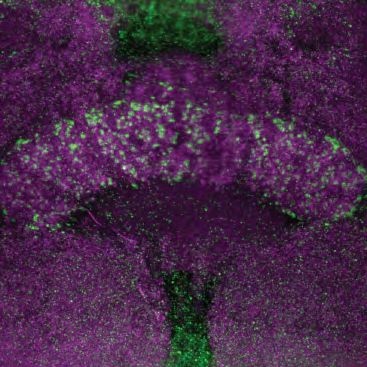
ll
Article                                                                                                                       OPEN ACCESS

   As we could image several cell bodies in the same recording,          PTX to block chemical synaptic input. After application of ivabra-
we analyzed if, and to which extent, the calcium oscillations in         dine, calcium oscillations did not cease but slowed down
different cells were synchronized. On average, we found only a           (Figures 6C and 6H–6J). Under the premise that ivabradine is simi-
weak, yet significant, positive cross-correlation between cal-           larly effective and specific at blocking Drosophila Ih as it is against
cium signals in all shakB-deficient fly lines (Figures 5H and 5I).       rabbit Ih, these results suggest that Ih channels play a role in setting
Thus, calcium levels in LPTCs do not oscillate in synchrony but          the frequency of these oscillations.
still exhibit weak positive correlations.                                   To test the potential role of Nav channels, we blocked chemical
   So far, our experimental approach did not allow us to pinpoint        synaptic input pharmacologically and then applied tetrodotoxin
the electrical connections whose loss induces oscillations. As           (TTX), a specific Nav-channel blocker. Application of TTX led to
cell-type-specific RNAi knockdown of shakB was unsuccessful              a complete cessation of calcium oscillations in all cells, showing
(Figure S6L), we performed shakB-rescue experiments in VS                that Nav channels are necessary for generating them
and HS cells. To do so, we specifically overexpressed the                (Figures 6D, 6H, and 6I). The dominant component of Nav-cur-
shakB-N isoform in VS/HS cells in an otherwise shakB2 mutant             rents rapidly inactivates within several milliseconds.49 This, and
background (shakB-N rescue flies). Immunostainings confirmed             our hypothesis that fast voltage oscillations and slow voltage/
that shakB was localized to the axon terminals of VS/HS cells but        calcium oscillations are functionally linked, prompted us to test
was absent from the rest of the brain (Figures S6J and S6K).             whether silencing Nav channels also eliminates fast membrane
Calcium imaging in these flies revealed that rescuing electrical         potential oscillations. In line with this prediction, VS and HS cells
synapses specifically between VS/HS cells prevents calcium os-           from shakB2 flies that displayed slow and/or fast oscillations
cillations (Figures 5J–5M). Thus, the loss of electrical synapses        turned completely silent after application of TTX (Figures 6K–
from VS/HS cells themselves (and not other cell types) is respon-        6M). These experiments suggest that Nav channels are directly
sible for inducing an oscillatory state.                                 involved in generating the fast spontaneous membrane potential
                                                                         oscillations. Notably, a subset of Drosophila Nav channels exhibit
Cell-intrinsic mechanisms generate oscillations                          persistent sodium currents49 that could contribute to slow oscil-
The low correlation between calcium oscillations in different cells      lations as well. However, Nav channels alone cannot account for
points toward a mainly cell-autonomous origin. To directly test if       the large hyperpolarized phases of the slow oscillations. Thus,
chemical synaptic connections between LPTCs themselves or                we propose that fast oscillations secondarily lead to slow voltage
chemical input from other cells drive or affect these oscillations,      and calcium oscillations by a mechanism that might involve Ih
we used pharmacology to block chemical synaptic transmission.            channels among others.
VS and HS cells receive mainly cholinergic, glutamatergic, and
GABAergic inputs.37 Therefore, we simultaneously applied meca-           Loss of electrical synapses impairs visual responses of
mylamine (MEC) to block excitatory cholinergic input and picro-          VS and HS cells
toxin (PTX) to interfere with inhibitory glutamatergic and               Finally, we investigated whether VS and HS cells of flies that lack
GABAergic input.46 By performing electrophysiological record-            shakB-type electrical synapses still respond to visual stimuli,
ings, we confirmed that this pharmacological cocktail indeed             despite showing membrane potential oscillations. We performed
blocked all fast synaptic input to these cells (Figures S7A–S7F). Af-    electrophysiological recordings and excluded cells with slow
ter blocking chemical synaptic input, LPTCs continued to display         membrane potential oscillations from the analysis. VS/HS cells of
calcium oscillations with similar power and frequency as before          control flies responded to moving sine wave gratings in a direc-
(Figures 6A, 6B, 6E, 6I, and 6J; Videos S4 and S5). This suggests        tion-selective manner by depolarizing to their preferred direction
that after removal of electrical synapses, VS/HS cells start to oscil-   and hyperpolarizing to their null direction. VS and HS cells from
late spontaneously and cell autonomously, without any synaptic           shakB-deficient flies still exhibited direction-selective responses,
drive. Interestingly, we found that the average cross-correlation        albeit at strongly reduced response amplitudes (Figures 7A–7D).
between calcium signals in these cells dropped to zero, suggesting       Interestingly, direction selectivity, as calculated by the normalized
that the weak correlation was caused by weakly synchronizing             vector sum of the responses (‘‘LDir’’), was unaffected (Figure 7E).
chemical synaptic input (Figures 6F and 6G). This could be due              To test whether ON and OFF motion pathways are differen-
to common synaptic input from T4 and T5 cells or possible chem-          tially affected by removing shakB, we stimulated VS/HS cells
ical connections between LPTCs themselves.                               by showing moving ON or OFF edges. Responses to ON and
                                                                         OFF motion stimuli were both reduced, but the OFF pathway
Voltage-gated sodium and Ih channels are involved in                     was affected more strongly (Figures 7F and 7G). In addition to di-
generating oscillations                                                  rection-selective input via T4/T5 cells, VS and HS cells receive
Our finding that the calcium oscillations in VS/HS cells arise cell      signals from a parallel luminance-sensitive pathway.50 To inves-
autonomously prompted us to investigate which cell-specific con-         tigate whether shakB gap junctions are important components
ductances generate these oscillations. Two prominent channels            of this ‘‘flicker pathway,’’ we presented full field bright and
that were shown to be involved in many neuronal oscillators are hy-      dark flashes to the flies. Although ON flicker responses were
perpolarization-activated Ih channels and voltage-gated sodium           left untouched by the loss of shakB, OFF flicker responses
Nav channels (in Drosophila termed ‘‘paralytic’’).47 In addition,        were strongly reduced (Figures 7H and 7I).
Nav channels have been implicated in generating the frequency-              Are the effects on visual processing at the level of VS/HS cells
dependent amplification of synaptic inputs in Calliphora HS cells        caused by removing shakB from these cells themselves or rather
mentioned earlier.25 First, to test the involvement of Ih channels,      by removing shakB from neurons in their upstream circuitry? To
we applied the Ih-antagonist ivabradine48 together with MEC and          decide between these alternatives, we measured visual calcium

                                                                                         Current Biology 32, 2022–2036, May 9, 2022 2029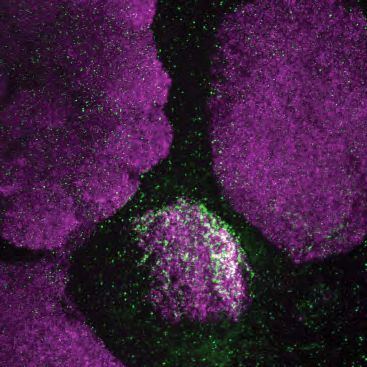
ll
      OPEN ACCESS                                                                                                                                   Article

                     A                            B                                C                               D

                 E                                       F                                                    G

                 H                                            I                                                     J

                 K                                                L                                     M                     N

Figure 6. Pharmacological profile of calcium and voltage oscillations in VS/HS cells from shakB2-mutant flies
(A–D) Calcium traces of VS and HS cells from shakB2-mutant flies before (A) and after application of mecamylamine and picrotoxin (MEC + PTX) (B), ivabradine
(IVA) (C), or tetrodotoxin (TTX) (D).
(E) Power spectra of calcium traces for control (gray) and shakB2-mutant flies either untreated (orange) or after application of MEC + PTX (dark blue).
(F) Cumulative probability of the correlation coefficients for shakB2-mutant flies before (left) and after MEC + PTX application calculated within same (colors) or
across different flies (gray).
(G) Correlation coefficients within (same) and across (diff) shakB2-mutant flies before and after application of MEC + PTX.
(H) Power spectra of calcium traces for indicated experiments.
(I) Average power in the ultraslow frequency band (USW).
(J) Maximum oscillation frequency in the USW frequency band.
(K) Representative voltage traces of VS/HS cells from shakB2-mutant flies before (orange) and after treatment with TTX (purple).
(L) Power spectra of membrane potentials of shakB2-mutant flies before (orange) and after application of TTX (purple).
(M and N) Average power in the USW frequency band (M) and b frequency band (N) for flies in (K) and (L).
Data in (E)–(J) are from Ctrl, n = 4/17; shakB2-mutant, n = 9/48; shakB2 MEC+PTX, n = 9/48; shakB2 IVA, n = 6/31; shakB2 TTX, n = 4/18 flies/cells. Data in (L)–
(N) are from shakB2-mutant, n = 5/5 cells/flies. Boxplots in (I), (J), (M), and (N) show median (horizontal line), interquartile range Q1–3 (boxes), and Q1/
Q3–1.5*IQR (whiskers). Data in (G) are mean ± SEM. Dots show data from pairwise correlations (G) or individual cells (I, J, M, and N). Statistical test in (G), (I),
(J), (M), and (N): Mann-Whitney U test (Holm-corrected when comparing >2 experimental groups). *p < 0.05, **p < 0.01, ***p < 0.001.
See also Figures S7A–S7F and Videos S4 and S5.

2030 Current Biology 32, 2022–2036, May 9, 2022
ll
Article OPEN ACCESS
A B
C D E
F G
H I
J K L M
Figure 7. Electrophysiological responses of VS and HS cells from shakB2-mutant and shakB-RNAi flies to visual stimuli
(A) Average voltage response traces of VS/HS cells from CS-control (gray) and shakB2-mutant flies (orange) to preferred- (left) and null-direction grating motion.
(B) Similar to (A) but for VS/HS cells from RNAi-control (gray) and shakB-RNAi flies (turquoise).
(C) Directional tuning curves for CS-control and shakB2-mutant flies (left) and RNAi-control and shakB-RNAi flies.
(D and E) Response strength (PD-ND) (D) and direction selectivity (E) of VS/HS cells to moving gratings.
(legend continued on next page)
Current Biology 32, 2022–2036, May 9, 2022 2031ll
OPEN ACCESS Article
responses in flies in which shakB-N was rescued in VS/HS cells. nervous system,9–11 surprisingly, no study has yet investigated
The results of these measurements closely resembled those of the abundance and distribution of electrical synapses
the electrophysiological experiments in shakB2-mutant and throughout that tissue. Here, we took the first steps in filling
shakB-RNAi flies: VS/HS cells from shakB-N rescue flies this gap.
continued to show strongly reduced responses to drifting grat- We first described the expression patterns of all eight innexins
ings, although their direction selectivity was unimpaired in the adult central nervous system of Drosophila based on
(Figures 7J–7L). Additionally, responses to moving ON and OFF immunohistochemistry. We found that some innexins are not ex-
edges were both reduced in amplitude, however, again with a pressed, others exclusively in glial cells, and still others only
much more pronounced effect on the OFF pathway (Figure 7M). sparsely in the CNS (Figures 1 and S1–S3). According to our im-
Thus, the removal of electrical synapses from visual circuits up- munostainings, shakB is the only innexin that is widely ex-
stream of VS/HS cells is responsible for their impaired responses pressed in many neurons of the brain and VNC. Interestingly,
to visual motion stimuli. both the immunostainings and the shakB-Trojan-Gal4 reporter
lines suggest that shakB gap junctions are more abundant in pri-
Visual responses of T4/T5 cells mirror VS/HS cell re- mary and secondary sensory areas of the brain and much less so
sponses in shakB-deficient flies in higher brain centers such as the central complex or mushroom
The results of the previous section predict that similar effects of body.
shakB removal should already be present at the level of the major Our immunohistochemical results are largely in agreement
presynaptic inputs to VS/HS cells—the T4 and T5 cells. To test with published RNA sequencing datasets (Figure S3B):37–40
this prediction, we performed two-photon calcium imaging Here, mRNAs for zpg, inx5, inx6, and inx7 were found to be
from the axon terminals of upward-preferring T4/T5c cells23 not or only very weakly expressed. We did not detect zpg and
while presenting moving ON and OFF edges (Figures S7G– inx7 protein, and inx5 and inx6 only localized sparsely to single
S7J). At the level of calcium, T4 and T5 neurons respond exclu- brain regions. A study that performed cell-type-specific RNA
sively to either ON or OFF motion51,52 allowing us to separate sequencing of many cells in the optic lobes detected shakB
them by their responses to the stimulus. Calcium signals in the mRNA in ca. 75% of tested cell types.37 Although this is in qual-
axon terminals of both T4 and T5 cells from control flies were itative agreement with our finding that shakB is widely ex-
narrowly tuned to upward motion. T4 and T5 cells from pressed, our shakB-Trojan-Gal4 reporter lines clearly label less
shakB2-mutant flies also responded in a direction-selective than 75% of cells in the optic lobes or CNS. Further differences
manner. However, similar to the electrophysiological measure- to that study37 exist as well: although inx3 mRNA was highly ex-
ments in postsynaptic VS/HS cells, the response amplitudes pressed in all sequenced cells, we detected inx3 protein only in
were reduced in both T4 and T5, again with a slightly stronger, neuropil ensheathing glia. Furthermore, we did not detect
however more variable, effect on T5 cells (Figures S7H and expression of inx7, despite high RNA levels in all photoreceptor
S7I). When calculating the direction-selectivity index, no differ- subtypes. Whether such differences can be explained by the fact
ence between controls and shakB2-mutant flies was found that high mRNA levels do not necessarily predict high protein
(Figure S7J). levels or by limitations of one or the other method remains to
Taken together, these results suggest that shakB electrical be investigated.
synapses in the optic lobe—upstream of T4/T5 cells—play Our description of innexin distribution based on immunostain-
crucial roles in processing motion- and nonmotion-related visual ings has obvious limitations: With the exception of shakB, we did
information but are not essential for the emergence of direction not validate the signal specificity of the antibodies in genetic
selectivity. knockout fly lines. However, most of the antibodies that we ob-
tained from other researchers were validated in publications
DISCUSSION from these labs.4,7,20,21 Furthermore, we used two different anti-
bodies per innexin and obtained similar results (Figures 1 and
Patterns of gap junction expression in the Drosophila S1). One caveat of our immunohistochemical approach is that
central nervous system cells that weakly express innexin proteins might fall below the
Although large efforts have been made in generating a complete detection limit. This might explain, for example, why we did not
‘‘chemical synaptic connectome’’ of the adult Drosophila detect clear innexin expression in the mushroom body, whereas
(F and G) Average response traces (F) and average response amplitudes (G) of VS/HS cells to ON and OFF motion stimuli moving in PD.
(H) Average voltage responses of VS/HS cells to full field ON (left) and OFF flicker stimuli. Vertical dotted lines indicate stimulus onset.
(I) Maximum responses to flicker stimuli calculated from the early response peak.
(J–L) Calcium response traces to PD-motion (J), directional tuning curves (K), and direction selectivity (L) of VS/HS cells from shakB-N control (gray) and shakB-N
rescue (light blue) flies stimulated with moving gratings.
(M) Directional tuning curves of VS/HS cells from shakB-N-control and shakB-N rescue flies to moving ON and OFF edges measured with calcium imaging.
Data in (A)–(E): CS-control, n = 21; shakB2-mutant, n = 14; RNAi-control, n = 17; shakB-RNAi, n = 8 cells. Data in (F) and (G): CS-control, n = 17; shakB2-mutant, n =
20; RNAi-control, n = 16; shakB-RNAi, n = 12 cells. Data in (H) and (I): CS-control, n = 15; shakB2-mutant, n = 16; RNAi-control, n = 15; shakB-RNAi, n = 9 cells.
Data in (J)–(M): shakB-N control, n = 25 (J–L) or n = 27 (M); and shakB-N rescue, n = 26 (J–L) or n = 25 (M) cells. Data from VS and HS cells were pooled because no
obvious differences in their responses were detected. Data in (C)–(E), (G), (I), and (K)–(M) are mean ± SEM. Dots indicate individual cells. Gray-shaded areas in (A),
(B), (F), and (J) indicate stimulus motion. Statistical analysis: Welch’s t test. Statistical testing in (K) and (M) was performed by comparing response strengths
(PD-ND) similarly to (D). *p < 0.05, **p < 0.01, ***p < 0.001.
See also Figures S7G–S7J.
2032 Current Biology 32, 2022–2036, May 9, 2022ll
Article OPEN ACCESS
other studies have found several innexin subtypes to be involved level of calcium. Moreover, slow USW oscillations only occured
in mushroom body function.19–21 As another limitation, the in cells that show fast b-oscillations. Consequentially, we
spatial resolution of confocal microscopy does not allow for an consider it plausible that the fast voltage oscillations directly
unambiguous assignment of innexin expression to specific cell induce the slow oscillations. The coupling between voltage and
types. Here, a recent study suggests that the use of expansion calcium oscillations could then potentially occur via calcium-
microscopy can solve this problem.53 Nonetheless, our activated potassium channels such as slowpoke. The exact
approach can help to narrow down the list of candidate cells mechanistic links between fast and slow voltage oscillations
that might form electrical synaptic connections. Similarly, our and calcium oscillations, however, are yet unknown and must
shakB-Trojan-Gal4 reporter lines do not give definitive evidence be further investigated in the future.
about all cell types that express shakB but can serve as a useful What is the functional role of electrical synapses in the lobula
guide for identifying cell types for closer investigation. plate network? We speculate that under normal conditions,
To circumvent some of the problems mentioned above, prom- these connections might form a safety net for VS and HS cells
ising approaches include the generation of fly lines that allow for to keep their nonlinear membrane conductances in check by
the conditional, endogenous tagging of innexin proteins.43,54,55 buffering cell-intrinsic noise via dissipating it through the coupled
Once a cell type has been identified to express gap junction pro- network. Only a synaptic stimulus of the right frequency and
teins, the next step is to test if, and to which cells, it is electrically strength, acting on one or multiple connected cells synchro-
coupled. In this study, we used whole-cell patch clamp record- nously, would engage the nonlinear mechanisms that lead to
ings and neurobiotin injections to identify the electrically coupled an amplification of these signals. If electrical synapses are
partners of VS and HS cells. This technique is labor intense and missing, the cell-intrinsic noise itself is sufficient to induce spon-
therefore not easily scalable. Alternative techniques that depend taneous oscillations at the resonant frequency of these cells.
on the targeted delivery of gap junction-permeable molecules to Interestingly, it has been shown that active conductances in
a genetically defined cell population circumvent the manual in- HS cells lead to an amplification of high-frequency inputs that
jection step but suffer from low signal-to-noise ratios.56,57 Unfor- would otherwise be attenuated by the low-pass properties of
tunately, with both approaches, the identification of coupled cell the passive membrane.25 LPTCs receive such high-frequency in-
types is difficult because all connected cells are labeled simulta- puts when the fly is confronted with fast visual motion. Thereby,
neously. In the end, improvements in EM technology, such as this amplifying mechanism increases the dynamic range of these
enhancing the resolution to detect gap junctions in large-scale cells. Therefore, we consider it plausible that the spontaneous
datasets or genetic tagging of gap junction proteins combined oscillations we observe in VS/HS cells after removal of shakB
with electron-dense labeling,58 would solve many of the issues and the frequency-dependent amplification of synaptic inputs
discussed above. Such a technique would not only allow for might be based on the same underlying conductance changes.
the identification of cells that form electrical synapses but also This hypothesis, however, is difficult to test experimentally and
reveal all of their connected partners. must await further investigations.
Intrinsic oscillations and function of electrical synapses Visual processing and electrical synapses
in VS and HS cells Several studies used the fly Calliphora to investigate how electri-
Removing shakB gap junctions through a null mutation or pan- cal coupling between LPTCs affects their complex receptive field
neuronal knockdown induced fast and slow membrane potential structure.31,32 Subsequent studies then built on these results and
oscillations as well as large calcium oscillations in VS and HS cells. performed computational modeling to show that axo-axonal gap
This is unexpected because in many neural networks, exactly the junctions between LPTCs can increase robustness and efficiency
opposite is the case—electrical coupling is necessary for gener- of coding.30,33,34 The spontaneous oscillations, which arise in VS/
ating network oscillations by synchronizing neural activity.59,60 HS cells without electrical synapses, complicate the detailed
Similarly, gap junctions between cardiomyocytes function to experimental investigation of these models. Thus, we chose to
stabilize and synchronize electrical activity throughout the focus on the origin of these oscillations and on the role of electri-
myocardium.61 In the present study, VS and HS cells continued cal synapses in upstream visual circuits in this study.
to oscillate when isolated from synaptic input and ceased to do Loss of shakB electrical synapses led to a reduction of the
so when rescuing shakB cell type specifically. These two findings response magnitudes of T4/T5 and VS/HS cells to both ON
argue that the oscillations are not due to network effects but arise and OFF motion stimuli and to an almost complete loss of OFF
cell autonomously, owing to a loss of shakB from VS/HS cells flicker sensitivity in VS/HS cells. Conversely, the degree of direc-
themselves. Furthermore, adult-specific RNAi knockdown of tion selectivity—that is, the sharpness of tuning—was unaf-
shakB suggests that the oscillations are not caused by develop- fected. Thus, the elementary computation of motion direction
mental defects. However, as immediate pharmacological block does not directly depend on electrical synapses. How and at
of gap junctions was unsuccessful (Figure S6M), we cannot rule which level in the visual processing pathway do electrical synap-
out that the oscillations are in part shaped by adaptive mecha- ses affect the responses T4/T5 and VS/HS cells? Since shakB
nisms that occur on the timescales of hours or days. mRNA is not or only very weakly expressed in T4/T5 cells,37
We partially uncovered the biophysical mechanisms that the electrical connections responsible for these effects are likely
generate oscillations by showing that Nav channels are neces- to be found upstream in the medulla or lamina. Future investiga-
sary and Ih channels influence their temporal dynamics. Interest- tions can now pinpoint the neural and synaptic substrates of
ingly, application of the Nav antagonist TTX blocked both types these effects by identifying candidate cell types and connec-
of oscillations at the level of the membrane potential and at the tions. One such promising candidate is the lamina monopolar
Current Biology 32, 2022–2036, May 9, 2022 2033ll
OPEN ACCESS Article
cell L4. shakB colocalizes with the dendrites of L4 cells in the ACKNOWLEDGMENTS
proximal lamina and a shakB-Trojan-Gal4 line labels this cell
We thank Christoph Kapfer and Romina Kutlesa for generating the anti-shakB
type (Figures S4F–S4I). Additionally, L4 cells are important for
serum antibody; Lukas Groschner for proofreading the manuscript; John Tut-
OFF motion detection both at the level of VS/HS cells and hill and Anne Sustar for help with genotyping shakB flies; Guy Tanentzapf,
behavior.62,63 The loss of electrical synapses from L4 cells might Chia-Lin Wu, Ann-Shyn Chiang, and Reinhard Bauer for sharing anti-innexin
therefore contribute to the reduced responsiveness to OFF mo- antibodies; and Rodney Murphey for providing the shakB2-mutant fly line. This
tion and flicker stimuli observed in VS and HS cells. work was funded by the Max Planck Society.
Notably, we only probed a narrow set of visual stimuli. It is
likely that electrical synapses play further important roles in other AUTHOR CONTRIBUTIONS
visual regimes, such as under noisy, low-contrast or low-lumi-
G.A. conceived the study, performed and analyzed all experiments, and wrote
nance conditions, as is the case for electrical synapses in the the manuscript. R.V. helped with antibody design and validation. R.V. and S.F.
mammalian retina.64 Moreover, in the mammalian retina, the generated fly lines. A.B. provided funding. A.B., R.V., and S.F. commented on
strength of electrical coupling between neurons is dynamic the manuscript.
and can change depending on ambient luminance or circadian
rhythm.65 It will be interesting to see if similar mechanisms are DECLARATION OF INTERESTS
at work in invertebrate visual systems. Furthermore, we only
The authors declare no competing interests.
tested the output of a single visual stream. Future research will
show which functions electrical synapses exhibit in circuits for INCLUSION AND DIVERSITY
phototaxis, color vision, contrast vision, or small object detection
but also in other regions of the nervous system such as the cen- One or more of the authors of this paper self-identifies as an underrepresented
tral brain or VNC. ethnic minority in science. One or more of the authors of this paper self-iden-
Taken together, our study describes the anatomical distribu- tifies as a member of the LGBTQ+ community.
tion and demonstrates essential functional roles of electrical syn-
Received: August 4, 2021
apses in the Drosophila nervous system. Incorporating electrical
Revised: February 16, 2022
synaptic connections into future connectomes9 and brain-wide Accepted: March 14, 2022
computational models,66,67 and using the rich Drosophila tool Published: April 5, 2022
kit to investigate the functional properties of these connections,
will expand our understanding of their contribution to information REFERENCES
processing in the fly brain and in nervous systems in general.
1. Skerrett, I.M., and Williams, J.B. (2017). A structural and functional com-
parison of gap junction channels composed of connexins and innexins.
STAR+METHODS Dev. Neurobiol. 77, 522–547.
2. Alexopoulos, H., Böttger, A., Fischer, S., Levin, A., Wolf, A., Fujisawa, T.,
Detailed methods are provided in the online version of this paper Hayakawa, S., Gojobori, T., Davies, J.A., David, C.N., and Bacon, J.P.
and include the following: (2004). Evolution of gap junctions: the missing link? Curr. Biol. 14, R879–
R880.
d KEY RESOURCES TABLE 3. Oshima, A., Tani, K., and Fujiyoshi, Y. (2016). Atomic structure of the
d RESOURCE AVAILABILITY innexin-6 gap junction channel determined by cryo-EM. Nat. Commun.
B Lead contact 7, 13681.
B Materials availability 4. Bohrmann, J., and Zimmermann, J. (2008). Gap junctions in the ovary of
Drosophila melanogaster: localization of innexins 1, 2, 3 and 4 and evi-
B Data and code availability
dence for intercellular communication via innexin-2 containing channels.
d EXPERIMENTAL MODEL AND SUBJECT DETAILS BMC Dev. Biol. 8, 111.
B Fly husbandry
5. Speder, P., and Brand, A.H. (2014). Gap junction proteins in the blood-
d METHOD DETAILS brain barrier control nutrient-dependent reactivation of Drosophila neural
B Generation of fly lines stem cells. Dev. Cell 30, 309–321.
B Antibody generation 6. Zhang, S.L., Yue, Z., Arnold, D.M., Artiushin, G., and Sehgal, A. (2018). A
B Immunohistochemistry circadian clock in the blood-brain barrier regulates xenobiotic efflux. Cell
B Confocal microscopy 173, 130–139.e10.
B Electrophysiology 7. Smendziuk, C.M., Messenberg, A., Vogl, A.W., and Tanentzapf, G. (2015).
B Calcium imaging Bi-directional gap junction-mediated soma-germline communication is
B Visual stimulation essential for spermatogenesis. Development 142, 2598–2609.
B Pharmacology 8. Harris, K.P., and Littleton, J.T. (2015). Transmission, development, and
plasticity of synapses. Genetics 201, 345–375.
d QUANTIFICATION AND STATISTICAL ANALYSIS
9. Scheffer, L.K., Xu, C.S., Januszewski, M., Lu, Z., Takemura, S.Y.,
B Data analysis
Hayworth, K.J., Huang, G.B., Shinomiya, K., Maitlin-Shepard, J., Berg,
B Statistical analysis
S., et al. (2020). A connectome and analysis of the adult Drosophila central
brain. eLife 9, e57443.
SUPPLEMENTAL INFORMATION 10. Zheng, Z., Lauritzen, J.S., Perlman, E., Robinson, C.G., Nichols, M., Milkie,
D., Torrens, O., Price, J., Fisher, C.B., Sharifi, N., et al. (2018). A complete
Supplemental information can be found online at https://doi.org/10.1016/j. electron microscopy volume of the brain of adult Drosophila melanogaster.
cub.2022.03.040. Cell 174, 730–743.e22.
2034 Current Biology 32, 2022–2036, May 9, 2022You can also read