In situ ground-based mobile measurement of lightning events above central Europe
←
→
Page content transcription
If your browser does not render page correctly, please read the page content below
Atmos. Meas. Tech., 16, 547–561, 2023
https://doi.org/10.5194/amt-16-547-2023
© Author(s) 2023. This work is distributed under
the Creative Commons Attribution 4.0 License.

In situ ground-based mobile measurement of lightning
events above central Europe
Jakub Kákona1,2 , Jan Mikeš1 , Iva Ambrožová2 , Ondřej Ploc2 , Olena Velychko2 , Lembit Sihver2,3 , and
Martin Kákona2
1 Facultyof Electrical Engineering, Czech Technical University in Prague, 166 27 Prague, Czech Republic
2 NuclearPhysics Institute of the Czech Academy of Sciences, 250 68 Řež, Czech Republic
3 Department of Radiation Physics, Atominstitut, Technische Universität Wien, 1020 Vienna, Austria

Correspondence: Jakub Kákona (kakonjak@fel.cvut.cz)

Received: 23 May 2022 – Discussion started: 10 October 2022
Revised: 6 December 2022 – Accepted: 7 December 2022 – Published: 30 January 2023

Abstract. This article describes the equipment (and the ad-         Storm activities are also associated with the generation
vantages of the equipment) used for in situ ground measure-      of ionizing radiation. It is believed that this radiation is
ments of thunderstorm phenomena with measuring cars. By          bremsstrahlung (“deceleration radiation”) generated by elec-
using all-sky high-speed cameras, radio receivers, and elec-     trons accelerated by an electric field in thunderclouds. The
tric field measurements, typical lightning discharges in the     electrons that are accelerated to relativistic velocities are
central European region have been characterized. Measure-        called relativistic runaway electron avalanches (RREAs), and
ments of ionizing radiation during storms using a gamma          these RREAs then interact with the atoms in the atmosphere
spectrometer were also performed. At ground level, no ion-       (Dwyer, 2003; Gurevich et al., 1992). This causes a phe-
izing radiation originating from storm clouds was detected,      nomenon that is often inaccurately called terrestrial gamma-
although during other experiments (using the same equip-         ray flash (TGF) (Fishman et al., 1994) or other phenomena
ment at lower altitudes corresponding to the lower part of       like thunderstorm ground enhancement (TGE) (Chilingarian,
storm clouds) ionizing radiation was detected. We showed         2013; Torii et al., 2002). Furthermore, experimental results
that radio antennas with appropriately constructed receivers     have shown that other ionizing radiation manifestations gen-
and all-sky high-speed cameras are devices that can signif-      erated by storms exist. For example, there has been exper-
icantly contribute to the understanding of processes taking      imental evidence of the interaction of high-energy photons
place in storm clouds during lightning discharges. On the        with the atmosphere causing nuclear reactions (Enoto et al.,
contrary, measurements of the vertical electric field did not    2017). The ionizing radiation that is thought to be associated
provide any new information about the processes occurring        with storm activity has been measured using satellites in orbit
in thunderclouds.                                                around the Earth (e.g., Østgaard et al., 2019), using aircraft
                                                                 flying inside or in the vicinity of storm clouds (Chilingar-
                                                                 ian et al., 2011; Kochkin et al., 2017; McCarthy and Parks,
1   Introduction                                                 1985; Parks et al., 1981), or using high-mountain observa-
                                                                 tories e.g., (Chum et al., 2020; Tsuchiya et al., 2009). Cur-
The activity of storms is associated with many processes, the    rently, there are only a few measurements that could confirm
natures of which are not yet fully understood nor clarified.     the existence of ionizing radiation at lower altitudes; how-
This includes the process of cloud electrification and subse-    ever, special storms that occur in the winter season in Japan,
quent electric discharge, which is the most prominent man-       during which storm clouds emerge low above the ground, are
ifestation of thunderstorms. As a result, the forecasting and    an exception (Michimoto, 2007).
prediction of storm activity and the related dangers are often      One of the most interesting measurements performed to
very unreliable.                                                 date has been the mapping of a radio signal emitted by

Published by Copernicus Publications on behalf of the European Geosciences Union.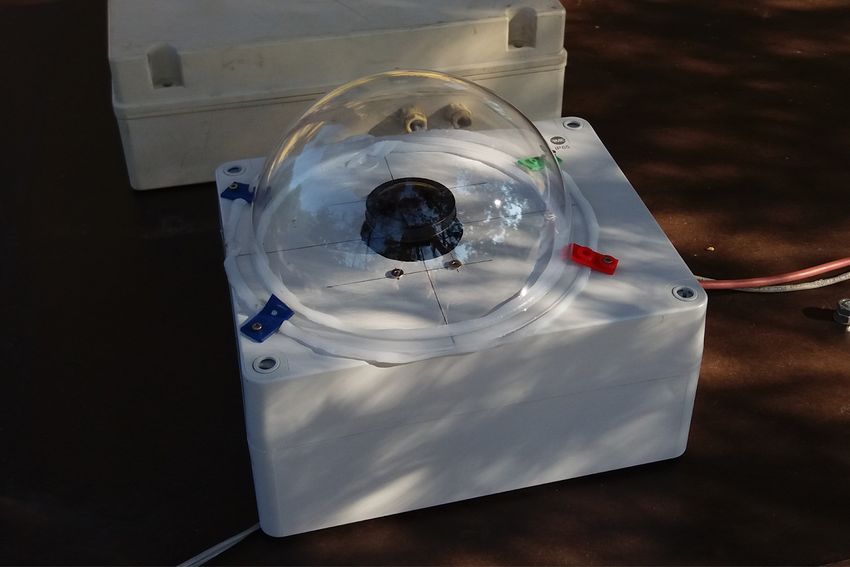
548                 J. Kákona et al.: In situ ground-based mobile measurement of lightning events above central Europe

lightning (Rison et al., 1999; Wu et al., 2018). TGF obser-
vations utilizing ground detectors with simultaneous light-
ning mapping using radio signals exist (Abbasi et al., 2018).
Despite these very detailed observations, the exact location
of the source of the ionizing radiation within the storm
cloud remains unknown (Belz et al., 2020). Moreover, TGFs
have only rarely successfully been measured at ground level
(Kereszy et al., 2022; Rakov and Kereszy, 2022; Dwyer et al.,
2012; Wada et al., 2019).
   To be able to measure the different processes that oc-
cur during thunderstorms, we equipped cars with measuring
equipment. These cars are able to move to locations with pre-
dicted storm activity and, thus, react to specific storm devel-
opments and perform ground measurements directly at the
storm site.                                                         Figure 1. The CAR0 measuring car with the instruments mounted
   During the 2021 summer storm season, we carried out              on the roof platform.
many expeditions in the Czech Republic and Slovakia using
the equipment described in detail below. This allowed us to
measure the electrostatic, magnetic, electromagnetic, and op-
tical properties of storms, including ionizing radiation. In this
paper, we present the results of these measurements and out-
line how we characterized the recorded lightning events, es-
pecially their duration. We relate optical observations to mea-
surements of electromagnetic radiation in the radio spectrum
and to changes in the electric and magnetic fields at the mea-
suring site. Via the comparison of different obtained light-
ning records with each other, we are able to reconstruct the
individual phases of the lighting events in the optical spec-
trum.

2     Measuring equipment
                                                                    Figure 2. Camera with a wide-angle CS camera lens and equipped
In order to determine the necessary parameters of lightning         with an infrared-blocking filter mounted in front of the LUX1310
                                                                    CMOS sensor.
activity (lightning events’ timestamps, lightning type, and lo-
cation), we equipped two measuring cars, CAR0 and CAR1,
with high-speed all-sky cameras and radio receivers (see            of the videos saved was H.264, resulting in MPEG-4 (.mp4)
Fig. 1). The cars were used to transport and power the in-          video, which sacrifices some quality for better compression.
struments in the proximity of thunderstorms. The car cabin          The main possible loss is gamma-encoded brightness, which
also served as partial protection for instrument operators.         possibly alters the absolute values of the real brightness of
                                                                    recorded lightning.
2.1    High-speed all-sky cameras                                      The camera lenses that we used were FE185C057HA-1
                                                                    (Fujifilm, 2021). Therefore, the high-speed camera was only
A Chronos 1.4 (CR14-1.0-16M) camera (KronTechInc.,                  sensitive to visible light. This spectral baseband was selected
2021) was mounted in a waterproof SolidBox 69200. The               to minimize the absorption of light generated by lightning in
box was covered with a plexiglass dome, 200 mm Duradom              the atmosphere.
as per the manufacturer’s designation, and is depicted in
Fig. 2.                                                             2.2   Radio frequency receivers
   The video resolution of the camera is 928 pixels × 928
pixels with 1612.33 frames per second and a constant shut-          Different radio frequency receivers were used to record the
ter speed from 4.9 to 34 µs during daytime thunderstorms            radio emissions generated by lightning activities. The main
and a maximal shutter speed of 614.6 µs during nighttime            objective was to cover a wide radio frequency band. The
thunderstorms. The shutter speed is set by the instrument op-       very low frequency (VLF) radio frequency band is known
erator depending on current weather conditions. The video           to be sensitive mainly to large (size) and high-current light-
length saved by the camera was set to 2 or 3 s. The format          ning channels, such as the return stroke. On the contrary, the

Atmos. Meas. Tech., 16, 547–561, 2023                                                 https://doi.org/10.5194/amt-16-547-2023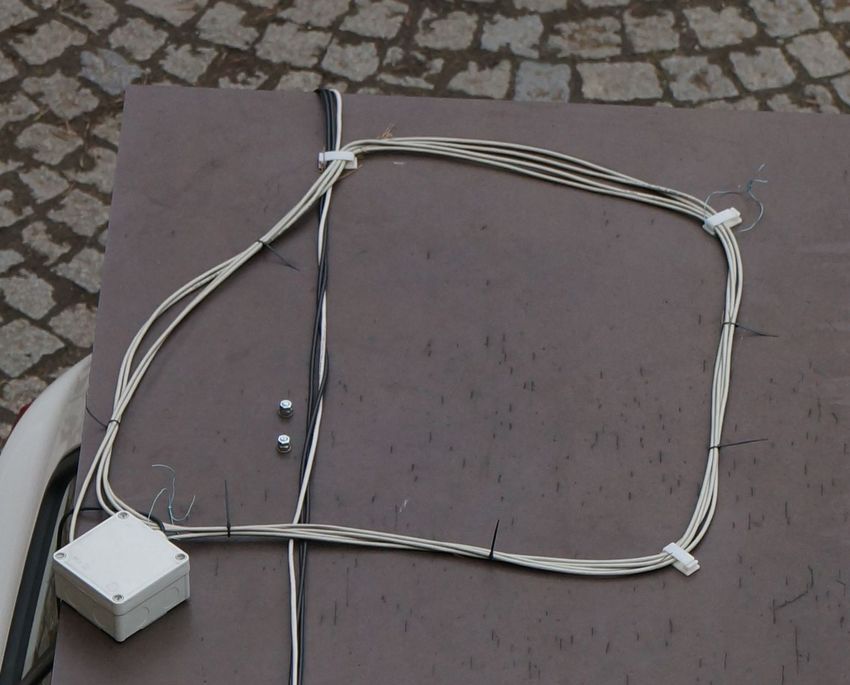
J. Kákona et al.: In situ ground-based mobile measurement of lightning events above central Europe 549
Figure 3. The STP loop antenna, mounted on the CAR1, has a res-
onant frequency of 100 kHz. Its signal was directly sampled by an
oscilloscope placed inside the car.
ultrahigh-frequency (UHF) radio frequency band involves ra-
diation almost exclusively associated with the fine structure
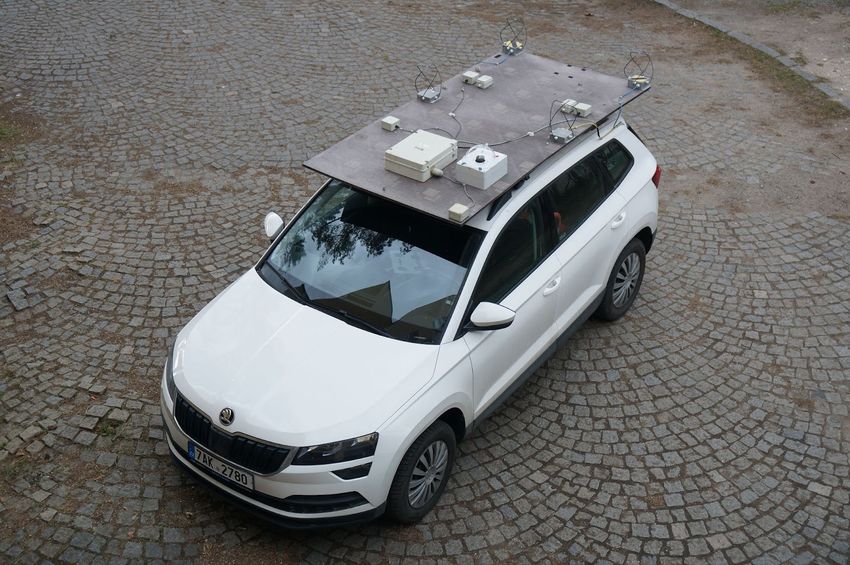
of lightning (Shi et al., 2019). Figure 4. The platform of a QFH receiver antenna is shown in
panel (a). Detailed pictures of the antenna can be seen in panel (c),
2.2.1 VLF signal receiver and the receiver is shown in panel (b).
The VLF signal receiver is based on a magnetic loop antenna
and storage oscilloscope with a control computer for the data platform of the measuring car, as shown in Figs. 1 and 4. The
readout. For one lightning event, we could record 800 ms of signal from each antenna is directly down-converted by a ra-
8 bit samples with a sampling rate of 250 MS s−1 (mega sam- dio frequency mixer to I (in-phase) and Q (quadrature signal)
ples per second). analog channels. Each channel is sampled by a 12 bit analog-
The antenna design was based on the use of the VL- to-digital converter at 10 MS s−1 .
FANT01 (MLAB, 2017) module, with the 10 m shielded The construction of the receiver itself is designed in a way
twisted-pair (STP) cable coiled into four loops (STP an- that enables a phase processing of the signal from the an-
tenna). The STP antenna loop was placed horizontally di- tenna array with the aim of detailed mapping of the discharge
rectly on the plywood base mounted on the car roof (see (UST, 2021). However, in the case of this experiment, only
Fig. 3 for details). the scalar envelope of the radio signal is considered. A block
This VLF receiver system was also used for the detection diagram of the receiver is shown Fig. A1 in Appendix A.
of lightning and for triggering other instruments in the cars. The radio receiver, in the case of an external trigger,
The detection of lightning was based on the pulse width and records a section of the configurable length of pre-trigger and
the signal level; both parameters were set by the operator dur- post-trigger blocks which are up to 1.45 s long. The radio sig-
ing the thunderstorm event. The range of these parameters is nal is simultaneously sampled from the whole antenna array.
usually 5 to 20 µs for the pulse width and 10 to 30 mV for the This feature is achieved using a ring buffer that stores the
signal level. An example of the measured signal can be seen samples before the trigger. Due to a pulse-per-second (PPS)
in Sect. 4.3. signal from an external Global Navigation Satellite System
(GNSS) receiver, the resulting recorded file at the same time
2.2.2 UHF signal receiver contains the sub-microsecond absolute time of each recorded
sample.
The UHF receiver operates approximately in the 370– The antennas are mounted on an electrically nonconduc-
406 MHz band, although the exact tuning depends on the lo- tive, 18 mm thick plywood board (identical to CAR 1 with a
cal noise within the 10 MHz receiver bandwidth. The signal VLF receiver) that is attached to the roof of the measuring
is received by an array of four quadrifilar helicoidal (QFH) car by crossbars, located above the car’s metal roof.
antennas mounted in a square-like configuration on the roof
https://doi.org/10.5194/amt-16-547-2023 Atmos. Meas. Tech., 16, 547–561, 2023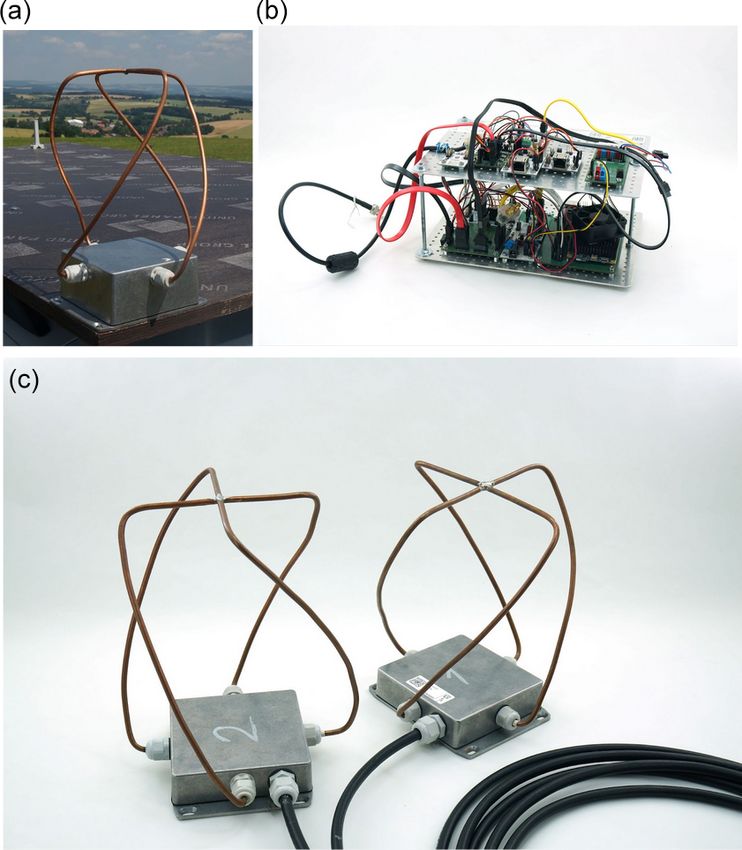
550                  J. Kákona et al.: In situ ground-based mobile measurement of lightning events above central Europe

   The construction of a single antenna array element is based    ment of radiation change, including the local radiation back-
on the QFH design. The antenna contains two loops that are        ground parameters.
joined together on one side and connected to the active ana-         During the measurement campaigns, the data recording
log fronted printed circuit board (PCB) of the antenna (QFH-      method was developed. During the first campaigns, we were
MIX01) on the other side. The QFHMIX01 PCB is mounted             trying to make automatic recordings based on observed elec-
in a metal enclosure. The antenna half-loops pass through         tromagnetic signals. This system, however, had a lot of im-
the enclosure wall via waterproof cable glands. Each joint        perfections that ultimately led to the system’s abandonment
of the half-loop and QFHMIX01 PCB is considered a 40             in measuring car CAR0, where it was replaced by the manual
port. The signal on each port has a 90◦ signal phase shift in     activation of recording (see Fig. 5). The manual activation of
relation to the next port. This feature allows the processing     recording was based on the visual perception of the operator
of the signal from the antenna as quadrature I/Q data, which      (the observation of lightning activity). In contrast to CAR0,
significantly increases the capabilities of subsequent signal     CAR1 maintained a semi-automatic method of activating the
processing.                                                       recording in order to compare the efficiency of both trigger
                                                                  methods. Thus, CAR1 had a recording trigger based on using
2.3    Ionizing radiation detectors                               a loop antenna and oscilloscope which generated triggers for
                                                                  other devices based on amplitude measurements and a length
During the whole measuring campaign, NaI(Tl) ionizing             of voltage pulse on antenna output (see Fig. 6). The trigger
radiation detector sensors and a silicon photomultipliers         signal was distributed via the Ethernet network, which was a
(SiPM) were used. Details of the AIRDOS-C gamma spec-             solution common to both measuring cars.
trometer used can be found in Velychko et al. (2022). The            During the observation itself, a significant problem was
energy deposition range of this device is 200 keV to 40 MeV.      caused by the time needed to record the data measured by in-
The time resolution between two incident ionizing radiation       dividual detectors; this resulted from the time period needed
events is 100 µs for particles with deposited energy above        to store the recording from the operational memory of the de-
1 MeV. For lower energies, only a 15 s integration of events      vices. We were able to reduce the time, mainly by optimizing
is provided. The NaI(Tl) crystal with the SiPM and pream-         the camera settings and using different firmware. Neverthe-
plifier is shielded in a metallic box.                            less, the total dead time was still about 90 s for storms occur-
                                                                  ring during the day. In the case of night storms, the dead time
2.4    Electric field mill                                        decreased to approximately 60 s due to the image compres-
                                                                  sion used. As a consequence, all lightning events were not
The electric field is measured using the Kleinwächter
                                                                  recorded for any storm event.
EFM 115 electric field mill (EFM) from which the analog
signal output leads directly to the data logger that contains
a GPS receiver for timestamping the record (MLAB, 2021).          4     Results
The logging time resolution is 110 ms.
                                                                  4.1    Ionizing radiation measurements
2.5    Meteorological instruments
                                                                  Figure 7 shows an example of ionizing radiation measure-
In order to determine the meteorological situation in the         ments using the AIRDOS-C gamma spectrometer. In Fig. 7a,
vicinity of the cars during the measurement, the cars were        a storm approaching a parked measuring car is displayed us-
equipped with several meteorological sensors: a distrome-         ing data from the Blitzortung.org network. The vertical red
ter (UST, 2020), an anemometer (MLAB, 2020), and a ther-          lines mark the times when lightning was registered by the
mometer with a barometer (MLAB, 2015).                            STP antenna. Figure 7b shows the number of particles reg-
                                                                  istered by the ionizing radiation detector every 15 s. In this
                                                                  particular example, the lightning activity ceased just after
3     Observational methods                                       20:30 UTC. The graph shows an approximate 30 % increase
                                                                  in the ionizing radiation flux. This increase is related to a
Observations were carried out using a gradually improved          radon progenies washout from the atmosphere caused by rain
strategy with the aim of getting the measuring cars (espe-        that started at 19:45 UTC.
cially the car equipped with radiation detectors) as close to        Figure 8 shows a short time period of ionizing radiation
the storm center as possible. The position of the storm cen-      measurement at the time when the storm was closest to the
ter was monitored using data from the Windy (Windy, 2021)         car. Individual particles of ionizing radiation registered ver-
and Blitzortung.org (Wanke, 2011) third-party networks.           sus detected lightning are shown. Only particles that have
   The measuring cars were stationary during thunderstorm         passed on energies higher than 2.4 MeV to the detector are
measurements. Moreover, in the case of the radiation detec-       displayed.
tors, an extended static position time interval was used before
and after storm activity in order to record the entire develop-

Atmos. Meas. Tech., 16, 547–561, 2023                                               https://doi.org/10.5194/amt-16-547-2023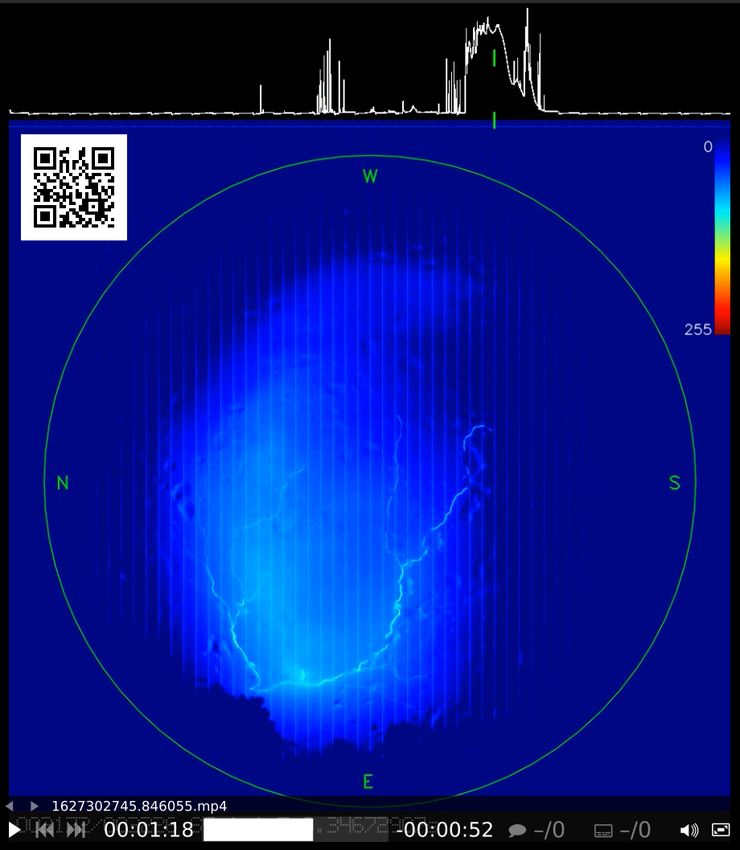
J. Kákona et al.: In situ ground-based mobile measurement of lightning events above central Europe                                   551

Figure 5. CRREAT (Research Center of Cosmic Rays and Radiation Events in the Atmosphere) CAR0 instrumentation schematic diagram.

Figure 6. CRREAT (Research Center of Cosmic Rays and Radiation Events in the Atmosphere) CAR1 instrumentation schematic diagram.

                                                                      Figure 8. Lightning detected by Blitzortung.org and triggers from
Figure 7. Measurements of ionizing radiation using a car compared     the STP antenna plotted together with individually registered parti-
with lightning registered by antennas. The beginning of the mea-      cles of ionizing radiation above channel 30 of the gamma spectrom-
surements using the AIRDOS-C and STP antennas corresponded to         eter.
switching on the devices after parking the car at a measurement lo-
cation at 19:15 UTC. The end of the measurements at 21:25 UTC
corresponded to switching off the devices and leaving the measure-    discharges often happen inside clouds and lightning chan-
ment location.                                                        nels are not directly visible, we converted the videos of the
                                                                      recorded lightning to luminosity in time. The integral values
                                                                      of the illuminations were calculated using a script from the
4.2   Camera measurements                                             video recordings of the high-speed cameras. The calculations
                                                                      were carried out over the entire image area by summing up
During the measurement, the camera is pointed toward the
                                                                      the values of all pixels on each image. We call these luminos-
zenith and its lens allows it to capture the entire sky from
                                                                      ity curves. The results can be seen on the graphs in Fig. 11
horizon to horizon. For the illustration of the camera view,
                                                                      that depict the course of light flux over time.
a plain camera frame is shown in Fig. 9. Because lightning

https://doi.org/10.5194/amt-16-547-2023                                                     Atmos. Meas. Tech., 16, 547–561, 2023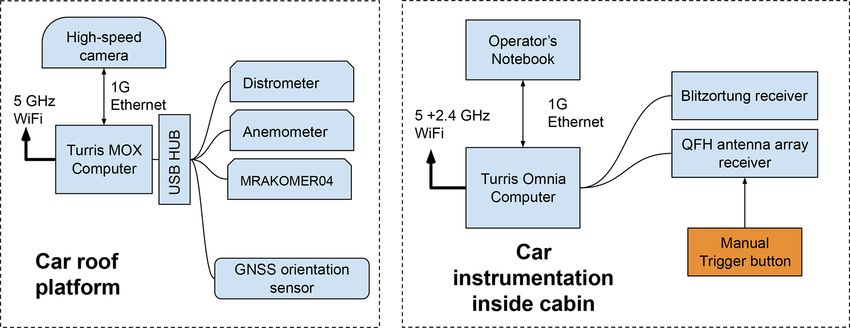
552                 J. Kákona et al.: In situ ground-based mobile measurement of lightning events above central Europe

Figure 9. A still-image example from the all-sky camera showing
the horizon and the fish-eye lens distortion.

                                                                   Figure 10. The reader is advised to use the inset QR code or
                                                                   the following link to run the video: https://doi.org/10.5446/60389
   To maintain clarity, luminosity curves were added to            (Kakona, 2022a).
videos, which were converted from black-and-white (BW)
recordings captured by cameras to false colors in order to
make the details of the lightning (that have high luminosity       ible lightning channel (not covered by clouds). This process
dynamics) visible.                                                 helps us to see what lightning really looks like.
   Figure 10 captures one frame from a video (https://doi.org/
10.5446/60389, Kakona, 2022a) that clearly shows a flash of        4.3   Antenna measurements
lightning as well as the leaders and recoil leaders. During the
thunderstorm recording, the camera gain was decreased in           One of the advantages of measuring lightning using magnetic
order to capture lightning that has high brightness dynamics.      loop antennas is that the observation is not disturbed by op-
As a result, lightning is not visible in the video at the same     tically nontransparent clouds or, as is the case for storms oc-
time as details of clouds and surrounding terrain. The pro-        curring during the day, sunlight scattered in the atmosphere.
cessed video has the position of the horizon marked with a         On the other hand, when we use a coil to measure the mag-
green circle with an inscribed designation of the cardinal di-     netic component of the electric field, we only see its changes
rections. In the upper part of the video, there is a white graph   in time or specifically a change in the current that flows
showing the luminosity curve with a green pointer marking          through the lightning channel. If a constant current flows
the position of the current frame over time. On the right,         through the lightning channel, it is not possible to detect it
a color palette is visible that corresponds to the brightness      using a magnetic loop antenna. Figure 12 shows an example
recorded by each camera pixel with a depth of 8 bits. The          of lightning recorded by an STP antenna and a camera at the
bottom line shows the number of the current frame over the         same time. In the camera recording, a change in light condi-
total number of frames recorded, Sg = 1/1 (information on          tions is clearly visible. The sky was brighter before the light-
which part of the camera’s internal memory was used for            ning than after it occurred. Slow changes in brightness, and
recording), and the time of the current frame “T =” in sec-        thus slow changes in current, are not visible on the antenna
onds relative to the trigger.                                      recording. On the other hand, we see clusters of fast pulses
   The resulting luminosity curves contain similar parts           that can give information about the development of light-
(sharp peaks or slow changes in luminosity). Thus, we can          ning channels, which are not visible on the camera record-
compare the video recordings of luminosity curves with a           ings because they are probably obscured by light emanated
similar progression, and we can choose those parts from sev-       by a constant current in the main channel. Pulses that are visi-
eral recordings that have similar luminosity curves and a vis-     ble on both camera and antenna recordings are recoil leaders.

Atmos. Meas. Tech., 16, 547–561, 2023                                                 https://doi.org/10.5194/amt-16-547-2023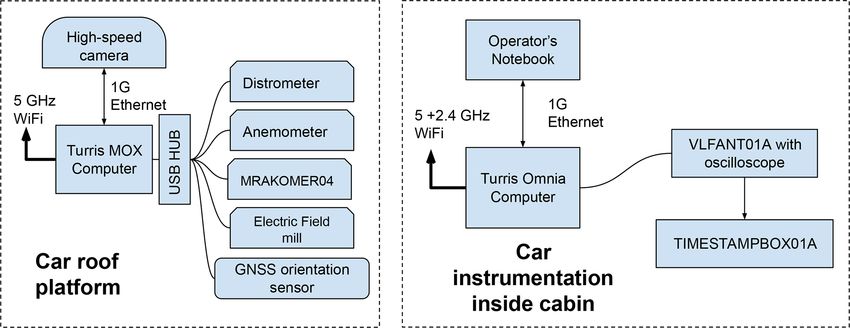
J. Kákona et al.: In situ ground-based mobile measurement of lightning events above central Europe                                553

Figure 11. An example of luminosity curves for a few lightning events.

Figure 12. An example of data from the STP antenna and a comparison with camera data.

The most prominent pulse is the CG (cloud-to-ground) return              detected by the STP antenna was recorded, as it takes sev-
stroke.                                                                  eral minutes to store lightning data from the oscilloscope to
                                                                         the data storage device. Second, not every lightning event
4.4   Correlation of measured lightning with a lightning                 detected by the STP antenna was detected by the Blitzor-
      detection network                                                  tung.org network. Figure 13 shows that the STP antenna de-
                                                                         tected lightning at a different time or at a distance of more
We have tried to compare the detection of lightning using the            than 120 km away when the storm was closest to the car ac-
STP antenna with its detection using the Blitzortung.org net-            cording to the Blitzortung.org network. On the contrary, as
work. First, we have to note that not every lightning event

https://doi.org/10.5194/amt-16-547-2023                                                     Atmos. Meas. Tech., 16, 547–561, 2023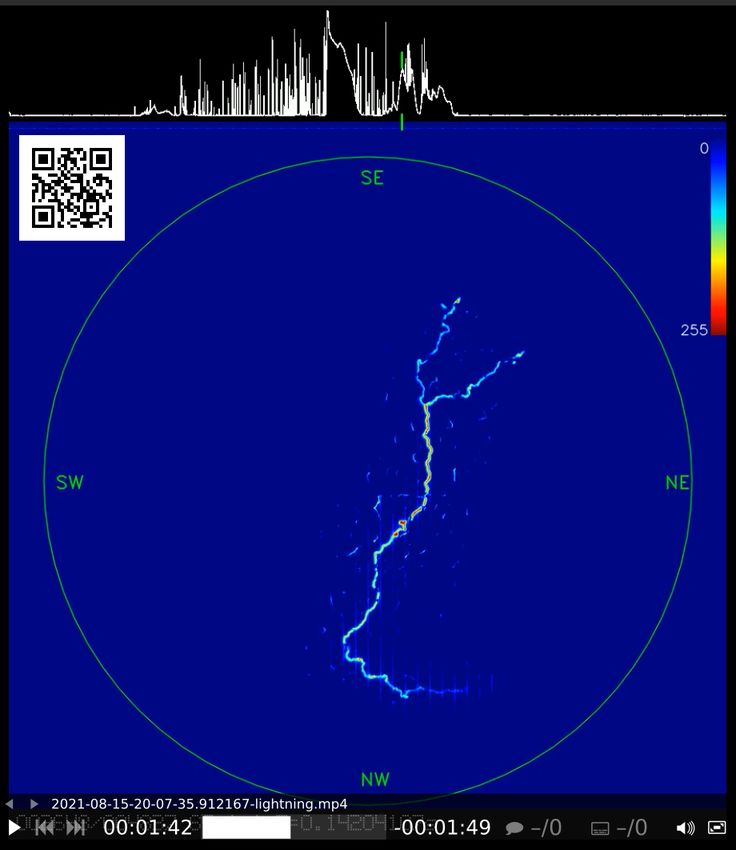
554                  J. Kákona et al.: In situ ground-based mobile measurement of lightning events above central Europe

Figure 13. Correlation with “close” (less than 20 km) lightning detection.

Figure 14. Correlation with “distant” (more than 40 km) lightning detection.

shown in Fig. 14, when the storm was located tens of kilo-               discharges recorded by the camera (Fig. 16), we can see that
meters from the observation site according to the Blitzor-               the changes in the electric field do not correspond directly
tung.org network, we see perfect conformity with the data                to individual discharges. Please note that EFM measures the
from the STP antenna. In both figures, an interval of ±1 s is            vertical component of the electric field, which gives the inte-
marked around the vertical lines corresponding to the detec-             grated value over a large area of clouds, and the field is also
tion times.                                                              deformed by the presence of a car.
   Lightning at 18:24:48 UTC was detected by a high-speed
camera (see video, https://doi.org/10.5446/60389, Kakona,
2022a). According to the video, one of the lightning chan-               5     Discussion
nels occurred almost directly above the measurement car, but
                                                                         5.1    Lightning duration
the nearest lightning event detected by Blitzortung.org was
at least 70 km away. The positioning accuracy of the Blit-               We attempted to determine the duration of lightning events
zortung.org network is in the order of kilometers. Blitzort-             by searching for local maxima in the illumination of the cam-
ing.org detected discharges at a distance of 70–80 km simul-             era chip in time from peaks that have a prominence higher
taneously. Thus, we can deduce that this lightning event was             than 2 times that of noise. Then the first and last maxima
more than 80 km long or that a synchronous discharge oc-                 were used for the determination of the first and last snap, and
curred 80 km away.                                                       the lightning duration was calculated from the frame rate.
                                                                         First, 10 snaps of the camera record were omitted due to pos-
4.5   Electric field measurements
                                                                         sible artifacts stemming from the video data compression.
                                                                         The amplitude of noise was established from the first 100
Figures 15 and 16 show a comparison of the vertical elec-
                                                                         frames (from frame 10 to frame 110). Examples of how we
tric field measurements at the car measurement site with
                                                                         determined the duration of some lightning events are shown
those from the camera recordings. The EFM on the car is not
                                                                         in Figs. 17 and 18. The histogram of the duration of light-
grounded; thus, it measures the gradient of the electric poten-
                                                                         ning events is shown in Fig. 19. This histogram comprises
tial between the sensor and the car body. As can be seen in
                                                                         107 lightning events measured during 12 thunderstorms.
Fig. 15, the electric discharges occur at times of large elec-
tric field changes. However, if we look at the details of some

Atmos. Meas. Tech., 16, 547–561, 2023                                                       https://doi.org/10.5194/amt-16-547-2023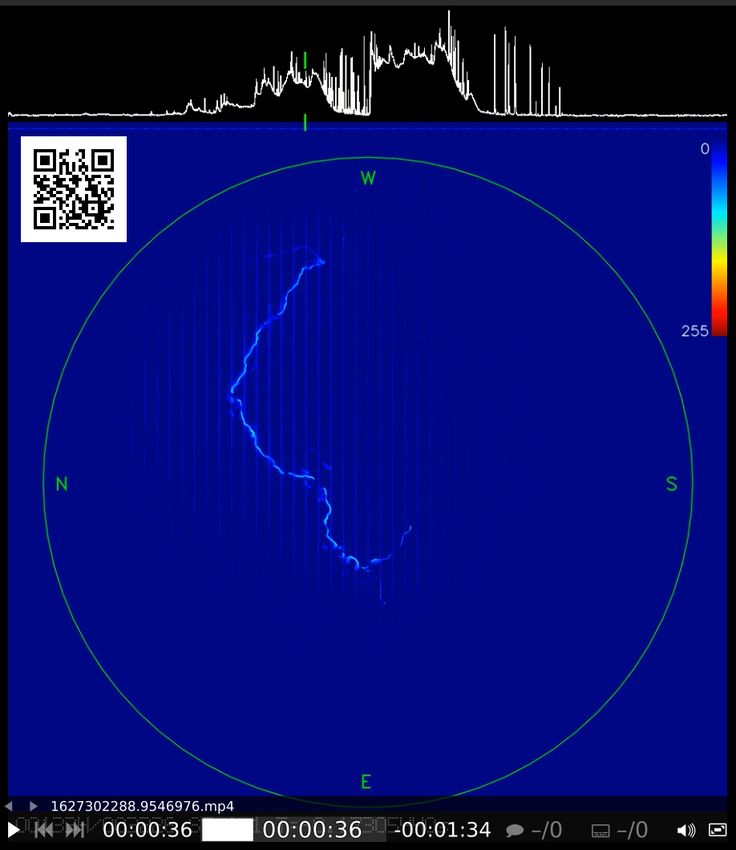
J. Kákona et al.: In situ ground-based mobile measurement of lightning events above central Europe                            555

Figure 15. An example of measurements with the EFM compared with records of lightning captured on the camera.

Figure 16. Details of the EFM data compared with camera data.

   To calculate the total length of a lightning event from the         The measured durations are usually in the order of hun-
radio signal shown in Fig. 18, we used a methodology that           dreds of milliseconds, with shorter lightning events being
treats signals greater than 4σ variance, calculated from the        rare. The median duration of lightning events is 524 ms. This
moving window of 10 ms, as the start of the lightning dis-          result is significantly longer than values reported previous
charge. This algorithm is applied symmetrically from both           studies: 200–300 ms (Rakov and Uman, 2003) and 350 ms
ends of the recorded signal. Therefore, the recording of the        (López et al., 2017).
length of the lightning begins at the first sample of the de-          The processing of lightning recordings differs for day and
tected signal and ends at the last sample of the recorded sig-      night storm observations, as they require different high-speed
nal.                                                                camera settings. In particular, the shutter speed (exposition

https://doi.org/10.5194/amt-16-547-2023                                                 Atmos. Meas. Tech., 16, 547–561, 2023
556                  J. Kákona et al.: In situ ground-based mobile measurement of lightning events above central Europe

Figure 17. Examples of the detection of lightning event duration. Red crosses are detected peaks in signals generated by lightning processes.
The determined length of the lightning duration is highlighted. The duration of the camera frame is 620 µs.

Figure 18. An example of lightning duration measurements based on radio signals captured by the UHF receiver. The length of the lightning
duration is marked by the green overlay.

time) and the analog gain settings vary. This difference could           tected discharges). We considered lightning to be an “event”
affect the exact measurements of the total length of a dis-              when the time between the individual discharges did not ex-
charge, resulting in a shortening of the estimated duration.             ceed 100 ms.
As sunlight is scattered in the atmosphere during the day-
time, weak discharges might have been omitted. Therefore,                5.2   Lightning development/characterization
the extracted durations of lightning events could be underes-
timated.                                                                 Data from the cameras reveal similar phases of lightning de-
   From the following analysis of the lightning duration, we             velopment. We provide examples of video recordings with
excluded two thunderstorms during which it was not possible              the individual phases clearly visible and unobscured by
to distinguish between individual lightning events (events for           clouds.
which there was less than 500 ms between the individual de-                 Figure 20 captures one frame from a video (https://doi.
                                                                         org/10.5446/60390, Kakona, 2022b) that shows (from T =

Atmos. Meas. Tech., 16, 547–561, 2023                                                        https://doi.org/10.5194/amt-16-547-2023
J. Kákona et al.: In situ ground-based mobile measurement of lightning events above central Europe 557
Figure 19. A histogram of the observed duration of lightning events. The histogram is based on data captured by the high-speed cameras.
+0.27 s to T = +0.40 s; https://av.tib.eu/media/60390#t=1:
11,1:22, last access: 1 January 2023) the positive side of
a leader. When the current flowing through the leader be-
gins to weaken, recoil leaders start to appear at its end (T =
+0.38 s; https://av.tib.eu/media/60390#t=1:21,1:30, last ac-
cess: 1 January 2023). The term “recoil leader” was taken
from the literature (Mazur et al., 2013). Based on our obser-
vations, however, we cannot confirm that all the visible recoil
leaders reuse a pre-established ionized channel.
Figure 21 captures one frame from a video (https://doi.
org/10.5446/60388, Kakona, 2022c) that shows an invisible
positive leader, but only blurred recoil leaders are visible.
From T = +0.07 s (https://av.tib.eu/media/60388#t=1:36,1:
44, last access: 1 January 2023), a negative side of a leader
is visible. The negative leader branches abundantly, and its
propagation is faster than the positive leader and contains
hot luminous ends. The second visible negative leader starts
at T = +0.25 s (https://av.tib.eu/media/60388#t=1:51,1:59,
last access: 1 January 2023). The negative leaders do not gen-
erate recoil leaders.
Based on the recordings, in which some parts of the light-
ning are clearly visible, we can characterize other lightning
events. In Fig. 12, an example of the luminosity curve and
antenna data is shown. At the very beginning, the lightning
usually starts with a faint peak with a fast-rising edge (at the Figure 20. The reader is advised to use the inset QR code or
time 0.2 s). Then there is an optically dark phase with low the following link to run the video: https://doi.org/10.5446/60390
luminosity. However, this quiet period is not really quiet in (Kakona, 2022b).
the radio signal; it is a phase in which a leader develops. As
the leader in the cloud connects to more and more charged
regions, it becomes brighter (sometimes slowly, sometimes
abruptly). During and after a decrease in the current in the recoil leaders have high luminosity when they connect to the
positive leader, the recoil leaders appear (after 0.4 s). Some main channel. In the radio spectrum, we simultaneously ob-
serve peaks that correspond to short intense brightenings. In
https://doi.org/10.5194/amt-16-547-2023 Atmos. Meas. Tech., 16, 547–561, 2023558 J. Kákona et al.: In situ ground-based mobile measurement of lightning events above central Europe
also wish to concentrate on measuring the electric field in the
horizontal plane at the altitude of the thundercloud base. We
believe that these measurements could contribute to a bet-
ter understanding of where and when the ionizing radiation
originates during thunderstorms.
Figure 21. The reader is advised to use the inset QR code or
the following link to run the video: https://doi.org/10.5446/60388
(Kakona, 2022c).
some cases the lightning results in CG discharge, which is ac-
companied by a high-intensity flash (at 0.5 s). However, this
phenomenon does not occur very often. Using the described
equipment, we registered CG return strokes in less than 10 %
of cases.
6 Conclusions
During the 2021 summer storm season, we collected data on
more than 100 lightning events using cars equipped with all-
sky high-speed cameras, radio receivers, and electric field
detectors. We conclude, based on these measurements, that
the data from all-sky high-speed cameras and magnetic or
electromagnetic antennas give comparable results in terms
of lightning duration. The median duration of the measured
lightning was 0.52 s, which is longer than values reported in
the literature. We have shown that the data obtained by EFM
(measurement of the vertical electric field) do not provide
any new information about the development of lightning. We
were also not able to prove a direct connection between the
increase in ionizing radiation and lightning in the lowlands of
central Europe. During further experiments, we want to focus
on the triangulation of discharges, using antennas and cam-
eras simultaneously, so that the actual dimensions of light-
ning and the distance from lightning can be determined. We
Atmos. Meas. Tech., 16, 547–561, 2023 https://doi.org/10.5194/amt-16-547-2023J. Kákona et al.: In situ ground-based mobile measurement of lightning events above central Europe 559 Appendix A Figure A1. Block diagram of the UHF radio receiver used in the experiment. The internals of the active antenna mounted on the car roof are depicted using the blue bubbles on the left. https://doi.org/10.5194/amt-16-547-2023 Atmos. Meas. Tech., 16, 547–561, 2023
560                  J. Kákona et al.: In situ ground-based mobile measurement of lightning events above central Europe

Data availability. All raw data can be provided by the correspond-       Kasami, S., Kawai, H., Kawakami, S., Kawata, K., Kido, E.,
ing author upon request.                                                 Kim, H. B., Kim, J. H., Kim, J. H., Kuzmin†, V., Kuznetsov, M.,
                                                                         Kwon, Y. J., Lee, K. H., Lubsandorzhiev, B., Lundquist, J. P.,
                                                                         Machida, K., Matsumiya, H., Matthews, J. N., Matuyama, T.,
Video supplement. The videos are available at TIB: https://doi.          Mayta, R., Minamino, M., Mukai, K., Myers, I., Nagataki, S.,
org/10.5446/60389 (Kakona, 2022a), https://doi.org/10.5446/60390         Nakai, K., Nakamura, R., Nakamura, T., Nakamura, Y., Nonaka,
(Kakona, 2022b), and https://doi.org/10.5446/60388 (Kakona,              T., Oda, H., Ogio, S., Ohnishi, M., Ohoka, H., Oku, Y., Okuda,
2022c).                                                                  T., Omura, Y., Ono, M., Oshima, A., Ozawa, S., Park, I. H., Potts,
                                                                         M., Pshirkov, M. S., Rodriguez, D. C., Rubtsov, G., Ryu, D.,
                                                                         Sagawa, H., Sahara, R., Saito, K., Saito, Y., Sakaki, N., Sako,
Author contributions. JK and MK planned the campaign and per-            T., Sakurai, N., Sano, K., Seki, T., Sekino, K., Shibata, F., Shi-
formed the measurements. MK, JK, and OV analyzed the data. MK            bata, T., Shimodaira, H., Shin, B. K., Shin, H. S., Smith, J. D.,
and JK wrote the manuscript draft, and IA, OP, LS, and JM reviewed       Sokolsky, P., Sone, N., Stokes, B. T., Stroman, T. A., Takagi, Y.,
and edited the manuscript.                                               Takahashi, Y., Takeda, M., Takeishi, R., Taketa, A., Takita, M.,
                                                                         Tameda, Y., Tanaka, K., Tanaka, M., Tanoue, Y., Thomas, S. B.,
                                                                         Thomson, G. B., Tinyakov, P., Tkachev, I., Tokuno, H., Tomida,
                                                                         T., Troitsky, S., Tsunesada, Y., Uchihori, Y., Udo, S., Uehama,
Competing interests. The contact author has declared that none of
                                                                         T., Urban, F., Wallace, M., Wong, T., Yamamoto, M., Yamaoka,
the authors has any competing interests.
                                                                         H., Yamazaki, K., Yashiro, K., Yosei, M., Yoshii, H., Zhezher,
                                                                         Y., and Zundel, Z.: Observations of the Origin of Downward
                                                                         Terrestrial Gamma-Ray Flashes, J. Geophys. Res.-Atmos., 125,
Disclaimer. Publisher’s note: Copernicus Publications remains            e2019JD031940, https://doi.org/10.1029/2019JD031940, 2020.
neutral with regard to jurisdictional claims in published maps and    Chilingarian, A.: Thunderstorm Ground Enhancements (TGEs)
institutional affiliations.                                              – New High-Energy Phenomenon Originated in the Ter-
                                                                         restrial Atmosphere, J. Phys. Conf. Ser., 409, 012019,
                                                                         https://doi.org/10.1088/1742-6596/409/1/012019, 2013.
Acknowledgements. This work was supported by EU Operational           Chilingarian, A., Hovsepyan, G., and Hovhannisyan, A.:
Program Research, Development, and Education within the frame-           Particle bursts from thunderclouds: Natural particle ac-
work of the CRREAT (Research Center of Cosmic Rays and Radi-             celerators above our heads, Phys. Rev. D, 83, 062001,
ation Events in the Atmosphere) project.                                 https://doi.org/10.1103/PhysRevD.83.062001, 2011.
                                                                      Chum, J., Langer, R., Baše, J., Kollárik, M., Strhárský, I., Diendor-
                                                                         fer, G., and Rusz, J.: Significant enhancements of secondary cos-
Financial support. This research has been supported by                   mic rays and electric field at the high mountain peak of Lomnický
the Ministry of Education, Youth and Science (grant                      Štít in High Tatras during thunderstorms, Earth Planets Space,
no. CZ.02.1.01/0.0/0.0/15_003/0000481).                                  72, 28, https://doi.org/10.1186/s40623-020-01155-9, 2020.
                                                                      Dwyer, J. R.: A fundamental limit on electric fields in air, Geophys.
                                                                         Res. Lett., 30, 2055, https://doi.org/10.1029/2003GL017781,
Review statement. This paper was edited by Thomas Wagner and             2003.
reviewed by two anonymous referees.                                   Dwyer, J. R., Schaal, M. M., Cramer, E., Arabshahi, S., Liu, N.,
                                                                         Rassoul, H. K., Hill, J. D., Jordan, D. M., and Uman, M. A.:
                                                                         Observation of a gamma-ray flash at ground level in association
References                                                               with a cloud-to-ground lightning return stroke, J. Geophys. Res.-
                                                                         Space, 117, A10303, https://doi.org/10.1029/2012JA017810,
Abbasi, R. U., Abu-Zayyad, T., Allen, M., Barcikowski, E.,               2012.
  Belz, J. W., Bergman, D. R., Blake, S. A., Byrne, M.,               Enoto, T., Wada, Y., Furuta, Y., Nakazawa, K., Yuasa, T.,
  Cady, R., Cheon, B. G., Chiba, J., Chikawa, M., Fujii, T.,             Okuda, K., Makishima, K., Sato, M., Sato, Y., Nakano,
  Fukushima, M., Furlich, G., Goto, T., Hanlon, W., Hayashi, Y.,         T., Umemoto, D., and Tsuchiya, H.: Photonuclear reac-
  Hayashida, N., Hibino, K., and Zundel, Z.: Gamma ray show-             tions triggered by lightning discharge, Nature, 551, 481–484,
  ers observed at ground level in coincidence with downward              https://doi.org/10.1038/nature24630, 2017.
  lightning leaders, J. Geophys. Res.-Atmos., 123, 6864–6879,         Fishman, G. J., Bhat, P. N., Mallozzi, R., Horack, J. M., Koshut, T.,
  https://doi.org/10.1029/2017JD027931, 2018.                            Kouveliotou, C., Pendleton, G. N., Meegan, C. A., Wilson, R. B.,
Belz, J. W., Krehbiel, P. R., Remington, J., Stanley, M. A., Ab-         Paciesas, W. S., Goodman, S. J., and Christian, H. J.: Discov-
  basi, R. U., LeVon, R., Rison, W., Rodeheffer, D., Abu-Zayyad,         ery of intense gamma-ray flashes of atmospheric origin, Science,
  T., Allen, M., Barcikowski, E., Bergman, D. R., Blake, S. A.,          264, 1313–1316, https://doi.org/10.1126/science.264.5163.1313,
  Byrne, M., Cady, R., Cheon, B. G., Chikawa, M., di Matteo,             1994.
  A., Fujii, T., Fujita, K., Fujiwara, R., Fukushima, M., Furlich,    Fujifilm: FE185 Series, Super wide-angle lenses, Fujifilm,
  G., Hanlon, W., Hayashi, M., Hayashi, Y., Hayashida, N., Hib-          https://www.fujifilm.com/us/en/business/optical-devices/
  ino, K., Honda, K., Ikeda, D., Inadomi, T., Inoue, N., Ishii, T.,      machine-vision-lens/fe185-series (last access: 13 April 2022),
  Ito, H., Ivanov, D., Iwakura, H., Jeong, H. M., Jeong, S., Jui,        2021.
  C. C. H., Kadota, K., Kakimoto, F., Kalashev, O., Kasahara, K.,

Atmos. Meas. Tech., 16, 547–561, 2023                                                     https://doi.org/10.5194/amt-16-547-2023
J. Kákona et al.: In situ ground-based mobile measurement of lightning events above central Europe 561 Gurevich, A. V., Milikh, G. M., and Roussel-Dupre, R.: Run- A., Maiorana, C., Albrechtsen, K., Budtz-Jørgensen, C., away electron mechanism of air breakdown and precondi- Kuvvetli, I., Christiansen, F., Chanrion, O., Heumesser, M., tioning during a thunderstorm, Phys. Lett. A, 165, 463–468, and Al-nussirat, S.: First 10 months of TGF observations https://doi.org/10.1016/0375-9601(92)90348-P, 1992. by ASIM, J. Geophys. Res.-Atmos., 124, 14024–14036, Kakona, M.: Lightning over the sky. In situ ground-based mobile https://doi.org/10.1029/2019JD031214, 2019. measurement of lightning events above central Europe, TIB AV- Parks, G. K., Mauk, B. H., Spiger, R., and Chin, J.: X- Portal [video], https://doi.org/10.5446/60389, 2022a. ray enhancements detected during thunderstorm and Kakona, M.: Positive leader side of lightning development and lightning activities, Geophys. Res. Lett., 8, 1176–1179, recoil leaders. In situ ground-based mobile measurement of https://doi.org/10.1029/GL008i011p01176, 1981. lightning events above central Europe, TIB AV-Portal [video], Rakov, V. A. and Kereszy, I.: Ground-based observations of https://doi.org/10.5446/60390, 2022b. lightning-related X-ray/gamma-ray emissions in Florida: Occur- Kakona, M.: Negative leader side of lightning development time- rence context and new insights, Electr. Pow. Syst. Res., 213, lapse. In situ ground-based mobile measurement of light- 108736, https://doi.org/10.1016/j.epsr.2022.108736, 2022. ning events above central Europe, TIB AV-Portal [video], Rakov, V. A. and Uman, M. A.: Lightning: https://doi.org/10.5446/60388, 2022c. Physics and Effects, Cambridge University Press, Kereszy, I., Rakov, V. A., Ding, Z., and Dwyer, J. R.: Ground- https://doi.org/10.1017/CBO9781107340886, 2003. Based Observation of a TGF Occurring Between Oppo- Rison, W., Thomas, R. J., Krehbiel, P. R., Hamlin, T., and Harlin, site Polarity Strokes of a Bipolar Cloud-To-Ground Light- J.: A GPS-based three-dimensional lightning mapping system: ning Flash, J. Geophys. Res.-Atmos., 127, e2021JD036130, Initial observations in central New Mexico, Geophys. Res. Lett., https://doi.org/10.1029/2021JD036130, 2022. 26, 3573–3576, https://doi.org/10.1029/1999GL010856, 1999. Kochkin, P., van Deursen, A. P. J., Marisaldi, M., Ursi, A., Shi, F., Liu, N., Dwyer, J. R., and Ihaddadene, K. M. A.: de Boer, A. I., Bardet, M., Allasia, C., Boissin, J. F., Flourens, VHF and UHF Electromagnetic Radiation Produced by F., and Østgaard, N.: In-Flight Observation of Gamma Ray Streamers in Lightning, Geophys. Res. Lett., 46, 443–451, Glows by ILDAS, J. Geophys. Res.-Atmos., 122, 12801–12811, https://doi.org/10.1029/2018GL080309, 2019. https://doi.org/10.1002/2017JD027405, 2017. Torii, T., Takeishi, M., and Hosono, T.: Observation of gamma- KronTechInc.: CHRONOS 1.4 DATASHEET, KronTech- ray dose increase associated with winter thunderstorm and light- Inc., https://www.krontech.ca/wp-content/uploads/2021/09/ ning activity, J. Geophys. Res.-Atmos., 107, ACL 2-1–ACL 2-13, FM-ENGR-50001-Chronos-1.4-Datasheet-Rev5.pdf (last https://doi.org/10.1029/2001JD000938, 2002. access: 13 April 2022), 2021. Tsuchiya, H., Enoto, T., Torii, T., Nakazawa, K., Yuasa, T., Torii, S., López, J. A., Pineda, N., Montanyà, J., Velde, O. v. d., Fukuyama, T., Yamaguchi, T., Kato, H., Okano, M., Takita, M., Fabró, F., and Romero, D.: Spatio-temporal dimen- and Makishima, K.: Observation of an energetic radiation burst sion of lightning flashes based on three-dimensional from mountain-top thunderclouds, Phys. Rev. Lett., 102, 255003, Lightning Mapping Array, Atmos. Res., 197, 255–264, https://doi.org/10.1103/PhysRevLett.102.255003, 2009. https://doi.org/10.1016/j.atmosres.2017.06.030, 2017. UST: Mobile piezoelectric distrometer DISTROMETER01A, Mazur, V., Ruhnke, L. H., Warner, T. A., and Orville, R. E.: Re- UST, https://github.com/UniversalScientificTechnologies/ coil leader formation and development, J. Electrost., 71, 763– DISTROMETER01 (last access: 13 April 2022), 2020. 768, https://doi.org/10.1016/j.elstat.2013.05.001, 2013. UST: UHF Radio Storm Monitoring Station, UST, https:// McCarthy, M. and Parks, G. K.: Further observations of X- github.com/UniversalScientificTechnologies/RSMS01 (last ac- rays inside thunderstorms, Geophys. Res. Lett., 12, 393–396, cess: 13 April 2022), 2021. https://doi.org/10.1029/GL012i006p00393, 1985. Velychko, O., Ambrožová, I., Kákona, M., and Ploc, O.: Character- Michimoto, K.: Meteorological Aspects of Winter Thun- isation Of Airdos-C Detector For Measurement Of High-Energy derstorms along the Hokuriku Coast of Japan, IEEJ Events In The Atmosphere, Radiat. Prot. Dosim., 198, 604–610, Transactions on Power and Energy, 127, 1242–1246, https://doi.org/10.1093/rpd/ncac105, 2022. https://doi.org/10.1541/ieejpes.127.1242, 2007. Wada, Y., Enoto, T., Nakazawa, K., Furuta, Y., Yuasa, T., Naka- MLAB: Barometric sensor with termometer WINDGAUGE03A, mura, Y., Morimoto, T., Matsumoto, T., Makishima, K., and MLAB, https://mlab.cz/module/ALTIMET01A (last access: Tsuchiya, H.: Downward Terrestrial Gamma-Ray Flash Ob- 13 April 2022), 2015. served in a Winter Thunderstorm, Phys. Rev. Lett., 123, 061103, MLAB: VLF antenna interconnection module, GitHub, https:// https://doi.org/10.1103/PhysRevLett.123.061103, 2019. github.com/mlab-modules/VLFANT01 (last access: 13 April Wanke, E.: Blitzortung.org – A low cost Time of Arrival 2022), 2017. Lightning Detection and Lightning Location Network, Uni- MLAB: Venturi tube based anemometer WINDGAUGE03A, versität Düsseldorf, https://www.blitzortung.org/Compendium/ MLAB, https://www.mlab.cz/module/WINDGAUGE03A (last Documentations/Documentation_2011-04-01_Green_PCB_6. access: 13 April 2022), 2020. 6_PCB_5.6.pdf (last access: 1 January 2023), 2011. MLAB: Electric Field mill interface module FIELDMILL01A, Windy: https://www.windy.com/ (last access: 13 April 2022), 2021. MLAB, https://www.mlab.cz/module/FIELDMILL01A (last ac- Wu, T., Wang, D., and Takagi, N.: Lightning mapping with an cess: 13 April 2022), 2021. array of fast antennas, Geophys. Res. Lett., 45, 3698–3705, Østgaard, N., Neubert, T., Reglero, V., Ullaland, K., Yang, https://doi.org/10.1002/2018GL077628, 2018. S., Genov, G., Marisaldi, M., Mezentsev, A., Kochkin, P., Lehtinen, N., Sarria, D., Qureshi, B. H., Solberg, https://doi.org/10.5194/amt-16-547-2023 Atmos. Meas. Tech., 16, 547–561, 2023
You can also read