In-Use Performance of Air-to-Water Heat Pumps: are the Standards robust? - E3S Web of ...
←
→
Page content transcription
If your browser does not render page correctly, please read the page content below
E3S Web of Conferences 246, 06002 (2021) https://doi.org/10.1051/e3sconf/202124606002
Cold Climate HVAC & Energy 2021

 In-Use Performance of Air-to-Water Heat Pumps: are the
 Standards robust?
 Adam O’Donovan*, Paul O’Sullivan
 Department of Process, Energy and Transport, Munster Technological University (Cork Campus), Rossa Avenue, Bishopstown, Cork

 Abstract. This paper presents an energy performance comparison of air to water heat pump manufacturer
 quoted values, calculated seasonal performance values from standards and actual in-use values for space
 heating mode only. Within this, the paper determines whether an in-use factor would be suitable to correct
 performance predictions where differences exist. The paper also presents an in-use Carnot efficiency. Over
 five weeks of high-resolution data during winter and shoulder season conditions were collected and analysed
 for three different systems. The average in-use Carnot efficiency was found to vary largely from system to
 system (0.19 to 0.42). All heat pumps were found to underperform on average with respect to their
 standardised energy performance certificate values. The difference between standardised values and in-use
 values was between 11% and 53% in relative terms. The gap in performance is thought to be due to oversized
 or under-utilised systems. Standardised methodologies appear unable to capture potential under-
 performance in these types of systems. An in-use factor appeared to be an inappropriate approach in
 reflecting this difference. Further investigations are required to incorporate these risks into standards.

 1 Introduction ratings for AWHPs and their in-use operational
 counterparts. The aim of this paper is to determine if
 According to the European Heat Pump Association standardised values used for AWHP energy
 (EHPA) statistics dashboard, there are over 14 million performance are robust regarding actual in-use
 heat pumps installed in total in Europe and over 1.8 performance, and if an in-use factor could be applied to
 million air-to-water heat pumps (AWHPs) installed for represent differences.
 heating purposes only [1]. In Ireland, there are over
 36,000 heat pumps installed and, according to 2017
 2 Materials and Methods
 figures, there were around 18,000 AWHPs installed in
 that year alone. More importantly, the growth rate in
 year on year sales of heat pumps more generally has 2.1 Buildings and heat pumps
 been over 11% for the three years leading up to 2017 [2],
 and was greater than that level in 2019, with Irish growth The three heat pumps investigated were installed in
 rates appearing to exceed that of European levels in the three A-rated dwellings. The floor area of these
 same year [1]. The main drawback of using a heat pump buildings is between 182m2 and 288m2, with each built
 is that the primary energy factor for each location can and occupied from 2015 onwards. Two buildings had
 affect the renewable status of the device itself. Nowak heating systems which served underfloor heating
 et al. reported that seasonal performance factors (SPFs) (AWHP-1 and AWHP-3) and one building (AWHP-2)
 needed to be around 2.875 at a minimum if heat pumps had radiators. In this regard, these buildings and their
 were to be counted as renewables [3]. The EHPA state respective heating systems represented typical modern
 2.53 as a requirement [1], while a value of 2.5 is a northern EU homes. One building (using AWHP-3) was
 requirement in some countries [4]. With this in mind, a deep retrofit. The rated outputs of these heat pumps are
 there is a clear goal for operating AWHPs to exceed 5.2kW (AWHP-1, low temperature applications, 35°C),
 these average SPFs in-use. Over the past ten years an 5.3kW (AWHP-2, medium temperature applications,
 extensive library of published AWHP in-use 55°C) and 8.5kW (AWHP-3, for temperature
 performance studies has emerged in the literature [5]– applications, 35°C) respectively.
 [10]. The average SPFs reported in these studies is
 around 2.7 with a large range of reported values of
 between 1.2 to 4.5 depending on the system boundary
 and location. Given the clear spread in reported in-
 efficiencies from field trials there is a need to reconcile
 energy performance between manufacturers quoted

 * Corresponding author: adam.odonovan@cit.ie

 © The Authors, published by EDP Sciences. This is an open access article distributed under the terms of the Creative Commons Attribution License 4.0
 (http://creativecommons.org/licenses/by/4.0/).
E3S Web of Conferences 246, 06002 (2021) https://doi.org/10.1051/e3sconf/202124606002
Cold Climate HVAC & Energy 2021

 2.2 Performance metrics and system heat pump operational modes as well as backup heating
 boundaries requirements, and reflects the annualised performance
 of a heat pump at reference climates.
 The theoretical performance of all AWHPs can be
 calculated in a very simple manner by using the Carnot
 Co-efficient Of Performance (COP) shown in Equation
 1.

 ( + 273.15)
 = [−] (1)
 ∆ −

 Where, is the source temperature (which is the
 external ambient air temperature for AWHPs) and ∆ −
 is the difference between source ( ) and sink ( )
 temperatures, known as the lift temperature, described
 in Equation 2.

 ∆ − = − [° ] (2)

 The sink temperatures we refer to here depends on
 the system adopted and the set points observed, these
 can be fixed or weather compensated. Typically,
 manufacturers report the COP at fixed flow
 temperatures or for a temperature application (e.g. low,
 medium, high temperature application), calculated at the Fig. 1. Scatterplots of external air temperature Vs
 test points indicated in EN 14511 [11]. Equation 3 manufacturers quoted COP and COPCarnot for similar
 describes the heating capacity, , in Watts, W, temperatures
 according EN 14511-3.

 = − [ ] The SCOP is often calculated with the assumption that
 (3)
 the heat pump is designed for the load it is tested at,
 which often neglects the use of backup heating.
 Where, q is the volumetric flow rate in m3/s, ρ is the However, most published field trials or studies report a
 density of water or air in kg/m3, Cp is the specific heat seasonal performance factor (SPF) to reflect annualised
 capacity of the heat transfer medium at constant pressure performance. The SPF can be quoted at different
 in J/kg K and − is the difference between inlet and boundaries. In this study, all SPFs that are calculated
 outlet temperatures (which is applicable for waterside or refer to the H4 boundary unless otherwise stated in the
 airside calculations), expressed in Kelvin, K, which text. Equation 5 describes the calculation of SPF at the
 depends on the system. Equation 4 describes the COP. H4 boundary.
 The COP is defined in EN14511-1 [12] as the ratio of
 heating capacity to effective power input. +
 ( 4 ) = [−] (5)
 + , + ℎ + ,

 = [−] (4)
 Where, QHP is the heat output of the heat pump,
 is the heat output of backup heaters, is the work of
 is the heating capacity expressed in Watts and is the heat pumps compressor, , is the work of the
 the effective power input, also expressed in Watts, W. source pump or fan, ℎ is the work of the back-up
 The Carnot COP is a useful benchmark in that it gives heater and , is the work of the distribution pump(s).
 an indication of the maximum COP that a system can Of the three heat pumps studied in this paper, two
 achieve for given boundary conditions. It also relates (AWHP-2, AWHP-3) had flow meters which allowed
 well to manufacturers test points. Figure 1 presents the for a water side calculation (see Equation 3). It was
 relationship between COP and external air temperature assumed that water was present on the condenser side of
 ( ) for the Carnot COP and a linear fit of the AWHP-2 as it was a split (Cp = 4200J/kg K). For
 manufacturers quoted COP with respect to external air AWHP-3 it was assumed that glycol was present in the
 temperature for the three AWHPs investigated in this primary loop and so the specific heat of the water was
 paper. The Carnot COP indicated in Figure 1 refers to adjusted accordingly (Cp = 3442J/kg K). AWHP-1 had
 two values, 35°C and 55°C respectively. Outside of no integrated flow meter and so a water side calculation
 presenting individual test points according to EN 14511, was not feasible. A sensible evaporator air side
 manufacturers will also quote a Seasonal COP (SCOP) calculation for heating capacity was used. This was
 according to EN 14825 [13] if the heat pump is used for based on an empirically derived relationship between
 space heating and may also quote a seasonal value for evaporator fan speed and air mass flow rate from in-situ
 hot water performance according the EN 16147 [14]. field measurements of fan airflow rates at the dwelling.
 The SCOP is a weighted COP, which includes different The sensible heat output only was considered as the

 2
E3S Web of Conferences 246, 06002 (2021) https://doi.org/10.1051/e3sconf/202124606002
Cold Climate HVAC & Energy 2021

 temperature difference between the outside air and
 evaporator surface temperature. Table 1 presents a Where, SPFH1 is the calculated SPF at the H1
 comparison of the approaches adopted in standards such boundary for heating only and SPFC refers to the Carnot
 as EN 14825 and compares them to the SPF boundaries SPF, which is the Carnot COP (from Equation 1)
 reported in this study. The information conveyed in calculated using in-use data. The Carnot efficiency
 Table 1 shows how different in-use measurement described by SEPEMO was found to vary between 0.3
 boundaries (SPF H1 etc.) can be compared to to 0.5 for small electric heat pumps, and 0.5 to 0.7 for
 standardised values. Based on Table 1, SPF H4 and the large very efficient electric heat pumps [15]. The
 EN 15316 standard are at the same boundary, which efficiency metric proposed in this paper is an adjustment
 makes them the most suitable metrics for comparative of the Carnot efficiency to reflect in-use performance at
 purposes. a different boundary. Equation 7 describes the proposed
 in-use Carnot efficiency, which is the Carnot efficiency
 calculated at the H4 boundary.
 2.3 Carnot efficiency and in-use factor
 4
 Based on a review of the literature presented in Section , 4 = (7)
 1 it is evident that there often exists a deviation between
 manufacturers quoted performance and in-use
 performance. A challenge for the standards is to try and Where, SPFH4 is the calculated SPF at the H4
 represent this in the form of an in-use factor. The work boundary for heating only and SPFC refers to the Carnot
 of SEPEMO proposes that this could be reflected in the SPF, which is the Carnot COP calculated using in-use
 form of a Carnot efficiency for the same conditions. data. By including additional energy from components
 Equation 6 describes the Carnot efficiency for space other than the compressor, this efficiency metric will
 heating only (ԑC,SPF). attempt to reflect system performance as a function of
 1 the theoretical maximum.
 , = (6)

 Table 1. Comparison of approaches in standards (Taken from [15]). (SPF H4 and EN 15316 are highlighted in blue)

 EuP Lot 10:2012
 EuP, Lot 1: 2012
 EN 15316-4-2

 Component
 EN 14511

 EN 14825

 EN 16147
 SPF H1

 SPF H2

 SPF H3

 SPF H4

 Compressor x x x x x x x x x x
 Brine fan/pump x x x x x
 Back-up heater x x x x x x x
 Buffer tank/pump x x x x
 SHW fans/pumps x x x
 Final or Primary F F F F F F F P P

 pump and the immersion backup heater separately. For
 AWHP-1 two CTs were used; one was for the outside
 2.4 Measurements
 unit (e.g. compressor and fans) and for the inside unit
 Four different sources of data were collected for each (e.g. pumps). For AWHP-2 and AWHP-3 the heat pump
 AWHP. The first source was data from the CT captured all energy associated with the compressor,
 manufacturers integrated data logging systems, which fans and pumps, as well as auxiliary systems. The third
 gathered data on; operational modes, set-points, fan source of data for this study was from internal Netatmo
 operational points, temperatures at various points in Indoor Air Quality (IAQ) monitors. Each site also had a
 each system as well as flowrates. The temperature Netatmo weather station installed outside the dwelling.
 sensors that were used were factory installed sensors and A full list of accuracy information on these devices can
 had varying accuracies, most of which had an accuracy be found at [17]. The fourth source of data for this study
 of ±0.5°C, both flowmeters were rated an accuracy of was data taken from the nearest national weather
 ±2% of measured values. The second source of data for stations and was accessed from Met Éireann’s website
 this study came from Efergy energy monitors, which [18]. Energy measurements were conducted for a
 were installed at the electrical board of each house. The continuous period between February 2020 to December
 reported uncertainty for Efergy devices is less than 2% 2020. However, system level data was extracted from
 for household applications [16]. Energy data was some systems in small one-week periods (e.g. AWHP-
 measured using a current transducer (CT) for the heat 2). At least five weeks of shoulder and winter season

 3
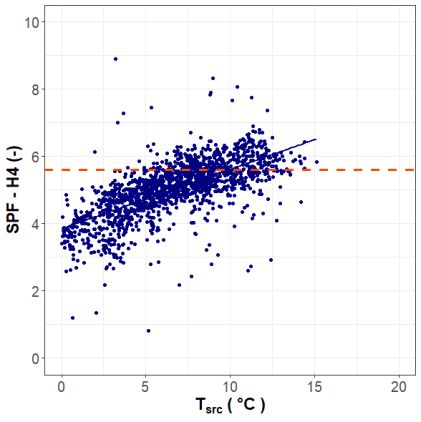
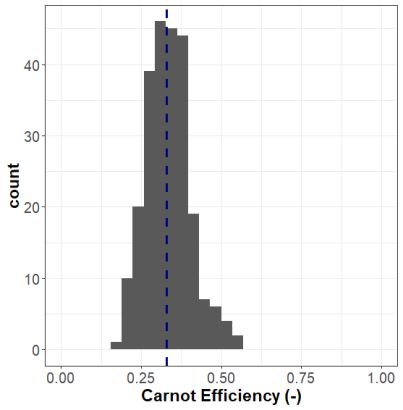
E3S Web of Conferences 246, 06002 (2021) https://doi.org/10.1051/e3sconf/202124606002
Cold Climate HVAC & Energy 2021

 data was collected for each system. SPFs were were between 0.8 and 11.9, and were on average 5.0.
 calculated using an hourly averaged dataset that was The flow temperatures that were observed in each
 statistically aggregated from an empirical dataset that system were between 24.5°C and 32°C for AWHP-1
 sampled at 1-minute intervals. (mean: 29°C), between 26°C and 44°C for AWHP-2
 (mean: 38°C) and between 21°C and 60°C for AWHP-
 3 (mean: 31°C). The lack of strong relationships
 between external air temperature and SPF for AWHP-1
 3 Results and Discussion and AWHP-2 indicates a potential that these systems are
 Figure 2 illustrates the performance of each heat pump oversized for their application. The building that uses
 with respect to external air temperature. Data for AWHP-1 incorporates two heat pumps into one home.
 AWHP-1 indicated that outside conditions ranged One exhaust air heat pump in a ducted system and the
 between 1.8°C and 17.5°C. During this period SPFs second heat pump is described in this paper. Both heat
 were between 0.2 and 3.7, and were on average 2.5. Data pumps are attempting to maintain comfortable
 for AWHP-2 indicated that outside conditions ranged conditions and it is likely that this is leading to low
 between 1.7°C and 11.5°C. During this period SPFs demand for heat. AWHP-2 has a fixed time schedule,
 were between 1.6 and 4.9, and were on average 3.0. Data which only allows operation of space heating for a few
 for AWHP-3 indicated that outside conditions ranged hours in the morning and the evening. This could
 between -2.8°C and 15.1°C. During this period SPFs explain its underperformance.

 Fig. 2. Scatterplots of hourly SPF with respect to which is the external temperature. (Values reported are for space heating mode
 only, from left to right: AWHP-1, AWHP-2 and AWHP-3. Dashed orange line indicates values used for EN15316)

 Fig. 3. Histograms of in-use Carnot efficiency for all AWHPs. (Dashed navy line indicates mean for each dataset, from left to right:
 AWHP-1, AWHP-2 and AWHP-3)
 AWHP-2, and 0.42 for AWHP-3. It is unlikely this in-
 Figure 3 shows histograms for the measured in-use use value could be used successfully in reflecting the
 Carnot efficiency. Based on this figure we can see that true performance of systems given the large deviations
 AWHP-1 and AWHP-2 have a distribution of in-use in values. The application of an in-use factor to reflect
 Carnot efficiencies that is at the lower end proposed by true performance would therefore seem difficult to
 SEPEMO. No strong correlations were observed apply, given its crude nature. Table 2 compares the
 between the in-use Carnot efficiency and either lift and standardised values used to represent each heat pump
 external air temperature variables. The average in-use with measured SPFs. Values for EN 15316 were taken
 Carnot efficiency was 0.19 for AWHP-1, 0.33 for as the efficiency values entered in the Irish Dwelling

 4
E3S Web of Conferences 246, 06002 (2021) https://doi.org/10.1051/e3sconf/202124606002
Cold Climate HVAC & Energy 2021

 Energy Assessment Procedure (DEAP) software which
 uses EN 15316 as its basis for calculation of system The differences that have been observed could be
 SPFs, and were entered by the relevant Building Energy explained by a number of factors including; 1)
 Rating (BER) Assessor for each dwelling. differences between standardised climate conditions and
 actual conditions, 2) incorrect sizing of heat pumps or 3)
 excess defrosting. Based on the available system level
 Table 2. Comparison of standardised values and measured
 SPF values for space heating only (*Value used for AWHP-2 data, defrost mode made up less than 1% of the data,
 is based on a similar property in the same housing which would suggest that defrosting is not the main
 development) cause for the differences observed. Differences between
 standardised climates and real climates is likely,
 EN EN however, a good spread in external temperature was
 HP SPFH4ave DiffEN14825 DiffEN15316 observed for the case studies which is typical for
 14825 15316
 conditions in Ireland. What would seem more likely in
 AWHP-1 5.1 5.3 2.5 -51% -53% this case is that AWHP-1 and AWHP-2 are either over-
 sized or under-utilised. System level data shown in
 AWHP-2 3.2 3.5* 3.0 -6% -14% Figure 4 for AWHP-1 indicates that the variable speed
 compressor used in this system operates below its lower
 AWHP-3 4.4 5.6 5.0 +16% -11% limit frequency (e.g. 30%) for 44% of the time. This is
 likely to lead to compressor cycling [8], where cycling
 can lead to 25% reduction in seasonal efficiency [19]
 Based on this, what is evident is that there are gaps which is in part due to the COP on start-up being 50%
 between the estimated system efficiencies used to lower for some heat pumps [20]. This cycling can
 represent the performance of AWHPs in compliance effectively remove the benefit of the variable speed
 tools and in-use efficiency. Differences of between 11% compressor. Comparing this to Figure 5, AWHP-3
 and 53% were observed in relative terms, between EN operates in its mid-range frequency more frequently,
 15316 and its representative boundary SPF H4. with frequencies less than or equal to 25% for only 1%
 of the time. It should be noted that missing data
 indicated in Figure 4 and 5 is due to compressor being
 off (0%) or due to dropouts in data logging systems
 during the monitoring period. AWHP-2 operates on a
 fixed time schedule for periods in the morning and
 evening which may represent the worst times of the day
 to external conditions. AWHP-3 performs well with
 respect standardised values. Based on this, it would
 seem that the standardised methodologies used in EN
 15316 are accurate for systems that are appropriately
 sized. The lack of consideration for oversized systems
 or systems that may be under-utilised for their buildings
 is a concern. The lack of consideration for this factor in
 standardised methodologies could lead to systems
 underperforming relative to expectations by 53%. As the
 Fig. 4. Hourly compressor frequency map for AWHP-1. causes for under-performance are potentially related to
 (High frequency (>=90%), low frequency =90%), low frequency
E3S Web of Conferences 246, 06002 (2021) https://doi.org/10.1051/e3sconf/202124606002
Cold Climate HVAC & Energy 2021

 standardised methodologies in considering sizing chilling packages and heat pumps, with electrically
 issues. driven compressors, for space heating and cooling -
 Testing and rating at part load conditions and
 The authors of this paper would like to thank the occupants of calculation of seasonal performance. 2018.
 each case study building for their participation. We would also [14] NSAI, “I.S. EN 16147: Heat pumps with electrically
 like to thank the relevant installers and expert technicians from driven compressors - Testing, performance rating
 each manufacturer who were very helpful. We would also like and requirements for marking of domestic hot water
 to acknowledge the contributions of the manufacturers in units,” 2017.
 assisting with the installation of relevant equipment and for all [15] R. Nordman et al., “SEasonal PErformance factor
 consultations. The DesignforIU project was funded under the and MOnitoring for heat pump systems in the
 Sustainable Energy Authority of Irelands (SEAI) RD&D fund building sector SEPEMO-Build: FINAL REPORT,”
 2018 under grant number RDD/00309) 2012, [Online]. Available:
 https://ec.europa.eu/energy/intelligent/projects/sites/i
 ee-projects/files/projects/documents/sepemo-
 References build_final_report_sepemo_build_en.pdf.
 [16] Efergy, “Accuracy - Efergy Engage,” 2020.
 [1] EHPA, “EHPA Stats,” 2020. https://efergysupport.zendesk.com/hc/en-
 http://www.stats.ehpa.org/hp_sales/story_sales/ gb/articles/360001664297-Accuracy (accessed Nov.
 (accessed Nov. 24, 2020). 23, 2020).
 [2] E. H. P. Association, “Heat Pumps: Integrating [17] Netatmo, “Smart Home Weather Station technical
 technologies to decarbonise heating and cooling,” specfications - Netatmo,” 2020.
 2018. https://www.netatmo.com/en-
 [3] T. Nowak, “Heat pumps – a renewable energy ca/weather/weatherstation/specifications (accessed
 technology?,” REHVA J., no. August, pp. 10–12, Nov. 23, 2020).
 2011, [Online]. Available: [18] Met Éireann, “Historial Data - Met Éireann,” 2020.
 http://www.rehva.eu/fileadmin/hvac-dictio/04- https://www.met.ie/climate/available-data/historical-
 2011/rj4_10-12.pdf. data (accessed Nov. 23, 2020).
 [4] P. Carroll, M. Chesser, and P. Lyons, “Air Source [19] F. Madonna and F. Bazzocchi, “Annual
 Heat Pumps field studies: A systematic literature performances of reversible air-to-water heat pumps
 review,” Renew. Sustain. Energy Rev., vol. 134, no. in small residential buildings,” Energy Build., vol.
 August, p. 110275, 2020, doi: 65, pp. 299–309, 2013, doi:
 10.1016/j.rser.2020.110275. 10.1016/j.enbuild.2013.06.016.
 [5] N. J. Kelly and J. Cockroft, “Analysis of retrofit air [20] G. Bagarella, R. Lazzarin, and M. Noro, “Sizing
 source heat pump performance: Results from strategy of on-off and modulating heat pump
 detailed simulations and comparison to field trial systems based on annual energy analysis,” Int. J.
 data,” Energy Build., vol. 43, no. 1, pp. 239–245, Refrig., vol. 65, pp. 183–193, 2016, doi:
 2011, doi: 10.1016/j.enbuild.2010.09.018. 10.1016/j.ijrefrig.2016.02.015.
 [6] EST, “Getting warmer: a field trial of heat pumps
 The Energy Saving Trust,” p. 23, 2010, [Online].
 Available: file:///C:/Users/Will/SkyDrive/4.
 Research, Reports and Documents/Technology and
 Design/Heating and Hot Water/EST - Getting
 Warmer - Field trial of heat pumps report.pdf.
 [7] Energy Saving Trust, “The heat is on: heat pump
 field trials phase 2,” p. 40, 2013, [Online].
 Available:
 http://www.energysavingtrust.org.uk/Organisations/
 Working-with-Energy-Saving-Trust/The-
 Foundation/Our-pioneering-research/The-heat-is-on-
 heat-pump-field-trials.
 [8] P. By, P. O. Reilly, M. O. Shea, S. Hoyne, and G.
 Hunter, “Superhomes 2.0,” no. March, 2019.
 [9] R. Lowe et al., “Analysis of Data From Heat Pumps
 Installed Via the Renewable Heat Premium Payment
 ( Rhpp ) Scheme,” no. 8151, pp. 2013–2015, 2017.
 [10] P. Tiljander, S. P. Technical, and P. O. Box, “Iea
 Hpp Annex 37 Demonstration of Field
 Measurements of Heat Pump Systems in Buildings -
 Good Examples With Modern Technology,” no.
 May, 2011.
 [11] NSAI, I.S. EN 14511-3: Air conditioners, liquid
 chilling packages and heat pumps for space heating
 and cooling and process chillers, with electrically
 driven compressors - Part 3: Test methods. 2018.
 [12] NSAI, I.S. EN 14511-1: Air conditioners, liquid
 chilling packages and heat pumps for space heating
 and cooling and process chillers, with electrically
 driven compressors - Part 1: Terms and definitions,
 vol. 44, no. 0. 2018.
 [13] NSAI, I.S. EN 14825: Air conditioners, liquid

 6
You can also read