Increasing the midsole bending stiffness of shoes alters gastrocnemius medialis muscle function during running
←
→
Page content transcription
If your browser does not render page correctly, please read the page content below
www.nature.com/scientificreports
OPEN Increasing the midsole bending
stiffness of shoes alters
gastrocnemius medialis muscle
function during running
Sasa Cigoja 1*, Jared R. Fletcher2, Michael Esposito3, Darren J. Stefanyshyn1,3 &
Benno M. Nigg1
In recent years, increasing the midsole bending stiffness (MBS) of running shoes by embedding
carbon fibre plates in the midsole resulted in many world records set during long-distance running
competitions. Although several theories were introduced to unravel the mechanisms behind these
performance benefits, no definitive explanation was provided so far. This study aimed to investigate
how the function of the gastrocnemius medialis (GM) muscle and Achilles tendon is altered when
running in shoes with increased MBS. Here, we provide the first direct evidence that the amount and
velocity of GM muscle fascicle shortening is reduced when running with increased MBS. Compared to
control, running in the stiffest condition at 90% of speed at lactate threshold resulted in less muscle
fascicle shortening (p = 0.006, d = 0.87), slower average shortening velocity (p = 0.002, d = 0.93) and
greater estimated Achilles tendon energy return (p ≤ 0.001, d = 0.96), without a significant change in
GM fascicle work (p = 0.335, d = 0.40) or GM energy cost (p = 0.569, d = 0.30). The findings of this study
suggest that running in stiff shoes allows the ankle plantarflexor muscle–tendon unit to continue to
operate on a more favourable position of the muscle’s force–length–velocity relationship by lowering
muscle shortening velocity and increasing tendon energy return.
In recent years, world records were set at long-distance running competitions over 5 km, 15 km, half-marathon,
marathon, and 100 km distances while running in the Nike Vaporfly 4% or Nike Vaporfly Next% shoes (note:
subsequently referred to as ‘Vaporfly’). Several studies investigated the effects of running in the Vaporfly shoes
on biomechanical and physiological variables1–5. Compared to other footwear, running in the Vaporfly shoes (1)
improved running economy by 4% on average1,4,5, (2) decreased the negative work and peak extension (i.e., dor-
siflexion) angle at the metatarsophalangeal (MTP) j oint2, (3) decreased the positive and negative work, and peak
plantarflexion moment and dorsiflexion angle at the ankle j oint2, and (4) increased stance t imes1,4. At the time
when the long-distance running world records were set, the Vaporfly shoes possessed features that significantly
differentiated them from other competitor’s running footwear. The main features included (1) a single curved
carbon fibre plate embedded in the midsole, (2) highly resilient midsole material, and (3) a greater stack height
(i.e., midsole thickness)6. The use of carbon fibre plates to increase the longitudinal midsole bending stiffness
(MBS) of shoes was first introduced by Stefanyshyn and N igg7. The MTP joint undergoes substantial extension
during the stance phase of running where negative work is p erformed8. This absorbed energy was hypothesised
to be disadvantageous for athletic performance9. One way to inhibit the extension of the MTP joint and therefore
reduce the negative work performed was to increase the MBS of s hoes7. Stefanyshyn and F usco10 investigated the
effects of MBS on sprinting performance and showed that 87% of all participants performed better when they
inserted carbon fibre plates in their own shoes. Furthermore, the level of MBS that resulted in best performance
differed between sprinters, suggesting that there is a subject-specific optimum in stiffness, which allows athletes
to perform at their best. Roy and S tefanyshyn11 were the first to investigate if increased MBS can be used to
improve long-distance running performance. Their findings showed that the mean rate of oxygen consumption
( V̇O2) can be lowered when running in a stiffer shoe; however, if MBS was increased too much, V̇O2 rose again,
supporting the idea of an optimal level of M BS10.
1
Human Performance Laboratory, Faculty of Kinesiology, University of Calgary, Calgary, AB, Canada. 2Department
of Health and Physical Education, Mount Royal University, Calgary, AB, Canada. 3Biomedical Engineering Graduate
Program, University of Calgary, Calgary, AB, Canada. *email: sasa.cigoja1@ucalgary.ca
Scientific Reports | (2021) 11:749 | https://doi.org/10.1038/s41598-020-80791-3 1
Vol.:(0123456789)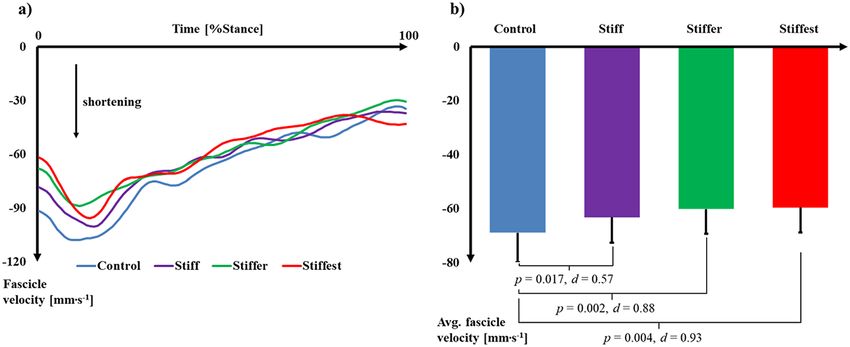
www.nature.com/scientificreports/
Although the underlaying mechanisms of improved performance when running in footwear with increased
MBS are not well understood, multiple effects were proposed: (1) minimising energy loss at the MTP joint7,
(2) storing and returning elastic energy to the a thlete12,13, (3) the ‘teeter-totter’ e ffect14,15, and (4) optimising
the force–velocity profile of the ankle plantarflexor m uscles16–18. In brief, the principle of minimising energy
loss suggests that athletic improvements can be achieved by reducing the energy absorbed at joints due to less
eccentric work performed by muscles crossing these joints. The principle of storing and returning elastic energy
suggests that elastic strain energy is stored in carbon fibre plates when being bent as the MTP joint undergoes
extension. Due to the plate’s hysteresis, a portion of this stored energy is then speculated to be returned to the
athlete during the subsequent flexion of the MTP joint. The ‘teeter-totter’ effect suggests that the ground reaction
force (GRF) produces a reaction force at the heel due to the curvature of the carbon fibre plate as the centre of
pressure travels anteriorly during the stance phase of running. This heel force was speculated to act at the right
location, the right time, and with the right f requency19, and therefore potentially improve running economy. The
principle of optimising the force–velocity profile of the ankle plantarflexor muscles suggests that the velocity of
muscle shortening is reduced due to a change in gear ratio between the external (i.e., distance between GRF and
ankle joint centre) and internal (i.e., distance between Achilles tendon (AT) and ankle joint centre) moment
arms20. Willwacher et al.16 demonstrated that, compared to a control shoe, running in stiff shoes increased the
average GRF moment arm to all lower limb joint centres. The observed effects were greatest at the ankle joint, the
major positive work generator in running8. Thus, with a relatively constant internal moment arm, these findings
suggest that running in shoes with increased MBS would result in a greater gear ratio. This was speculated to
potentially affect the force-generating capacity of the ankle plantarflexor m uscles16,17. Takahashi et al.17 showed
that the gear ratio was greater and the shortening velocity of the soleus muscle was reduced when walking in
shoes with increased MBS. Interestingly, the metabolic cost was increased when walking in the stiff compared
to a control condition. Ray and Takahashi21, however, demonstrated that increasing the stiffness of shoes when
walking at faster speeds reduced the metabolic cost. This suggested that stiffening elements in shoes had a speed-
dependent effect during walking. The fact that metabolic cost increased and altered ankle joint angles were
observed in the stiff condition during slow walking is contrary to previously reported findings in r unning1,2,11,
and would therefore suggest that different mechanisms occur between these two tasks. For this reason, Cigoja
et al.18 investigated the effects of MBS on force and velocity of the shank muscle–tendon unit (MTU) (i.e., estimate
of triceps surae muscle and AT) during running. Compared to control, it was reported that running in a stiff
shoe decreased peak shortening velocities of the shank MTU likely due to increased stance times. The authors
speculated that these reduced shortening velocities could have implications on the metabolic cost of running
and therefore affect long-distance running performance. Any changes in shank MTU shortening velocities due
to the use of carbon fibre plates could result in reduced energy cost of the ankle plantarflexor muscles, and thus
whole-body metabolic cost. However, due to the methodologies used in their study, Cigoja et al.18 could not
address whether the observed differences in shank MTU shortening velocities occurred due to changes at the
muscle (i.e., triceps surae) or tendon (i.e., AT).
Thus, the primary purpose of this study was to investigate if the total shortening and the average shortening
velocity of the gastrocnemius medialis (GM) muscle is reduced when running in shoes with increased midsole
bending stiffness (i.e., Stiff, Stiffer, Stiffest) compared to a control shoe (i.e., Control). It was hypothesised that
the total amount of shortening will not differ between footwear conditions because previous studies did not
report differences in ankle joint plantarflexion angles2,11,13,22. It was further hypothesised that running in footwear
with increased MBS will reduce average GM shortening velocities due to increased stance times. The secondary
purpose of this study was to investigate if increased midsole bending stiffness of shoes will affect modelled GM
energy cost and AT energy return. It was hypothesised that, compared to control, GM energy cost will decrease
with increased MBS due to reduced average GM shortening velocities. We further hypothesised that no differ-
ence in AT energy return would be observed between footwear conditions because previous studies suggested
that primarily the function of muscles would be affected by changes in MBS of s hoes16,17,23.
Results
Energy cost of running. There was no significant effect of MBS on the energy cost of running (Erun;
p = 0.298). Overall, two participants had the lowest E run in Control (i.e., Nike Free Run 2018), three in Stiff (i.e.,
Control + 1 mm carbon fibre plate), seven in Stiffer (i.e., Control + 1.5 mm carbon fibre plate), and two in Stiffest
(i.e., Control + 2 mm carbon fibre plate). There was no difference (p = 0.25, d = 0.13) in Erun between running in
the first (4.69 ± 0.29 J kg−1 m−1) and last (4.64 ± 0.25 J kg−1 m−1) condition.
Gastrocnemius medialis muscle and Achilles tendon dynamics. Significant effects of MBS were
observed on GM fascicle length at toe-off (p = 0.020), total change of GM fascicle length (p = 0.001), and average
fascicle velocity (p = 0.010) during stance. There was no effect of MBS on fascicle length at heel-strike (p = 0.223).
After correcting for multiple comparisons (p ≤ 0.017), GM fascicle length at toe-off in Stiff (p = 0.024, d = 0.21),
Stiffer (p = 0.021, d = 0.22), and Stiffest (p = 0.021, d = 0.35) was not different compared to Control (Table 1). Pair-
wise comparisons revealed significant differences in total change of fascicle length between Control and Stiffer
(p = 0.003, d = 0.85) and Stiffest (p = 0.006, d = 0.87) (Fig. 1). There were also significant differences in average
fascicle velocity between Control and Stiff (p = 0.017, d = 0.57), Stiffer (p = 0.002, d = 0.88), and Stiffest (p = 0.004,
d = 0.93) (Fig. 2).
There was no significant difference between MBS conditions for GM muscle energy cost (p = 0.469). With
regards to the estimated GM energy cost during stance, significant effects of MBS were found for estimated aver-
age force per crossbridge (p ≤ 0.001), the number of in-series sarcomeres (p = 0.013), and the number of cycles
per crossbridge (p = 0.026). Compared to Control, estimated GM force per crossbridge was significantly higher in
Scientific Reports | (2021) 11:749 | https://doi.org/10.1038/s41598-020-80791-3 2
Vol:.(1234567890)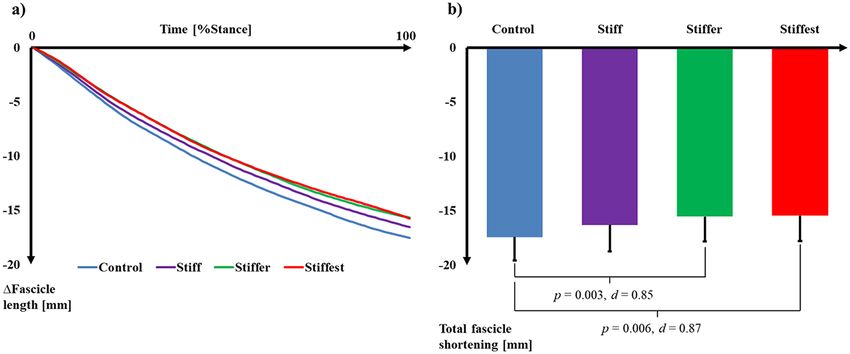
www.nature.com/scientificreports/
Variable Control Stiff Stiffer Stiffest
Erun (J kg−1 m−1) 4.85 ± 0.31 4.85 ± 0.37 4.75 ± 0.36 4.85 ± 0.29
GM fascicle length at heel-strike (mm) 52.0 ± 5.0 51.9 ± 5.7 51.2 ± 5.4 51.7 ± 5.4
GM fascicle length at toe-off (mm) 34.6 ± 4.9 35.6 ± 4.7 35.7 ± 4.9 36.2 ± 4.7
GM total length change (mm) − 17.4 ± 2.1 − 16.3 ± 2.4 − 15.5 ± 2.3* − 15.5 ± 2.3*
Average GM shortening velocity (mm s−1) − 69.0 ± 10.9 − 63.2 ± 9.4* − 60.1 ± 9.2* − 59.6 ± 9.2*
GM efficiency (%) 35.5 ± 4.0 35.2 ± 4.7 35.8 ± 4.5 35.2 ± 4.3
GM energy cost (J kg−1) 0.237 ± 0.043 0.226 ± 0.047 0.231 ± 0.057 0.222 ± 0.054
GM fascicle work (J kg−1) 0.084 ± 0.015 0.078 ± 0.013 0.082 ± 0.017 0.077 ± 0.017
Peak GM force (N kg−1) 11.63 ± 1.40 11.73 ± 1.29 11.94 ± 1.51 11.81 ± 1.48
GM force per crossbridge (pN) 2.55 ± 0.07 2.59 ± 0.05 2.60 ± 0.05* 2.61 ± 0.05*
In-series sarcomeres (count in 103) 30.521 ± 3.490 31.193 ± 3.812 31.019 ± 3.841 31.525 ± 3.406
Cycles per crossbridge (count) 46.01 ± 6.10 43.15 ± 5.17 41.60 ± 5.59* 41.22 ± 5.30*
AT energy return (J kg−1) 0.15 ± 0.03 0.17 ± 0.04* 0.18 ± 0.04* 0.19 ± 0.05*
AT force (N kg−1) 58.96 ± 6.69 59.76 ± 6.47 60.92 ± 7.68 60.38 ± 7.60
Table 1. Measured dynamics and modelled energetics (mean ± SD; n = 14) for the gastrocnemius medialis
(GM) muscle and Achilles tendon (AT). *Significant (p ≤ 0.017) differences compared to Control.
Figure 1. (a) Time-normalised, average (n = 14) change in gastrocnemius medialis muscle fascicle length over
the stance phase of running relative to the length at heel-strike. (b) Average (± SD; n = 14) total gastrocnemius
medialis fascicle shortening over the stance phase of running. p values and Cohen’s d effect sizes denote
significant (p ≤ 0.017) differences between conditions.
Figure 2. (a) Time-normalised, average (n = 14) gastrocnemius medialis muscle fascicle velocity over the stance
phase of running. (b) Average (± SD; n = 14) gastrocnemius medialis fascicle velocity over the stance phase of
running. p values and Cohen’s d effect sizes denote significant (p ≤ 0.017) differences between conditions.
Scientific Reports | (2021) 11:749 | https://doi.org/10.1038/s41598-020-80791-3 3
Vol.:(0123456789)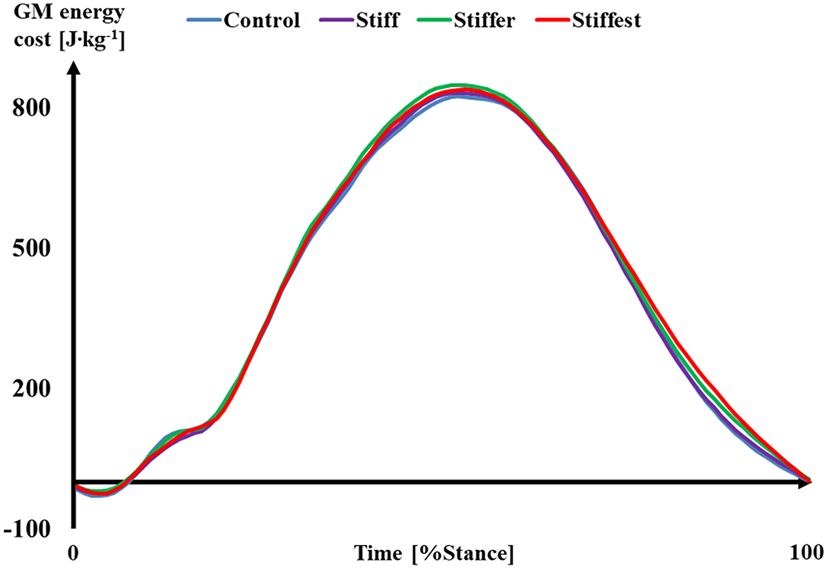
www.nature.com/scientificreports/
Figure 3. Average (n = 14) gastrocnemius medialis (GM) muscle energy cost over the stance phase of running.
Stiff (p = 0.010, d = 0.59), Stiffer (p = 0.002, d = 0.83), and Stiffest (p = 0.001, d = 0.96). After correcting for multiple
comparisons, the number of in-series sarcomeres did not differ between MBS conditions. The estimated number
of crossbridge cycles during stance was significantly lower in Stiffer (p = 0.005 d = 0.75) and Stiffest (p = 0.013,
d = 0.84). Achilles tendon energy return was also significantly different between MBS conditions (p ≤ 0.001),
where compared to Control more energy was returned in Stiff (p = 0.006, d = 0.64), Stiffer (p ≤ 0.001, d = 0.96),
and Stiffest (p ≤ 0.001, d = 1.17). No effects of MBS on peak GM force (p = 0.333), GM fascicle work (p = 0.139)
or average AT force (p = 0.143) were observed. Combining the results for GM energy cost and fascicle work, no
significant difference (p = 0.184) in GM efficiency was found (Table 1).
There was no significant MBS × %Stance interaction (p = 0.946); however, a significant main effect of both
MBS condition (p = 0.046) and %Stance (p ≤ 0.001) was found, suggesting that instantaneous GM muscle energy
cost differed significantly across the entire stance phase (Fig. 3). There was a significant difference in instantane-
ous GM energy cost between MBS conditions during 0–10%Stance (p = 0.003) and 80–90%Stance (p = 0.050).
Control vs. Best. When Control was compared to the stiff condition where Erun was lowest (i.e., Best),
Erun was significantly (p = 0.04, d = 0.50) improved by 1.97 ± 1.81% (range: -0.79% to 4.71%) in Best. Compared
to Control, running in Best resulted in reduced total GM fascicle shortening (Control: − 17.43 ± 2.14 mm,
Best: − 15.84 ± 2.18 mm, p = 0.007, d = 0.73), slower average fascicle velocity (Control: − 68.99 ± 10.94 mm s−1,
Best: − 61.11 ± 8.95 mm s−1, p = 0.005, d = 0.79), greater AT energy return (Control: 0.15 ± 0.03 J kg−1, Best:
0.18 ± 0.04 J kg−1, p ≤ 0.001, d = 0.96), and increased average AT force (Control: 58.96 ± 6.69 N kg−1, Best:
60.69 ± 6.44 N kg−1, p = 0.035, d = 0.26). Between Control and Best, there were no significant differences in GM
energy cost (Control: 0.24 ± 0.04 J kg−1, Best: 0.24 ± 0.06 J kg−1, p = 0.942, d = 0.02) or GM fascicle work (Control:
0.08 ± 0.02 J kg−1, Best: 0.08 ± 0.02 J kg−1, p = 0.928, d = 0.003).
Lower limb kinematics and kinetics. One-way repeated measures ANOVAs and Friedman’s tests
revealed significant effects of MBS on stance time (p ≤ 0.001); positive (p ≤ 0.001) and negative (p = 0.009) MTP,
positive (p = 0.009) and negative (p = 0.001) ankle, and positive (p = 0.023) and negative (p = 0.013) hip joint
work; and maximum MTP (p ≤ 0.001) and ankle (p = 0.021) plantarflexion velocity. Compared to Control, stance
times were significantly longer in Stiff (p ≤ 0.001, d = 0.20), Stiffer (p = 0.008, d = 0.21), and Stiffest (p ≤ 0.001,
d = 0.31); positive MTP joint work was greater in Stiff (p = 0.017, d = 0.37), Stiffer (p = 0.001, d = 0.88), and Stiff-
est (p ≤ 0.001, d = 0.94); positive ankle joint work was greater in Stiff (p = 0.008, d = 0.42) and Stiffer (p ≤ 0.001,
d = 0.47); positive knee joint work was lower in Stiffest (p = 0.015, d = 0.33); positive hip joint work was greater
in Stiffest (p = 0.009, d = 0.30); negative MTP joint work was lower in Stiffest (p = 0.017, d = 0.38); negative ankle
joint work was greater in Stiffer (p = 0.004, d = 0.39); negative hip joint work was greater in Stiffest (p = 0.008,
d = 0.32); and maximum MTP (p ≤ 0.001, d = 1.24) and ankle (p = 0.017, d = 0.49) plantarflexion velocities were
lower in Stiffest. There was no effect of MBS (p = 0.462) on total lower limb joint work (i.e., sum of positive and
negative work across all joints) (Supplementary Table S5).
Discussion
The primary purpose of this study was to investigate if the total shortening and the average shortening velocity
of the GM muscle is reduced when running in shoes with increased MBS. The hypothesis that total GM fascicle
shortening would not be affected by MBS was rejected as running in Stiffer and Stiffest significantly reduced
the amount of fascicle shortening compared to Control. The second hypothesis that running in footwear with
increased MBS would reduce average GM shortening velocities was accepted. This study provides the first direct
evidence that muscle function can be altered by increasing the MBS of running shoes. In fact, the lower GM
shortening velocities, in theory, should reduce contractile energy cost as a result of the muscle’s force–veloc-
ity relationship24; however, this hypothesis could not be supported here since no significant reductions in the
estimated GM muscle energy cost were shown. Although there was a substantial reduction (~ 5%) in estimated
GM energy cost when running in Stiffest compared to Control, the differences shown were not significant and
of small to medium effect across all conditions. Contrary to our null hypothesis that AT energy return would
Scientific Reports | (2021) 11:749 | https://doi.org/10.1038/s41598-020-80791-3 4
Vol:.(1234567890)www.nature.com/scientificreports/
not be affected by MBS, AT energy return, in fact, was significantly greater in all stiff conditions compared to
Control. While GM energy cost was lower in the stiff conditions (Table 1) compared to Control, this difference
was not significant. Considerable between-subject variability likely precluded a significant MBS effect on esti-
mated GM energy cost.
Although the GM fascicles shortened less with increased MBS, the sagittal ankle joint angles did not dif-
fer between conditions (Supplementary Fig. S4). Therefore, it is likely that the AT performed the outstanding
“shortening” of the entire shank MTU resulting in more energy returned. This increased AT energy return
when running in stiffer shoes could potentially allow the ankle plantarflexor muscles to continue to operate
on a more favourable position of the muscle’s force–length–velocity relationship, reducing the required level
of muscle activation to achieve a target force and thus should improve E run24,25. It is important to consider the
potential benefits of running in stiff shoes during runs of longer periods of time than what was measured in this
study. It has previously been demonstrated that the Erun progressively increases during a long-distance r un26–29.
This increase was partially related to the increase in muscle contractile energy c ost30 and/or the redistribution
of joint work to MTUs surrounding more proximal MTUs (e.g., knee), which are speculated to metabolically be
more costly than the triceps surae muscles and AT31. It has been suggested that the tendons of more proximal
MTUs are less equipped for elastic energy storage and return31, which would require the muscle in series to
perform additional w ork32. This additional muscle work would require greater active muscle volume, potentially
elevating the metabolic cost of running32. Together, running in stiffer shoes may reduce muscle fatigue during
long-distance running events, delay the onset of joint work r edistribution33, and therefore mitigate progressive
increases in Erun normally seen when running in less stiff footwear. Future studies should aim to investigate how
in-vivo muscle and tendon dynamics change during a prolonged run in footwear with different MBS.
Based on the findings of Cigoja et al.18, it was expected to find differences in GM shortening velocities towards
the end of stance. The highest GM shortening velocities, however, were observed during early stance (~ 0 to
10% of stance). During this period, the generated muscular forces were estimated to be lower compared to later
instances of stance due to relatively low GRFs immediately after heel strike. It is therefore speculated that the
GM muscle shortened in early stance, while the GRFs are relatively small, to stretch the AT. This “pre-tuning”
of the tendon would then allow the AT to stretch even further as the ankle joint undergoes dorsiflexion, and
potentially stores elastic energy within the tendon. A portion of this AT elastic energy is speculated to subse-
quently be returned to the runner.
Although significant effects of MBS on GM shortening and shortening velocity were observed, neither Erun nor
GM energy cost differed significantly between stiffness conditions. It is possible that MBS not only affected GM
function but also the shortening and/or shortening velocity of other lower limb muscles. Previous studies have
shown that MBS can result in a redistribution of lower limb joint work, where more positive work is performed at
the MTP joint and less positive work is performed at the knee joint13. Similarly, the findings of this study showed
significantly more positive work performed at the MTP and ankle joint and less positive work performed at the
knee joint when running in the stiffer conditions (Supplementary Table S5). It is therefore plausible to speculate
that not only the function of distal MTUs are affected by MBS but also the MTUs surrounding more proximal
joints (e.g., the knee and hip). The MBS may have affected different MTUs in such a manner that “positive” and
“negative” effects cancelled each other out so that no differences in whole-body Erun were observed during a
5 min. and 30 s-run. Future studies should attempt to synchronously record muscle fascicle and tendon images
of multiple MTUs to investigate if different MTUs are affected differently by the MBS of shoes.
A recently published article investigated the effects of running with differently stiff carbon fibre plates on
soleus muscle fascicle dynamics and running economy34. The authors found no systematic differences in soleus
fascicle pennation, force, length, velocity, or stride-average soleus active muscle volume between stiffness condi-
tions. Beck et al.34 therefore concluded that running with carbon fibre plates may not improve running economy
and long-distance running performance. There were some methodological differences between Beck et al.’s study
and ours that need to be considered when comparing the findings. First, the muscle under investigation differed
between studies. Although it has been shown that the three triceps surae muscles function similarly during
stance (i.e., they consistently shorten throughout ground contact) across a range of running s peeds35, Lai et al.35
demonstrated that there can still be differences in fascicle length changes between the soleus and GM muscle.
More specifically, the GM muscle shortens to a greater extent than the soleus muscle during running. It is there-
fore reasonable to speculate that if differences in muscle fascicle shortening and shortening velocity exist when
running in various stiffness conditions, then these differences will likely be found at a muscle that undergoes
a greater range of length changes. Second, there are considerable morphological differences between the GM
and soleus muscle. For example, the GM muscle contains a higher percentage of Type II (or fast-twitch) fibres
than the soleus36. The fact that the GM muscle predominantly consists of fast-twitch fibres allows it to generate
greater forces during locomotion compared to the s oleus37. In-vivo measurements of the GM and soleus forces
in an animal model have shown that GM forces increase by a factor of 5 when transitioning from a walking to
a running speed37. Peak soleus force increases, however, were negligible. The effects of high running speeds on
GM and soleus forces become evidently important when considering that participants in Beck et al.’s study34
were running at a constant speed of 3.5 m s−1; whereas, our participants ran at 90% of individual sLT, which was
for only 3 out of 17 participants below 3.5 m s−1.
Upon their release, the Vaporfly shoes varied in many footwear features from conventional running shoes:
curved carbon fibre plate, resilient midsole material, high stack height (i.e., midsole thickness), etc. This cur-
rent study cannot explain how each of these features affected lower limb muscle function and consequently Erun
during the most recent world record runs. This study can only address how systematically increasing the MBS
of shoes affects GM muscle and AT tendon energetics in running. When Control was compared to Best, a ~ 2%
improvement in Erun was observed on average when running in shoes with straight carbon fibre plates. Previous
studies reported improvements in E run of 4% on average when running in the Vaporfly s hoes1,3–5. We speculate
Scientific Reports | (2021) 11:749 | https://doi.org/10.1038/s41598-020-80791-3 5
Vol.:(0123456789)www.nature.com/scientificreports/
that similar reductions in total GM shortening and shortening velocity could be observed in Vaporfly compared
to ‘conventional’ running footwear. This could potentially explain parts of the 4% metabolic energy savings when
running in Vaporfly. The fact that the metabolic savings in Vaporfly shoes were reported to be twice as high as in
our study suggests that other mechanisms produced by the Vaporfly shoes contributed to additional metabolic
cost savings. One possible characteristic would be the curved design of the carbon fibre plate. Nigg et al.14 sug-
gested that a curved carbon fibre plate could act as a ’teeter-totter’, where a reaction force is created at the heel
as the runner’s force is applied at the forefoot and the centre of pressure moves anteriorly, passed the pivot point
of the plate. This ’teeter-totter’ mechanism was speculated to be one of the main contributors of improved E run
when running in the Vaporfly shoes and could account for some of the outstanding 2% in metabolic savings of
the current study. Although curved plates were speculated to have a different function than the straight plates,
the biomechanical findings in this study (e.g., stance times and ankle and MTP joint work, angular velocities, and
angles) were comparable to previously reported result when using curved p lates1–3. Therefore, it is plausible to
speculate that the GM muscle was similarly affected during the recent world record runs. Future studies, however,
should investigate how the curvature of carbon fibre plates affects muscle and tendon dynamics during running.
In our study, there were no group effects of MBS on E run. This is in accordance with some s tudies34,38,39 but
contrary to other s tudies11,22. More importantly, however, when Control was compared to Best (i.e., plated con-
dition, which resulted in lowest E run), an average improvement in E run of 1.97% was observed in the best plated
shoe condition. This is in accordance with the findings by Madden et al.38. The authors, at first, demonstrated
that there were no differences in running economy between a control and stiff shoe; however, once they split up
their runners into responders and non-responders, the responders showed an average improvement in running
economy of 2.9% when running in the stiff shoe condition. A 2.9% improvement in running economy would
correspond to a performance improvement of 1.93%40 or 2.26%41, which on a 2-h. marathon would correspond to
a decrease in running time of ~ 139 or ~ 163 s. Stefanyshyn and Fusco10 showed group improvements in sprinting
performance (i.e., in absolute time) of ~ 0.47% when the stiffness of sprinting spikes was increased by inserting
straight carbon fibre plates with a stiffness of 47 N·mm−1 in athletes’ own footwear. More importantly, however,
the athletes had their individual best performance in different stiffness conditions. When these subject-specific
performance responses were taken into account, mean improvements in the best stiffness condition of 1.2% were
observed compared to the own shoes. This not only demonstrates that subject-specific performances responses
exist when the stiffness of shoes is increased, but also that performance improvements are much greater (i.e.,
2.5-fold) when the individual effects are taken into account compared to group differences. Additionally, it shows
that although there may11,22 or may not34,38,39 be significant group differences (e.g., Control vs. Stiff vs. Stiffer vs.
Stiffest), the true effect of MBS on performance is greatly underestimated if the subject-specific responses are not
taken into account. In our study, an average improvement in E run of 1.97% in Best would correspond to ~ 9440
or ~ 11141 s on a 2-h. marathon. It needs to be acknowledged, however, that a comparison between Control and
one of three plated conditions (i.e., Best) increases the probability of obtaining a false positive finding.
There are some limitations and assumptions associated with this study. We used a single GM muscle fascicle as
a representation of the entire triceps surae muscle group. It is possible that regional differences in muscle fascicle
properties (i.e., distal vs. proximal end of the muscle) exist42. The imaged area of the GM muscle, however, was
consistent between footwear conditions within a subject, and therefore it is assumed that regional differences in
fascicle properties only minimally affected the interpretation of the results of this study. Further, the force acting
through the AT was assumed to be solely generated by the GM muscle. This is not true as other muscles (e.g.,
gastrocnemius lateralis, soleus, etc.) also contribute to ankle joint plantarflexion. Therefore, the absolute GM
force, fascicle work, and energy cost were likely overestimated. In a study of a within-subject design, however,
this assumption would not affect the interpretation of the results. Further, it needs to be noted that the AT length
changes were not directly assessed during the stance phase, as direct measurements of tendon length changes
during running are challenging, and do not fit theoretical e xpectations43. We calculated tendon length changes
from GM muscle fascicle and MTU length changes taking the ankle and knee joint angles into account44. This
assumes that the aponeurosis is of equal stiffness as the free tendon, and does not contribute to the storage and
return of elastic energy, which may not be true45,46, and could change with the level of muscle activation47. Thus,
we have likely underestimated the total amount of energy return by the AT (and aponeurosis), particularly in
instances where AT force was high. Lastly, in order to aid in the interpretation of changes in Erun between Control
and Best, the smallest worthwhile change (SWC) as measured by the metabolic cart was determined. The SWC
for Erun was calculated to be 0.95%. It needs to be noted that not all participants exhibited changes in Erun greater
than the SWC. For 9 out of 14 participants, however, the change in Erun between Control and Best was greater
than 0.95% (range 1.00–4.71%).
Conclusions
This study is the first to provide direct evidence that gastrocnemius medialis muscle function can be altered when
running in shoes with increased midsole bending stiffness. Specifically, when the stiffness of running shoes is
increased ‘optimally’, the gastrocnemius medialis shortening velocities were reduced and Achilles tendon energy
return was increased. These effects on gastrocnemius medialis muscle and Achilles tendon function could be
one of the underlying mechanisms of increased performance when running in shoes with embedded carbon
fibre plates.
Materials and methods
Participants. Seventeen trained male runners (mean ± SD; age: 26.6 ± 5.9 years, height: 1.78 ± 0.08 m, mass:
70.7 ± 9.1 kg) visited the laboratory on two separate occasions. Participants were included in this study if they
were able to run 10 km in under 44 min., were free from lower limb injuries 6 months prior to testing, and
Scientific Reports | (2021) 11:749 | https://doi.org/10.1038/s41598-020-80791-3 6
Vol:.(1234567890)www.nature.com/scientificreports/
fit a size 9, 10, or 11 US running shoe. This study was approved by the University of Calgary Conjoint Health
Research Ethics Board (REB19-1432). All experiments were performed according to the approved protocol and
in accordance with the ethical standards of the Declaration of Helsinki. All participants gave written informed
consent prior to participating in this study. Where relevant, informed consent was obtained from participants
for publication of identifying information/images in an online open-access publication.
Footwear conditions. The control condition (Control) consisted of a Nike Free Run 2018 (Nike Inc., Bea-
verton, USA) shoe. The stiff conditions were achieved by inserting straight carbon fibre plates of 1 mm (Stiff),
1.5 mm (Stiffer), and 2 mm (Stiffest) thickness between the factory insole and midsole, and along the full length
of the shoe. The MBS of the shoes was determined by a 3-point bending test11,13, where the forefoot of the shoe
was placed on a custom-made structure with two supporting pins. An indenter was attached to an ElectroPuls
E10000 Linear-Torsion testing machine (Instron, Norwood, USA), which applied a compressive force vertically
in the area of the MTP joint. The testing machine was set to displace the shoe by 20 mm at a speed of 10 mm s−1.
This was repeated ten times for each shoe size and condition. The force and displacement data were filtered using
a dual pass 2nd order Butterworth filter with a cut-off frequency of 5 Hz. The slope of the force–displacement
curve (i.e., stiffness) was determined for all ten loading cycles. The stiffness values were first averaged between
80 and 90% of each loading curve (i.e., linear portion of the force–displacement curve) and then across all ten
cycles. The shoes’ hysteresis (i.e., lost energy) was determined as the difference in mechanical energy that was
stored during the loading phase and that was returned during the unloading phase. The lost energy was rep-
resented as a percentage of the energy stored during the loading phase. The MBS and hysteresis values were:
Control, 1.58 N mm−1 and 35.26%; Stiff, 4.02 N mm−1 and 22.72%; Stiffer, 6.46 N mm−1 and 23.91%; Stiffest,
13.28 N mm−1 and 22.37%. The footwear conditions were weight matched by inserting small masses in the fore-
foot, midfoot, and rearfoot region of the control shoe. Across all conditions, the masses were 259, 280, and 296 g
for the size 9, 10, and 11 US shoes, respectively.
Data collection. On the first visit, individual speed at lactate threshold (sLT) was determined based on
methods described e lsewhere48 while participants ran in Control on a treadmill (Bertec Corporation, Columbus,
USA) with no gradient. In brief, participants first performed a 5-min. warm-up at self-selected speed. Imme-
diately after the warm-up, a fingertip blood sample was taken to determine resting blood lactate concentration
(Lactate Pro, Sports Resource Group Inc., Minneapolis, USA). After the warm-up, the treadmill belt speed was
increased by 0.8 km h−1 every two minutes, after which blood lactate concentration was measured. This was
repeated until blood lactate concentration rose more than 1 mmol from the previous sample. sLT was deter-
mined as the speed at the stage preceding the final stage.
On the second visit, participants ran for 5 min. and 30 s at 90% of sLT in each shoe condition, respectively.
The order of conditions was randomised, and participants rested for 15 min. between footwear conditions to
minimise potential fatigue effects. Subjects were asked to refrain from extensive physical activity for 24 h. before
the testing session. Prior to running in each footwear condition, participants ran at 3 m s−1 for 3 min. to get accus-
tomed to running in the shoe conditions and with the measurement equipment. Immediately after the 3-min.
familiarisation run, speed was increased to 90% of individual sLT for 5 min. and 30 s. Gastrocnemius medialis
(GM) muscle fascicle images of the right leg were acquired using B-mode ultrasound imaging and a flat-shaped,
60 mm-long, linear probe (LV8-5N60-A2, ArtUs, Telemed, Vilnius, Lithuania) with a centre frequency of 8 MHz
and a sampling frequency of 154 Hz. The GM muscle was chosen over other triceps surae muscles because Lai
et al.35 showed that muscle fascicle length changes during the stance phase of running were greatest at the GM
muscle. Indirect calorimetry was used to measure breath-by-breath rate of oxygen uptake (V̇O2 in ml kg−1 min−1)
and carbon dioxide output ( V̇CO2 in ml kg−1 min−1) using a metabolic cart (Quark CPET, COSMED srl, Rome,
ITA). Prior to each testing session, the metabolic cart was calibrated using room air and a gas mixture of known
composition. The flow sensor was calibrated manually with a 3-l syringe. Three-dimensional kinematic and
kinetic data of the right lower limb were recorded at 200 and 1000 Hz using eight high-speed video cameras
(Vicon Motion Systems Ltd., Oxford, UK) and a force-instrumented treadmill (Bertec Corporation, Columbus,
USA), respectively. Retroreflective markers of 12 mm diameter were mounted on anatomical landmarks of the
pelvis and right lower limb according to Cigoja et al.13. Kinematic, kinetic, and ultrasound data were synchro-
nously recorded for approximately 20 s starting at the end of minute 5 of each run, which resulted in 28–33 steps
of the right lower limb per footwear condition and participant, respectively. The middle 25 steps were identified
and used for further analyses. Breath-by-breath metabolic data were recorded for the entire duration of the run.
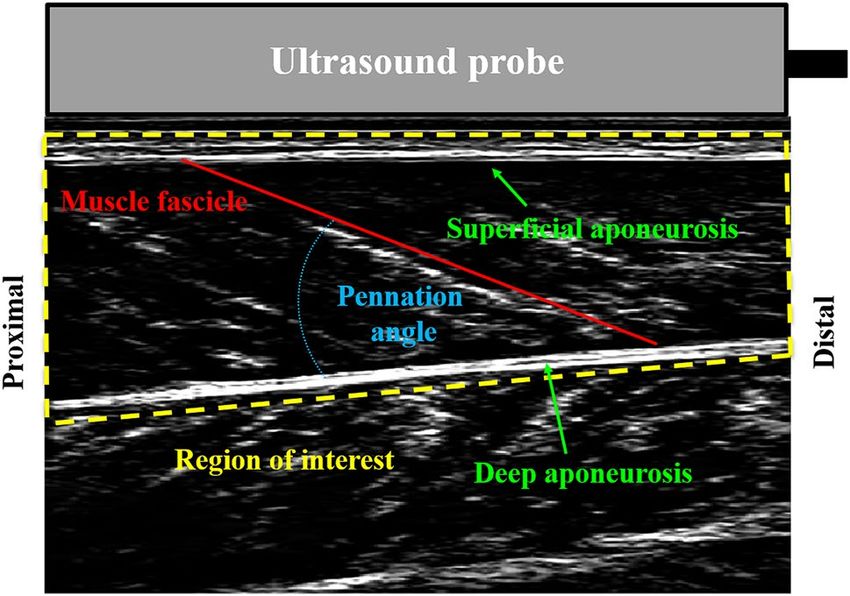
Data processing and analysis. Ultrasound data. The GM muscle fascicle images (Fig. 4) of the right
lower limb were tracked using a semi-automated tracking a lgorithm49. Manual adjustments were made when the
tracking algorithm did not identify the fascicle end points well. Muscle fascicle lengths were smoothened using a
dual-pass second order (i.e., zero-lag fourth order) Butterworth filter with a low-pass cut-off frequency of 25 Hz.
Muscle fascicle velocity was calculated by deriving fascicle length with respect to time. Fascicle lengths at heel-
strike and toe-off, total change of fascicle length and average fascicle velocity over the stance phase of running
were identified and used for further comparisons. The ultrasound data for three participants were excluded from
any analyses due to insufficient quality of muscle fascicle images.
Gastrocnemius medialis and Achilles tendon energetics. Mechanical work performed by the GM fascicles was
calculated as the integral of fascicle force and fascicle length change over the entire stance phase. Achilles tendon
force was estimated based on a previously described musculoskeletal model18,50,51. For this, the sagittal plane
ankle joint moment was divided by the AT moment arm. The AT moment arm was estimated by measuring the
Scientific Reports | (2021) 11:749 | https://doi.org/10.1038/s41598-020-80791-3 7
Vol.:(0123456789)www.nature.com/scientificreports/
Figure 4. Exemplary image of the gastrocnemius medialis muscle fascicle during running.
horizontal distances between the medial and lateral malleoli to the posterior aspect of the calcaneus using digital
callipers. The medial and lateral distances were then averaged. The GM force was estimated based on the rela-
tive physiological cross-sectional area of all ankle plantarflexor muscles by multiplying the AT force by 0.174652.
Then, the scaled AT force was divided by the cosine of the pennation angle of the GM muscle fascicle. Positive
fascicle work was considered fascicle shortening; the point during which the fascicles were generating mechani-
cal energy during the stance phase24.
The GM energy cost was calculated during the entire stance phase for each footwear condition according to
Fletcher and M acIntosh53. In brief, GM energy cost was approximated from the estimated number of active in-
parallel crossbridges required to generate the calculated GM force, the number of crossbridge cycles during the
stance phase, and the number of half-sarcomeres in series. To estimate the number of in-parallel crossbridges,
the calculated GM force was divided by the estimated force per crossbridge. Because the force per crossbridge
decreases with increasing shortening v elocity54, the force per crossbridge was scaled to sarcomere shortening
velocity at physiological t emperatures54, assuming a crossbridge force of 3 pN under near-isometric c onditions55.
Sarcomere shortening velocity relative to maximal shortening velocity was calculated from the instantaneous
fascicle shortening velocity throughout the stance phase, and assuming a maximal shortening velocity of 10.6
Lengthfascicle s−1. The latter was calculated from the assumed maximal shortening velocities of Type I and Type
II fibres of 4.4 Lengthfascicle s−1 and 16.8 Lengthfascicle s−1 at physiological t emperatures56 and assuming the GM
consisted of 50% Type I fi bres57. The number of half-sarcomeres in series was estimated as the ratio of fascicle
length during stance to half-sarcomere length, assuming an optimal sarcomere length during maximal activa-
tion of 2.6 µm at the short side of the plateau region of the sarcomere force–length r elationship58. The number
of crossbridge cycles was estimated from the amount of shortening within each half-sarcomere, which was esti-
mated from the amount of GM fascicle length change during the stance phase. To accommodate this magnitude
of shortening, we assumed the filaments move 10 nm with each crossbridge c ycle59. Lastly, we assumed that one
adenosine triphosphate (ATP) was consumed for each crossbridge cycle, and that 48 kJ were liberated per mol
of ATP60,61. The GM energy cost was only calculated during the stance phase of running because GM force and
power has been shown to be greater during stance with minimal to no force and power during s wing62. It can
therefore be assumed that the energy consumed by the GM muscle is negligible during swing compared to stance.
The shank MTU length was calculated based on methods proposed by Hawkins and Hull63 using the instan-
taneous ankle and knee joint angles. Instantaneous tendon length was estimated by subtracting the GM fascicle
length from the shank MTU length, taking the effect of muscle pennation angle into account64. Achilles tendon
power was calculated by multiplying tendon force by tendon lengthening/shortening velocity at each instant
during the stance phase. Tendon work was determined by integrating AT power relative to time. Positive tendon
work represented the utilization of elastic strain energy that was stored earlier in the stance phase65.
Metabolic data. The Erun (in J kg−1 m−1) was calculated as the breath-by-breath energy expenditure averaged
across the final minute of each run, relative to body mass and distance covered within the last minute of the run
for each condition, respectively. The Peronnet and Massicotte equation66,67 was used to convert the measured
O2 consumption and CO2 production to units of energy (Joule). The best stiff condition was determined as the
condition with a carbon fibre plate, which resulted in the lowest E run. To aid in interpretation of changes in E run,
we calculated the technical error of measurement using the root mean square m ethod68,69. The technical error
(TE) of measurement was determined using VO2 averaged across four intervals of 15 s during the final minute of
running in the control condition. Then, the SWC, which represents the smallest difference between conditions
that can be considered “meaningful”70,71, was calculated as 0.5 × TE72. The SWC in E run was considered 0.95%.
Kinematic and kinetic data. Raw kinematic and kinetic data of the right lower limb were analysed using a cus-
tom written MATLAB code (Version R2019a, the MathWorks Inc., Natick, USA). Force data were downsampled
to 200 Hz to match the motion capture data. Kinematic and kinetic data were then smoothed using a dual-pass
Scientific Reports | (2021) 11:749 | https://doi.org/10.1038/s41598-020-80791-3 8
Vol:.(1234567890)www.nature.com/scientificreports/
second order Butterworth filter with a low-pass cut-off frequency of 50 Hz. Cardan angles were calculated for
the MTP, ankle, knee, and hip joint with a flexion–extension, abduction–adduction, and internal–external rota-
tion sequence. An inverse dynamics approach was performed to determine internal joint reaction moments.
Instantaneous joint power was calculated as the dot product between joint moment and angular velocity for the
sagittal, frontal, and transverse plane, respectively; then, joint power was summed across planes. Positive and
negative joint work was calculated as the time-integral of positive and negative joint power, respectively.
Statistics. Values are presented as mean ± standard deviation, unless otherwise indicated. Shapiro–Wilk tests
were performed to test for normality of all dependent variables. If the Shapiro–Wilk test revealed normal distri-
bution, one-way repeated measures analysis of variance (ANOVA) was used to test effects of MBS on a depend-
ent variable; otherwise, the non-parametric equivalent (i.e., Friedman test) was used. Where the ANOVA or
Friedman test revealed significant effects (i.e., p ≤ 0.050) of MBS, multiple pairwise comparisons were performed
using two-tailed Student’s paired t test or Wilcoxon’s signed-rank test to test for differences between Control
and each stiff condition (i.e., Control vs. Stiff, Control vs. Stiffer, and Control vs. Stiffest). For multiple compari-
sons, the significance level was set to p ≤ 0.017 (0.050 ÷ 3 comparisons = 0.017). Effect sizes were quantified using
Cohen’s d and were considered small, medium, and large for d ≥ 0.2, d ≥ 0.5, and d ≥ 0.8, respectively73. A two-way
ANOVA (MBS × %Stance) with repeated measures (MBS) was used to test for differences in GM muscle energy
cost across the entire stance phase. When there was no significant interaction but a significant main effect was
found, Tukey’s post-hoc test was used to detect significant differences between the MBS conditions.
Received: 30 June 2020; Accepted: 28 December 2020
References
1. Hoogkamer, W. et al. A comparison of the energetic cost of running in marathon racing shoes. Sport. Med. 48, 1009–1019 (2018).
2. Hoogkamer, W., Kipp, S. & Kram, R. The biomechanics of competitive male runners in three marathon racing shoes: A randomized
crossover study. Sport. Med. 49, 133–143 (2019).
3. Hunter, I. et al. Running economy, mechanics, and marathon racing shoes. J. Sports Sci. 37, 2367–2373 (2019).
4. Barnes, K. R. & Kilding, A. E. A randomized crossover study investigating the running economy of highly-trained male and female
distance runners in marathon racing shoes versus track spikes. Sport. Med. 49, 331–342 (2019).
5. Quealy, K. & Katz, J. Nike says its $250 running shoes will make you run much faster. What if that’s actually true?. N. Y. Times 20,
20 (2018).
6. Connell, J. L. et al. Stacked cushioning arrangement for sole structure. (2018).
7. Stefanyshyn, D. J. & Nigg, B. M. Influence of midsole bending stiffness on joint energy and jump height performance. Med. Sci.
Sports Exerc. 32, 471–476 (2000).
8. Stefanyshyn, D. J. & Nigg, B. M. Mechanical energy contribution of the metatarsophalangeal joint to running and sprinting. J.
Biomech. 30, 1081–1085 (1997).
9. Stefanyshyn, D. J. & Nigg, B. M. Contribution of the lower extremity joints to mechanical energy in running vertical jumps and
running long jumps. J. Sports Sci. 16, 177–186 (1998).
10. Stefanyshyn, D. J. & Fusco, C. Athletics: Increased shoe bending stiffness increases sprint performance. Sport. Biomech. 3, 55–66
(2004).
11. Roy, J. P. R. & Stefanyshyn, D. J. Shoe midsole longitudinal bending stiffness and running economy, joint energy, and EMG. Med.
Sci. Sports Exerc. 38, 562–569 (2006).
12. Willwacher, S., König, M., Potthast, W. & Brüggemann, G. Does specific footwear facilitate energy storage and return at the meta-
tarsophalangeal joint in running?. J. Appl. Biomech. 29, 583–592 (2013).
13. Cigoja, S. et al. Does increased midsole bending stiffness of sport shoes redistribute lower limb joint work during running?. J. Sci.
Med. Sport 22, 20 (2019).
14. Nigg, B. M., Cigoja, S. & Nigg, S. R. Effects of running shoe construction on performance in long distance running. Footwear Sci.
https://doi.org/10.1080/19424280.2020.1778799 (2020).
15. Nigg, B. M., Cigoja, S. & Nigg, S. R. Teeter-totter effect: A new mechanism to understand shoe-related improvements in long-
distance running. Br. J. Sports Med. 10, 1–2 (2020).
16. Willwacher, S., König, M., Braunstein, B., Goldmann, J. P. & Brüggemann, G. P. The gearing function of running shoe longitudinal
bending stiffness. Gait Posture 40, 386–390 (2014).
17. Takahashi, K. Z., Gross, M. T., Van Werkhoven, H., Piazza, S. J. & Sawicki, G. S. Adding stiffness to the foot modulates soleus
force-velocity behaviour during human walking. Sci. Rep. 6, 1–11 (2016).
18. Cigoja, S. et al. The effects of increased midsole bending stiffness of sport shoes on muscle-tendon unit shortening and shortening
velocity: A randomised crossover trial in recreational male runners. Sport. Med. Open 6, 1–11 (2020).
19. Nigg, B. M., Stefanyshyn, D. J. & Denoth, J. Mechanical considerations of work and energy. In Biomechanics and Biology of Move-
ment (eds Nigg, B. M. et al.) 5–18 (Champaign, Human Kinetics, 2000).
20. Carrier, D. R., Heglund, N. C. & Earls, K. D. Variable gearing during locomotion in the human musculoskeletal system. Science
(80–) 265, 651–653 (1994).
21. Ray, S. F. & Takahashi, K. Z. Gearing up the human ankle-foot system to reduce energy cost of fast walking. Sci. Rep. 10, 1–12
(2020).
22. Oh, K. & Park, S. The bending stiffness of shoes is beneficial to running energetics if it does not disturb the natural MTP joint
flexion. J. Biomech. 53, 127–135 (2017).
23. Stefanyshyn, D. J. & Wannop, J. W. The influence of forefoot bending stiffness of footwear on athletic injury and performance.
Footwear Sci. 8, 51–63 (2016).
24. Fletcher, J. R., Groves, E. M., Pfister, T. R. & MacIntosh, B. R. Can muscle shortening alone, explain the energy cost of muscle
contraction in vivo?. Eur. J. Appl. Physiol. 113, 2313–2322 (2013).
25. Roberts, T. J., Kram, R., Weyand, P. G. & Taylor, C. R. Energetics of bipedal running. I. Metabolic cost of generating force. J. Exp.
Biol. 201, 2745–2751 (1998).
26. Brueckner, J. C. et al. The energy cost of running increases with the distance covered. Eur. J. Appl. Physiol. Occup. Physiol. 62,
385–389 (1991).
Scientific Reports | (2021) 11:749 | https://doi.org/10.1038/s41598-020-80791-3 9
Vol.:(0123456789)www.nature.com/scientificreports/
27. Xu, F. & Montgomery, D. L. Effect of prolonged exercise at 65 and 80% VO2max on running economy. Int. J. Sports Med. 16,
309–315 (1995).
28. Hunter, I. & Smith, G. A. Preferred and optimal stride frequency, stiffness and economy: Changes with fatigue during a 1-h high-
intensity run. Eur. J. Appl. Physiol. 100, 653–661 (2007).
29. Petersen, K., Hansen, C. B., Aagaard, P. & Madsen, K. Muscle mechanical characteristics in fatigue and recovery from a marathon
race in highly trained runners. Eur. J. Appl. Physiol. 101, 385–396 (2007).
30. Fletcher, J. R. & MacIntosh, B. R. Changes in Achilles tendon stiffness and energy cost following a prolonged run in trained distance
runners. PLoS One 13, 1–17 (2018).
31. Sanno, M., Willwacher, S., Epro, G. & Brüggemann, G. P. Positive work contribution shifts from distal to proximal joints during
a prolonged run. Med. Sci. Sports Exerc. 50, 2507–2517 (2018).
32. Fletcher, J. R. & Macintosh, B. R. Running economy from a muscle energetics perspective. Front. Physiol. 8, 1–15 (2017).
33. Cigoja, S., Fletcher, J. R. & Nigg, B. M. Can increased midsole bending stiffness of sport shoes delay the onset of lower limb joint
work redistribution during a prolonged run? In Proceedings to the 38th Conference of the International Society of Biomechanics in
Sports (2020).
34. Beck, O. N., Golyski, P. R. & Sawicki, G. S. Adding carbon fiber to shoe soles does not improve running economy: A muscle-level
explanation. Sci. Rep. 10(17154), 1–13 (2020).
35. Lai, A. K. M., Lichtwark, G. A., Schache, A. G. & Pandy, M. G. Differences in in vivo muscle fascicle and tendinous tissue behavior
between the ankle plantarflexors during running. Scand. J. Med. Sci. Sport. 28, 1828–1836 (2018).
36. Myatt, J. P., Schilling, N. & Thorpe, S. K. S. Distribution patterns of fibre types in the triceps surae muscle group of chimpanzees
and orangutans. J. Anat. 218, 402–412 (2011).
37. Herzog, W. & Leonard, T. R. Validation of optimization models that estimate the forces exerted by synergistic muscles. J. Biomech.
24, 31–39 (1991).
38. Madden, R., Sakaguchi, M., Tomaras, E. K., Wannop, J. W. & Stefanyshyn, D. Forefoot bending stiffness, running economy and
kinematics during overground running. Footwear Sci. 8, 91–98 (2016).
39. Flores, N., Delattre, N., Berton, E. & Rao, G. Does an increase in energy return and/or longitudinal bending stiffness shoe features
reduce the energetic cost of running?. Eur. J. Appl. Physiol. 119, 429–439 (2019).
40. Kipp, S., Kram, R. & Hoogkamer, W. Extrapolating metabolic savings in running: Implications for performance predictions. Front.
Physiol. 10, 1–8 (2019).
41. Hoogkamer, W., Kipp, S., Spiering, B. A. & Kram, R. Altered running economy directly translates to altered distance-running
performance. Med. Sci. Sports Exerc. 48, 2175–2180 (2016).
42. Moo, E. K. & Herzog, W. Sarcomere contractile behaviours are location-dependent in living whole muscle. Can. Soc. Biomech. Sup
1, 20 (2018).
43. Matijevich, E. S., Branscombe, L. M. & Zelik, K. E. Ultrasound estimates of Achilles tendon exhibit unexpected shortening during
ankle plantarflexion. J. Biomech. 72, 200–206 (2018).
44. Hawkins, D. & Hull, M. L. A method for determining lower extremity muscle-tendon lengths during flexion/extension movements.
J. Biomech. 23, 487–494 (1990).
45. Herzog, W. The problem with skeletal muscle series elasticity. BMC Biomed. Eng. 1, 1–14 (2019).
46. Arampatzis, A., Karamanidis, K., Morey-Klapsing, G., De Monte, G. & Stafilidis, S. Mechanical properties of the triceps surae
tendon and aponeurosis in relation to intensity of sport activity. J. Biomech. 40, 1946–1952 (2007).
47. Lieber, R. L., Leonard, M. E. & Brown-Maupin, C. G. Load-strain properties of frog aponeurosis and tendon. Cells Tissues Organs
166, 48–54 (2000).
48. Fletcher, J. R., Esau, S. P. & Macintosh, B. R. Economy of running: Beyond the measurement of oxygen uptake. J. Appl. Physiol.
107, 1918–1922 (2009).
49. Farris, D. J. & Lichtwark, G. A. UltraTrack: Software for semi-automated tracking of muscle fascicles in sequences of B-mode
ultrasound images. Comput. Methods Programs Biomed. 128, 111–118 (2016).
50. Scott, S. H. & Winter, D. A. Internal forces at chronic running injury sites. Med. Sci. Sport. Exerc. 22, 357–369 (1990).
51. Firminger, C. R., Bruce, O. L., Wannop, J. W., Stefanyshyn, D. J. & Edwards, W. B. Effect of shoe and surface stiffness on lower limb
tendon strain in jumping. Med. Sci. Sport. Exerc. 51, 1–9 (2019).
52. Fukunaga, T. et al. Physiological cross-sectional area of human leg muscles based on magnetic resonance imaging. J. Orthop. Res.
10, 926–934 (1992).
53. Fletcher, J. R. & MacIntosh, B. R. Achilles tendon strain energy in distance running: Consider the muscle energy cost. J. Appl.
Physiol. 118, 193–199 (2015).
54. De Tombe, P. P. & Keurs, H. E. D. J. Force and velocity of sarcomere shortening in trabeculae from rat heart. Circ. Res. 66, 1239–1254
(1990).
55. Finer, J. T., Simmons, R. M. & Spudicht, J. A. Single myosin molecule mechanics: Piconewton forces and nanometre steps. Nature
368, 113–119 (1994).
56. Bohm, S., Mersmann, F., Santuz, A., Arampatzis, A. & Bohm, S. The force–length–velocity potential of the human soleus muscle
is related to the energetic cost of running. Proc. R. Soc. B 20, 20 (2019).
57. Edgerton, V. R. & Smith, J. L. Muscle fibre type populations of human leg muscles. Histochem. J. 7, 259–266 (1975).
58. Herzog, W. & Keurs, H. E. D. J. Physiology force–length relation of in-vivo human rectus femoris muscles. Pflügers Arch. 20,
642–647 (1988).
59. Barclay, C. J., Woledge, R. C. & Curtin, N. A. Inferring crossbridge properties from skeletal muscle energetics. Prog. Biophys. Mol.
Biol. 102, 53–71 (2010).
60. Barclay, C. J. Energetics of contraction. Compr. Physiol. 5, 961–995 (2015).
61. Homsher, E. & Kean, C. J. Skeletal muscle energetics and metabolism. Annu. Rev. Physiol. 40, 93–131 (1978).
62. Farris, D. J. & Sawicki, G. S. Human medial gastrocnemius force-velocity behavior shifts with locomotion speed and gait. Proc.
Natl. Acad. Sci. USA 109, 977–982 (2012).
63. Hawkins, D. A method for determining lower extremity muscle-tendon lengths during flexion/extension movements. J. Biomech.
23, 487–494 (1990).
64. Fukunaga, T., Kubo, K., Kawakami, Y., Fukashiro, S. & Maganaris, C. N. In vivo behaviour of human muscle tendon during walk-
ing. Proc. Biol. Sci. 268, 229–233 (2001).
65. Lai, A., Schache, A. G., Lin, Y. & Pandy, M. G. Tendon elastic strain energy in the human ankle plantar-flexors and its role with
increased running speed. J. Exp. Biol. https://doi.org/10.1242/jeb.100826 (2014).
66. Peronnet, F. & Massicotte, D. Table of nonprotein respiratory quotient: An update. Can. J. Sport Sci. 16, 23–29 (1991).
67. Kipp, S., Byrnes, W. C. & Kram, R. Calculating metabolic energy expenditure across a wide range of exercise intensities: The equa-
tion matters. Appl. Physiol. Nutr. Metab. 43, 639–642 (2018).
68. Fletcher, J. R., Asmussen, M. J., Nigg, S. R., MacIntosh, B. R. & Nigg, B. M. The effect of torsional shoe sole stiffness on knee moment
and gross efficiency in cycling. J. Sports Sci. 37, 1457–1463 (2019).
69. Batterham, A. M. & George, K. P. Reliability in evidence-based clinical practice: A primer for allied health professionals. Phys.
Ther. Sport 1, 54–62 (2000).
Scientific Reports | (2021) 11:749 | https://doi.org/10.1038/s41598-020-80791-3 10
Vol:.(1234567890)You can also read