Wind Microgeneration Strategy for Meeting California's Carbon Neutral Grid Goal - MDPI
←
→
Page content transcription
If your browser does not render page correctly, please read the page content below

applied
              sciences
Communication
Wind Microgeneration Strategy for Meeting California’s Carbon
Neutral Grid Goal
Geoffrey Niswander 1 and George Xydis 1,2, *

                                          1   Energy Policy and Climate Program, Krieger School of Arts and Sciences, Johns Hopkins University,
                                              Baltimore, MD 21201, USA; gniswan@jhu.edu
                                          2   Department of Business Development and Technology, Aarhus University, Birk Centerpark 15,
                                              7400 Herning, Denmark
                                          *   Correspondence: gxydis@gmail.com or gxydis@btech.au.dk; Tel.: +45-9350-8006

                                          Abstract: As California’s Renewables Portfolio Standard continues to phase power production from
                                          fossil fuels, carbon neutral sources will need to be implemented. This sets small-scale wind production
                                          and battery storage in a position to integrate into current grid infrastructure as means of production.
                                          This would be an “E Pluribus Unum” approach where many decentralized small production and
                                          storage units would act in combination to provide a stable grid. This is often referred to as distributed
                                          generation (DG). By distributing the grid’s production in this manner and designating predetermined
                                          regional hubs for control (in the event of a fractured grid due to natural disaster), the state and its
                                          residents will be able to maintain power for critical infrastructure and basic utilities. This work
                                          presents, in detail, a sustainable plan for achieving carbon neutral Californian grid by 2045.

                                          Keywords: microgeneration; Renewables Portfolio Standard; carbon neutral


Citation: Niswander, G.; Xydis, G.        1. Introduction
Wind Microgeneration Strategy for              The climate is changing in a negative way because of the actions of humans, who have
Meeting California’s Carbon Neutral
                                          caused the CO2 concentration to rise; for the first time, on 9 May 2013, CO2 levels in the air
Grid Goal. Appl. Sci. 2022, 12, 2187.
                                          reached above 400 parts per million (ppm). This milestone is an important reminder that
https://doi.org/10.3390/
                                          humans continue to shape the world, and our behavior has to change before it is too late. The
app12042187
                                          rising concentration of CO2 is causing the temperature and the sea level to rise, which was
Academic Editors: Maria da Glória         observed in the period 2011–2020, where every year was hotter than the previous one, with
Gomes and Rodolfo Dufo-López              2019 and 2020 being among the top three hottest years ever—the third one was 2016 [1].
                                               Climate changes are also seen in the daily weather as more frequent cloud bursts,
Received: 7 January 2022
Accepted: 17 February 2022
                                          increased number of days with strong winds, higher humidity, and many more days with
Published: 19 February 2022
                                          extremely high temperatures [2]. Different countries in the world have started to form
                                          coalitions, where participating countries are making different goals about lowering the CO2
Publisher’s Note: MDPI stays neutral      emissions, such as in the Paris Agreement, where the goal is to keep the global temperature
with regard to jurisdictional claims in
                                          rise below 2 ◦ C by the year 2100. According to the Intergovernmental Panel on Climate
published maps and institutional affil-
                                          Change, as a consequence, a major part of the population globally could be exposed to
iations.
                                          severe heatwaves and other natural disasters as often as once every five years. These
                                          goals will be reached by some general changes, but also by individual initiatives in the
                                          different countries [3]. The same trend was followed in most countries or states that have
Copyright: © 2022 by the authors.
                                          set ambitious goals, for example, in California in the US [4].
Licensee MDPI, Basel, Switzerland.             The California landscape is an amalgamation of geologic uplifting, tilting, folding,
This article is an open access article    and faulting. This has resulted in a unique challenge for the modern era’s electric grid. The
distributed under the terms and           state can be generalized into eleven geologic regions; The Klamath, Cascade, Coast, Sierra
conditions of the Creative Commons        Nevada, Transverse and Peninsular mountain ranges, the Basin and Range, the Modoc
Attribution (CC BY) license (https://     Plateau, the Mojave and Colorado deserts, and the Great Valley. The state’s electric grid
creativecommons.org/licenses/by/          spans all eleven regions and provides power to the residents of each [5].
4.0/).

Appl. Sci. 2022, 12, 2187. https://doi.org/10.3390/app12042187                                                https://www.mdpi.com/journal/applsci
Appl. Sci. 2022, 12, 2187                                                                                                2 of 11

                                  In 2002, California adopted a Renewables Portfolio Standard (RPS), which phases
                            in an increasing portion of energy generation that comes from carbon-free sources. The
                            current goals are to achieve a 60% carbon-free grid by 2030 and a completely carbon-free
                            grid by 2045 [6]. As the grid shifts to a Carbon neutral grid and as the state will presumably
                            experience intense wildfire seasons, the need to minimize stress on an already aged grid
                            may be necessary to limit the extent of wildfire devastation while maintaining a stable
                            power supply for the state’s residents. Since 2018, it has been agreed that the state’s grid
                            should be upgraded and modernized due to the fact that, by law, the state must achieve all
                            of its power by 2045 from renewable energy sources. The plan leading the Californian grid
                            to become carbon neutral in the long term, includes operating an energy imbalance market
                            and checking systems’ reliability, thus securing high renewable energy penetration. The
                            transmission system operator (TSO) is usually based on historical prices to reach relatively
                            accurate forecasting. The Californian grid often suffers from rather extensive wildfires
                            and other extreme events (natural disasters or other). It seems that due to climate change,
                            historical prices are no longer a good determinant of the future. Three main causes are
                            responsible for this:
                            -    unprecedented heat waves;
                            -    unplanned available storage capacity; and
                            -    unclear overview of actual supply and demand (especially in the evening hours).
                                  Since California has set the 2045 carbon neutral grid, the demand, production, and
                            operation patterns will not be the same. With spanning to multiple states and having
                            efficient communication with the other TSOs, California will be taking advantage of the
                            diversity of the resources on the western side of the country, hopefully avoiding pitfalls.
                            The plan is to follow a similar plan to the target model that prevails in Europe. Serious (and
                            emergency) demand response, such as the Flex Alert or other similar programs, are going
                            to serve and engage end-users more and more in the future. Furthermore, new storage
                            options, new fuels, and investments are going to be the compass for this change.
                                  This could, in part, be accomplished with small-scale wind and grid-tied battery stor-
                            age [7], but can it be done without storage [8]? In 2018, the California Energy Commission
                            stated that wind production capacity was about 6 GW and accounted for only 7.3% of the
                            state’s total power generation for that year, combined with very limited distributed storage
                            facilities [9]. On top of that, California’s housing values are notably higher than that of the
                            other 49 states (housing bubble). As of the end of April 2020, the median home price in the
                            state was $578,267, while the nationwide median home price was $248,857 (the question
                            that immediately comes to mind is “should overpriced homes crash”?). This creates an ele-
                            vated and possibly insurmountable capital cost for any projects that require large swathes
                            of terrestrial land [10,11]. As a result, the use of current infrastructure becomes necessary
                            in order to keep capital costs low. This includes grid-tied households and businesses, as
                            well as transmission hubs, where the supply is consolidated and dispersed to the grid.
                                  Presently, the two major Investor Owned Utilities (IOUs) in the state have instituted
                            mandatory grid shutdowns during weather events (red flag warnings) that cause a high
                            likelihood of wildfire [12]. Power is only restored after line crews have checked the affected
                            infrastructure for damage or contact with vegetation. This can take several additional days
                            after the weather event has passed. Red flag warnings are weather conditions that provide
                            higher than average temperature, low humidity, and high/driving sustained winds. These
                            conditions can persist for days or weeks and have in previous years left whole communities
                            and regions without power for longer. Each of California’s eleven geologic regions pose their
                            own challenges and special considerations when it comes to these mandatory shutdowns. The
                            native vegetation alone varies from region to region. The state is home to the Coastal Redwood
                            (Sequoia Sempervirens), the Giant Sequoia Redwood (Sequoiadendron Giganteum), Manzanita
                            shrub (Arctostaphylos manzanita), Lodge Pole Pine (Pinus Contorta), Douglas Fir (Pseudotsuga
                            menziesii), and several varieties of Oak tree, just to name a few. Each of these species has a range
                            in which they grow in the state and most have ranges where they intermingle and cohabitate.
                            The state’s electric grid must traverse all of these regions, landscapes, topographies, and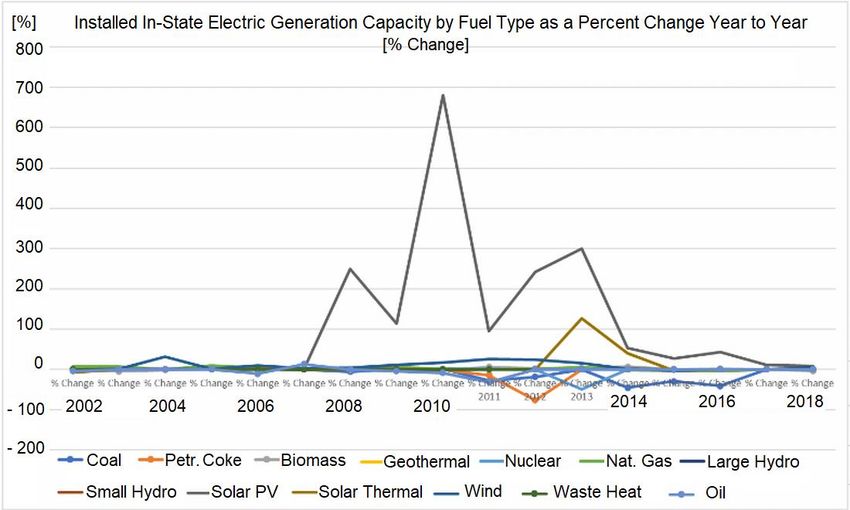
The state is home to the Coastal Redwood (Sequoia Sempervirens), the Giant Sequoia Red-
wood (Sequoiadendron Giganteum), Manzanita shrub (Arctostaphylos manzanita), Lodge Pole
Pine (Pinus Contorta), Douglas Fir (Pseudotsuga menziesii), and several varieties of Oak tree,
just to name a few. Each of these species has a range in which they grow in the state and
Appl. Sci. 2022, 12, 2187 3 of 11
most have ranges where they intermingle and cohabitate. The state’s electric grid must
traverse all of these regions, landscapes, topographies, and ecosystems in order to provide
a stable power supply to the
ecosystems spantoofprovide
in order California
a stableCommunities.
power supply to See Figure
the span 1 for the
of California current
Communities.
transmission network [13]. Note that the dark blue outline denotes the Pacific Gas and
See Figure 1 for the current transmission network [13]. Note that the dark blue outline denotes
Electric service area.
the Pacific Gas and Electric service area.
Figure 1. The current transmission network in California [14].
Figure 1. The current transmission network in California [14].
2. Literature Review
2. Literature Review
A number of published works have focused on the required infrastructure upgrade in
A number ofCalifornia
published works
State, as thehave
numberfocused
of windonandthe required
solar infrastructure
energy projects, EVs, andupgrade
hydrogenin stor-
California State, as
agethe number are
applications of wind and Based
increasing. solar energy projects,
on a technical reportEVs,
fromand hydrogen
the National stor-
Renewable
age applications are
Energyincreasing.
Laboratory Based onUS
(NREL), a technical
Department report fromreleased
of Energy, the National Renewable
in July 2009, attention is
Energy Laboratory (NREL), US Department of Energy, released in July 2009, attentionacross
particularly given to the use of wide-scale disbursement of wind energy production is
large balancing areas. Because of wind energy’s production variability, the integration
particularly givenoftowind
the energy
use ofinto
wide-scale disbursement of wind energy production across
larger balancing areas would mean that the variation in production
large balancing areas.
could beBecause
minimizedof wind energy’s
more easily when production
coupled with variability,
more sources the integration
of generation [15]. of
This
wind energy intoreasoning
larger balancing areas would
for regional-scale mean
control, that the
however, variation
did not in account
take into production could
the use of bat-
be minimized more teryeasily
storage to meet
when demand
coupled response.
with Nevertheless,
more sources it does make
of generation theThis
[15]. case reason-
for a large
distributed network of production for wind, so that when wind production decreases
ing for regional-scale control, however, did not take into account the use of battery storage
due to unfavorable weather conditions or maintenance, the remaining balance can be met
to meet demand by response.
the otherNevertheless,
production means it does make
within the case
the region. for a large
If battery storagedistributed net- to
is incorporated
work of production for wind,
capture so that when
excess production wind
and then beproduction decreases
remotely regulated due toresponse,
for demand unfavorable
then the
weather conditions orof
issue maintenance,
wide disbursementthe remaining balance
due to production can be met
variability by the
becomes lessother produc-
necessary and the
tion means within the region. If battery storage is incorporated to capture excess production
and then be remotely regulated for demand response, then the issue of wide disbursement
Appl. Sci. 2022, 12, 2187                                                                                            4 of 11

                            area of disbursement can be proportionally decreased to the quantity of available battery
                            capacity [16].
                                  The known report from the state of California’s Department of Housing and Commu-
                            nity Development discusses some of the housing issues facing the state. The recommenda-
                            tion made in the report was the construction of 180,000 homes annually through to 2025.
                            At the time the report was written, the state was constructing less than 80,000 new homes,
                            with the decreasing supply and increasing sprawl are two of the root causes of increasing
                            land values. However, this further emphasizes the need to use current infrastructure as the
                            cost of dedicated land will progressively increase when assuming a continued sprawl and
                            short housing supply in populated regions (where most of the demand will be located).
                            The report also notes a single-family housing stock of approximately 9 million statewide.
                            This leads to the assumption that there are homes in the state that could be retrofitted to
                            produce wind energy at the small or micro-scale and that production would not necessarily
                            be restricted to new construction [17].
                                  Research on microgeneration has started occupying more and more space in mature
                            urban solutions over the last decade [18,19]. Kakran and Chanana [20] discussed the
                            simulated use of energy management and balancing systems in individual homes alongside
                            a small-scale wind generation unit. In their study, the researchers placed constraints on
                            the system that required a stable power supply to the simulated homes, a sustained
                            level of comfort in the form of a sustained power supply sufficient to maintain a set of
                            predetermined modern household appliances. During the simulation, the wind energy
                            source was able to produce a sufficient amount of power to provide a net negative use for
                            the simulated homes. This excess power would be sent to the grid to provide additional
                            power where it may be needed. Further restrictions were placed on the simulated homes in
                            the form of rationed energy use during low-priced times. This effectively kept the demand
                            load from spiking during times of excess supply, making look-ahead forecasting more
                            predictable [21].
                                  Drawing a parallel to microgeneration, the importance of off-grid wind energy systems,
                            as well the parameter of the grid structure uniformity, are discussed in Lu et al. [22]. This
                            article discusses the practicality of how to effectively analyze the efficiency of an off-grid
                            wind system and the importance of examining the individual components of the whole
                            system for analysis. By emphasizing each individual component in an efficiency analysis,
                            the study showed the importance of a near-uniform structure when it comes to grid
                            components. The use of uniform components within a region will be important for grid
                            reliability, especially when trying to balance a demand load within a regional network.
                            Component turbines will need to be either uniform or listed and known so that a forecast
                            can be made for production and estimated downtime for maintenance and failure. The best
                            analogy for this would be the efficiency of a house or building constructed from multiple
                            material types, none of which is identical. If the parts of the system are not, at a minimum,
                            compatible and reliable, then the system itself becomes unpredictable and unreliable.
                                  Borunda et al. [23] give an example of small-scale wind turbines (SSWT) and their
                            process behind site selection based on a case in Mexico. These are defined in the article
                            as ranging from 5–10 kW in generation capacity and are intended to cover the demand
                            load of residential power usage in Mexico. The authors of this article utilize a Bayesian
                            Network as a means of determining the probability of a successful project site for the
                            SSWT [24]. The variables used in the decision-making model included the sustained wind
                            speeds of a given site, the capacity, class, and power curve of the turbine to be used, and
                            the residential tariff to be assessed in a given city or area [25]. The tariffs considered were
                            based on monthly use and were used to assess the probability of successfully lowering
                            energy costs if the SSWTs were constructed. This approach would need to alter slightly
                            if applied to the California grid, as utility ratepayers are charged for both monthly total
                            consumption and usage during low and high demand periods, commonly referred to as
                            “off-peak” and “on-peak” periods, respectively. However, this analysis could show a path
                            forward for how to determine the viability of small and micro-scale wind energy projects
National Oceanic and Atmospheric Administration (NOAA) ground/buoy monitoring
stations, National Climatic Data Center observations from the satellite constellation of the
Appl.Joint Polar
Sci. 2022, Satellite System (JPSS), Geostationary Operational Environmental Satellite Pro-5 of 11
12, 2187
gram (GOES), and the Polar Operational Environmental Satellite Program (POES). This
plethora of current and archived data could be used to carry out a similar Bayesian anal-
in California by using the readily available Meteorological Aerodrome Reports (METARs),
ysis of the state to determine an ideal site location. Other factors that would need to be
National Oceanic and Atmospheric Administration (NOAA) ground/buoy monitoring
included would be proximity to end-users,
stations, National Climatic nearest available
Data Center infrastructure,
observations compatibility
from the satellite constellation of
with nearby transmission networks,
the Joint and
Polar Satellite a common
System microsite Operational
(JPSS), Geostationary analysis estimating
Environmental wind
Satellite
energy yield potential [26]. Some of the issues and solutions to overproduction and cur-This
Program (GOES), and the Polar Operational Environmental Satellite Program (POES).
plethora of current and archived data could be used to carry out a similar Bayesian analysis
tailment of wind energy are also important. Examples provided were issues relating to
of the state to determine an ideal site location. Other factors that would need to be included
transmission congestion, wouldwhich resulted
be proximity in curtailments.
to end-users, A solution
nearest available provided
infrastructure, was with
compatibility to use
nearby
thermal or cold storage as secondary
transmission networks,useand[27]. This would
a common micrositelead to aestimating
analysis unified electric gridyield
wind energy
potential [26]. Some of the issues and solutions to overproduction and curtailment of
and heating and cooling network that minimizes the amount of energy wasted after gen-
wind energy are also important. Examples provided were issues relating to transmission
eration. By using the congestion,
excess energywhich generated for secondary
resulted in curtailments. usesprovided
A solution that serve
was tothe
uselocal pop-
thermal or cold
ulation, the overall efficiency of the project
storage as secondary use [27].and
Thisgeneration
would lead topoints
a unifiedcan be drastically
electric in- and
grid and heating
creased. This would be cooling network that
an important minimizes the amount
consideration of energy wasted
when planning after generation.
a statewide By using
small scale
the excess energy generated for secondary uses that serve the local population, the overall
power generation network [28-29].
efficiency of the project and generation points can be drastically increased. This would
be an important consideration when planning a statewide small scale power generation
3. Proposal and Analysis
network [28,29].
If California’s growth, with
3. Proposal andrespect
Analysisto supply and demand for power, continues at
their current rates, what Ifquantity ofgrowth,
California’s small and micro-scale
with respect to supplywind energy for
and demand with combined
power, continues at
battery storage wouldtheir
be current
needed to meet
rates, the needs
what quantity of a and
of small carbon neutral
micro-scale windgrid in 2045?
energy This
with combined
will treat wind energy production and battery storage as combined units, so that the en-This
battery storage would be needed to meet the needs of a carbon neutral grid in 2045?
will treat wind energy production and battery storage as combined units, so that the energy
ergy produced will be eitherwill
produced used immediately
be either on the
used immediately ongrid ororlater
the grid later stored
stored forfor demand
demand response.
response. Figure 2 (below),
Figure 2shows
(below),the dispersion
shows of generation
the dispersion of generation sources across
sources across the the
state.state.
Figure 2. California Energy Commission
Figure LayerCommission
2. California Energy displayed viadisplayed
Layer the JHUviaARCGIS onlineonline
the JHU ARCGIS application [29-
application [29–31].
31].
From 2014 to 2018, the California instate supply grew on average 0.63% year to year.
As of 2018, wind energy accounted for 7.48% of total capacity. If the state intends to keep
From 2014 to 2018, the California instate supply grew on average 0.63% year to year.
on track with the RPS, and achieve a carbon neutral grid by 2045, then the construction (on
As of 2018, wind energy accounted
public for 7.48%
infrastructure) of total capacity.
and incentivizing If of
the purchase the(onstate intends
private to keep
infrastructure) on and
small
track with the RPS, and achieve a carbon neutral grid by 2045, then the construction (on
micro-scale (Appl. Sci. 2022, 12, 2187 6 of 11
and at least 13 kWh charge capacity (based on Absorbent Glass Mat Battery banks assem-
bled by wholesalesolar.com (assessed: 1 November 2021) and the lithium battery based
Tesla Wall) will be used [32,33]. Approximate costs for each are estimated at $1600 and
$10,000, respectively, representing a minimalistic starting array that could be scaled up as
needed for residential, commercial, and utility structures. These aforementioned consumer
products were selected as standards because, at the time this paper was written, they were
the most readily available. This is not intended to be an endorsement of any given product
or company, merely an analysis of readily available products that could be placed into grid
service immediately. The technical specifications are likely to change for both components
as both technologies improve and gain more market penetration. This analysis will strictly
use these.
In the event of a fractured grid, a system such as this would be used to meet the
demand of individual homes and businesses in the interim until the grid could restabilize.
The emphasis on micro-scale wind turbines is used in this proposal as it allows for much
lower capital costs at the point of entry into the energy market and therefore potentially
encourages private citizens to use their own capital to improve the grid’s reliability by
implementing their own turbine systems. This would not necessarily be the case if the
emphasis was initially placed on small-scale turbines that may require too large of a
footprint to be viable for the average resident and ratepayer to access and utilize.
The areas most likely to be the most vulnerable to forced power outages will be
outlying communities with few transmission routes that are connected to the grid. Should
the state move forward with this proposal, the implementation process should focus on
those areas as they tend to have more isolated communities, rugged terrain, and a greater
likelihood of being susceptible to wildfire events, which would fracture the grid.
4. Results and Discussion
Using Equation (1) (below), the total amount of instate production can be estimated,
assuming that the growth rate of 0.63% remains constant year to year. The starting year
used will be 2018, as it is the latest data available from the California Independent Service
Operator [33–36]. The initial capacity used will therefore be 80,304 MW (80.304 GW). The
growth rate is applied once per year, and the number of years assessed will cover the
span from the start of 2018 to the end of 2045 (28 years). The average rate used (0.63%)
is calculated from the previous five years and will represent a conservative growth of
instate supply capacity. This leads to an estimated instate supply capacity of 95,742 MW
(95.742 GW) in 2045. In terms of the growth of infrastructure, the state would need to bring
approximately 551 MW of capacity online each year until 2045.
r nt
A = P 1+ (1)
n
where
• A = principal amount at time t;
• P = initial amount;
• r = rate of change (growth);
• n = number of times r is applied per unit t;
• t = number of years assessed.
In 2018, wind energy accounted for 7.48% (6004 MW) of the total instate capacity
(80,304 MW). If wind is to keep its market share moving forward, then capacity will need
to increase by 41.24 MW each year until 2045. In terms of small and micro-scale wind
energy for residential and small business applications, this means 3683 turbines at 400 W
and 369 4 kW grid-tied battery banks will need to be brought online each year. The cost
of hardware alone would be $165 and $103 Million (respectively) over 28 years. Only in
2020, it was announced that Sidewalk Infrastructure Partners (SIP) would invest (once)
$100 Million in order for the Californian Grid to be upgraded [37].x FOR PEER REVIEW 7 of 11
Appl. Sci. 2022, 12, 2187 7 of 11
the future demand. These costs would amount to $2.2 and $1.4 Billion, respectively, over
the 28-year period. If micro-scale wind energy were to account for the entire net difference between
If the 17-year2018
average rate of growth
and estimated for generation
2045 capacities (15.44 GW),capacity
then theisinstate
used generation
(2.23% forwouldthe years
need to
construct and install 49,232 wind turbines at 400W and 4924
2002 to 2018), then the net production capacity difference between 2018 and 2045 becomes 4 kW batteries in order to meet
the future demand. These costs would amount to $2.2 and $1.4 Billion, respectively, over
68.61 GW. This would require a much larger and drastic implementation of over 16,000 tur-
the 28-year period.
bines at 400 W and 1600 4 kW
If the batteries
17-year averageperrateyear in order
of growth to keep the
for generation 7.48%ismarket
capacity share.
used (2.23% forIfthe
required to fulfillyears
the entire
2002 todifference
2018), thenof thethe
net28-year
productiongain, micro-scale
capacity difference wind energy
between 2018would
and 2045
need to increase bybecomes
218,778 68.61 GW. This
turbines would
at 400 Wrequire a much
and 21,878 kW larger and drastic
batteries implementation
per year of over
for 28 consec-
16,000 turbines at 400 W and 1600 4 kW batteries per year in order to keep the 7.48% market
utive years.
share. If required to fulfill the entire difference of the 28-year gain, micro-scale wind energy
On the otherwould
hand, NREL
need has estimated
to increase only forat“greening”
by 218,778 turbines 400 W and 21,878 100% kWLos Angeles
batteries thefor
per year
costs somewhere28between
consecutive $57 billion and $87 billion [38], excluding practically micro-
years.
On the
scale wind energy [38]. The variousother hand,studies
NREL has estimated
focus only for “greening”
on greening the cities 100% Los Angeles
and not and thethe
accompanying demandcosts somewhere
without between
focusing$57 onbillion and $87 billion
the independent [38], excluding
end-user needs practically
to meet theirmicro-
scale wind energy [38]. The various studies focus on greening the cities and not and the
demand. Therefore, supporting a whole grid and all the infrastructure is, of course, much
accompanying demand without focusing on the independent end-user needs to meet their
more costly and expensive.
demand. Therefore, supporting a whole grid and all the infrastructure is, of course, much
The 2.23% increase includes
more costly 5 years where Solar PV increased at yearly rates between
and expensive.
The 2.23% increase
114 and 680% (See Figures 3 and 4). Solar includes 5 years
PV’s whereover
growth Solarthe
PV increased at yearly rates
17-year timespan wasbetween
an
114 and 680% (See Figures 3 and 4). Solar PV’s growth over the 17-year timespan was an
outlier of 107.43%. This calculation was not carried out and used with the 17-year average
outlier of 107.43%. This calculation was not carried out and used with the 17-year average
growth rate due to the Solar
growth rate due PVtorate over PV
the Solar therate
same overperiod
the same of time.
periodWhenof time.Solar
When PV is ex-
Solar PV is
cluded from the growth
excludedratefromcalculation,
the growth rate the 17-year growth
calculation, the 17-yearrate is 0.11%.
growth rate is 0.11%.
Figure 3. California’s capacity by yearly percentage change.
Figure 3. California’s capacity by yearly percentage change.FOR PEER REVIEW
Appl. Sci. 2022, 12, 2187 8 of 118 of 11
Figure 4. California’sFigure
capacity by fuel type.
4. California’s capacity by fuel type.
As of 2018, over 50% As of
of the
2018,state’s
over 50% of the state’s
generation generation
capacity camecapacity came from
from natural gasnatural
(See Fig-gas (See
ures 3 and 4, above). This presents a significant challenge when it comes to pushing the grid the
Figures 3 and 4, above). This presents a significant challenge when it comes to pushing
grid towards carbon and greenhouse gas neutrality. Natural gas generation is primarily used to
towards carbon andmeet greenhouse gas neutrality. Natural gas generation is primarily used to
peak load as combined cycle plants are easily ramped up and down to meet the demand
meet peak load as combined
curve duringcycle plantsAnare
peak hours. easily
ideal ramped
replacement up and
would down
be excess to meetduring
production the de-off-peak
mand curve duringhours peakthat
hours. Antoideal
is stored replacement
meet demand responsewould
later inbe
theexcess production
day. This during to
could be accomplished,
off-peak hours thatvarying
is storeddegrees, at utility
to meet and small-scale
demand response operations.
later inHowever,
the day.whenThisdealing
couldwith demand
be ac-
response storage, capable infrastructure will need to be taken into account and potentially
complished, to varying degrees, at utility and small-scale operations. However, when deal-
constructed or improved so that transmission congestion is minimized.
ing with demand response Therestorage, capable
are various plansinfrastructure
that are focusing will
onneed to bevarious
greening takenUS into account
states, however,
and potentially constructed or improved
it is the Californian stateso that
that transmission
is prioritized congestion
to turn the Golden is minimized.
State green since, in a
number
There are various plansof that
studies,
are California
focusing is onoften referred
greening as an environmental
various US states, however, savior towards
it is a
the Californian state that is prioritized to turn the Golden State green since, in a number aofglobal
greener future. California’s ambitious climate policy operation has cast the state as
leader on climate change in the USA. Therefore, an alternative approach to achieving
studies, California is often referred
California’s as an environmental
environmental saviorsuch
goals in various ways, towards a greener
as for instance, future.fewer
importing
California’s ambitious climate policy
carbon-intensive operation
products, has
is giving cast the
a signal state
as well as rest
to the a global leader on
of the country. cli- a
Therefore,
mate change in the wind
USA.microgeneration
Therefore, anproposalalternative
couldapproach to achieving
ignite an alternative way of California’s
thinking to all envi-
the other
US states.
ronmental goals in various ways, such as for instance, importing fewer carbon-intensive
products, is giving a5.signal as well to the rest of the country. Therefore, a wind microgener-
Conclusions
ation proposal could ignite an alternative
The use of micro and,way of thinking
possibly, to all
small-scale windthegeneration
other US coupled
states. with battery
storage for meeting the State of California RPS goal of a carbon neutral grid by 2045 is
5. Conclusions possible. By distributing the power generation infrastructure, the risk associated with
natural disasters can be minimized as said natural disasters are typically confined to small
The use of micro and, possibly,
geographic segments ofsmall-scale wind
the state. If small generation
portions coupled network
of the distributed with battery
are affected,
storage for meetingthen
thethe
State of California
remainder RPS
can be used goaldemand,
to meet of a carbon neutral
or usage grid by 2045
can be constrained is
to essential
possible. By distributing the power
infrastructure generation
by regional infrastructure,
balancing hubs [39]. Thisthe
willrisk associated
be important withforward
moving nat- as
ural disasters can be minimized as said natural disasters are typically confined to small as a
California’s wildfire seasons and overall activity increase in severity and frequency
result of climate change [40]. The most vulnerable communities may very well be the most
geographic segments of the state. If small portions of the distributed network are affected,
then the remainder can be used to meet demand, or usage can be constrained to essential
infrastructure by regional balancing hubs [39]. This will be important moving forward as
California’s wildfire seasons and overall activity increase in severity and frequency as aAppl. Sci. 2022, 12, 2187 9 of 11
viable as they reside on or around the wildland–urban interface. Further analysis will be
needed to determine specific locations for ideal generation and energy storage [41].
This proposal focuses on wind generation with grid-tied battery storage on-site or
nearby to the site of generation. Calculations are based on current costs for micro-scale
wind turbines and battery storage systems that are currently available to the residents
and small businesses of California. It assumes that the costs of these components will not
change over the course of the time assessed (28 years) and that more efficient means of
energy production or storage will not come online during that period of time.
At this time, the best example of how a transition from natural gas to utility-scale
batteries at the Moss Landing Natural Gas power plant in Moss Landing, California. This
is currently a joint venture between Pacific Gas and Electric (PG&E) and the Tesla Motor
company and will result in the construction and installation of a Tesla MegaPack at the
PG&E plant. When coupled with carbon neutral power production, these systems can
become the next generation of “peaker plants” that are used to quickly ramp up and down
to meet on-peak demand [42].
Moving forward, a few additional analyses could be undertaken to help see this
proposal (or one similar) come to fruition. The first and foremost would be an analysis
that quantifies the characteristics of ideal locations for storage and generation. These
characteristics may include local topography (to assess issues with maintaining associated
transmission lines), weather patterns (to quantify potential productivity and the likelihood
of red flag warnings), proximity to established grid infrastructure (to quantify capital costs
needed to connect to major segments of the grid), nearby population density (to assess
whether a future demand load may or may not overwhelm a future supply of a given
region or site), and proximity to major highways (to quantify possible costs of construction
and maintenance).
Author Contributions: Conceptualization, G.N.; validation, G.X.; formal analysis, G.N.; resources,
G.X.; data curation, G.N.; writing—original draft preparation, G.N.; writing—review and editing,
G.X.; visualization, G.N. and G.X.; supervision, G.X.; project administration, G.X. All authors have
read and agreed to the published version of the manuscript.
Funding: This research received no external funding.
Institutional Review Board Statement: Not applicable.
Informed Consent Statement: Not applicable.
Data Availability Statement: The study did not report any data.
Conflicts of Interest: The authors declare no conflict of interest.
References
1. Franklin, C.E.; Hoppeler, H.H. Elucidating mechanism is important in forecasting the impact of a changing world on species
survival. J. Exp. Biol. 2021, 224, jeb242284. [CrossRef] [PubMed]
2. Schwarz, L.; Malig, B.; Guzman-Morales, J.; Guirguis, K.; Ilango, S.D.; Sheridan, P.; Benmarhnia, T. The health burden fall, winter
and spring extreme heat events in the in Southern California and contribution of Santa Ana Winds. Environ. Res. Lett. 2020, 15,
054017. [CrossRef]
3. Pidcock, R. Analysis: What Global CO2 Emissions in 2016 Mean for Climate Change Goals. Carbon Brief. 2016. Available online:
https://www.carbonbrief.org/what-global-co2-emissions-2016-mean-climate-change (accessed on 8 November 2020).
4. Wu, G.C.; Leslie, E.; Sawyerr, O.; Cameron, D.R.; Brand, E.; Cohen, B.; Olson, A. Low-impact land use pathways to deep
decarbonization of electricity. Environ. Res. Lett. 2020, 15, 074044. [CrossRef]
5. Schulte-Peevers, A. California, 8th ed.; Lonely Planet: Footscray, VIC, Australia, 2018.
6. Koseff, A. California Approves Goal for 100% Carbon-Free Electricity by 2045; The Sacramento Bee: Sacramento, CA, USA, 2018; p. 10.
7. Arbabzadeh, M.; Sioshansi, R.; Johnson, J.X.; Keoleian, G.A. The role of energy storage in deep decarbonization of electricity
production. Nat. Commun. 2019, 10, 1–11. [CrossRef] [PubMed]
8. Cammardella, N.; Mathias, J.; Kiener, M.; Bušić, A.; Meyn, S. Balancing California’s grid without batteries. In 2018 IEEE Conference
on Decision and Control (CDC); IEEE: New York, NY, USA, 2018; pp. 7314–7321.
9. California Energy Commission. Electric Generation Capacity. 2019. Available online: https://ww2.energy.ca.gov/almanac/
electricity_data/electric_generation_capacity.html (accessed on 21 November 2021).Appl. Sci. 2022, 12, 2187 10 of 11
10. California Home Prices & Values. 2020. Available online: https://www.zillow.com/ca/home-values/ (accessed on 1 November
2021).
11. Im, J.; Seo, Y.; Cetin, K.S.; Singh, J. Energy efficiency in US residential rental housing: Adoption rates and impact on rent. Appl.
Energy 2017, 205, 1021–1033. [CrossRef]
12. Abatzoglou, J.T.; Smith, C.M.; Swain, D.L.; Ptak, T.; Kolden, C.A. Population exposure to pre-emptive de-energization aimed at
averting wildfires in Northern California. Environ. Res. Lett. 2020, 15, 094046. [CrossRef]
13. Harvey, C.J.; Garfield, N.; Williams, G.D.; Tolimieri, N.; Schroeder, I.; Andrews, K.S.; Zeman, S. Ecosystem status report of the
california current for 2019: A summary of ecosystem indicators compiled by the california current integrated ecosystem assessment team
(CCIEA); NOAA technical memorandum NMFS-NWFSC: Silver Spring, MD, USA, 2019.
14. PG&E Economic Development Site Tool. 2021. Available online: https://www.pge.com/en_US/large-business/services/
economic-development/opportunities/sitetool.page (accessed on 24 January 2021).
15. US Department of Energy. Small-Wind-Guidebook. 2012. Available online: https://windexchange.energy.gov/small-wind-
guidebook (accessed on 2 November 2021).
16. Milligan, R. Drive cycles for battery electric vehicles and their fleet management. In Electric Vehicles: Prospects and Challenges;
Elsevier: Amsterdam, The Netherlands, 2017; pp. 489–555.
17. Infill Housing Key to California’s Future (2017). Washington: Hanley-Wood, Incorporated. Available online: https://search.
proquest.com/docview/1939232710 (accessed on 21 October 2021).
18. Xydis, G.; Liaros, S.; Avgoustaki, D.D. Small scale plant factories with artificial lighting and wind energy microgeneration: A
multiple revenue stream approach. J. Clean. Prod. 2020, 255, 120227. [CrossRef]
19. Pinheiro, E.; Bandeiras, F.; Gomes, M.; Coelho, P.; Fernandes, J. Performance analysis of wind generators and PV systems in
industrial small-scale applications. Renew. Sustain. Energy Rev. 2019, 110, 392–401. [CrossRef]
20. Kakran, S.; Chanana, S. An energy scheduling method for multiple users of residential community connected to the grid and
wind energy source. Build. Serv. Eng. Res. Technol. 2018, 39, 295–309. [CrossRef]
21. Karabiber, O.A.; Xydis, G. Electricity price forecasting in Danish day-ahead market using TBATS, ANN and ARIMA methods.
Energies 2019, 12, 928. [CrossRef]
22. Lu, H.W.; Pan, H.Y.; He, L.; Zhang, J.Q. Importance analysis of off-grid wind power generation systems. Renew. Sustain. Energy
Rev. 2016, 60, 999–1007. [CrossRef]
23. Borunda, M.; de la Cruz, J.; Garduno-Ramirez, R.; Nicholson, A. Technical assessment of small-scale wind power for residential
use in mexico: A bayesian intelligence approach. PLoS ONE 2020, 15, e0230122. [CrossRef] [PubMed]
24. Nasiri-Zarandi, R.; Ghaheri, A.; Abbaszadeh, K. Thermal modeling and analysis of a novel transverse flux HAPM generator for
small-scale wind turbine application. IEEE Trans. Energy Conv. 2020, 35, 445–453. [CrossRef]
25. Rocha, L.C.; Aquila, G.; Junior, P.R.; de Paiva, A.P.; de Oliveira Pamplona, E.; Balestrassi, P. A stochastic economic viability
analysis of residential wind power generation in Brazil. Renew. Sustain. Energy Rev. 2018, 90, 412–419. [CrossRef]
26. Panagiotidou, M.; Xydis, G.; Koroneos, C. Environmental siting framework for wind farms: A case study in the Dodecanese
Islands. Resources 2016, 5, 24. [CrossRef]
27. Xydis, G. Wind energy to thermal and cold storage—A systems approach. Energy Build. 2013, 56, 41–47. [CrossRef]
28. Xydis, G.; Mihet-Popa, L. Wind energy integration via residential appliances. Energy Eff. 2017, 10, 319–329. [CrossRef]
29. California Energy Commission. CEC Electricity from Wind Energy Statistics and Data. 2020. Available online: https://ww2
.energy.ca.gov/almanac/renewables_data/wind/index_cms.php (accessed on 21 October 2021).
30. California Energy Commission. Energy Alamanac. 2020. Available online: https://www.energy.ca.gov/data-reports/energy-
almanac (accessed on 2 October 2021).
31. Wholesalesolar.com. AC Coupled Backup Power System with 4 kW Outback Inverter Battery Backup System. 2020. Available
online: https://www.wholesalesolar.com/1894105/wholesale-solar/back-up-power/ac-coupled-backup-power-system-with-
4kw-outback-inverter-battery-backup-system (accessed on 1 October 2021).
32. Cortez, F. Tesla Battery Power Plant Approved in Moss Landing. 2020. Available online: https://www.ksbw.com/article/tesla-
battery-power-plant-approved-in-moss-landing/31124086# (accessed on 6 December 2021).
33. CAISO. CAISO Monthly Renewables Performance Report. 2020. Available online: http://www.caiso.com/Documents/
MonthlyRenewablesPerformanceReport-Mar2020.html (accessed on 21 November 2021).
34. CAISO. CAISO Today’s Outlook—Supply. 2020. Available online: http://www.caiso.com/TodaysOutlook/Pages/supply.aspx
(accessed on 2 November 2021).
35. CAISO. Managing Oversupply. 2020. Available online: http://www.caiso.com/informed/Pages/ManagingOversupply.aspx
(accessed on 2 November 2021).
36. CAISO. Storage Technologies Provide Flexible Resources in the Market. 2020. Available online: http://www.caiso.com/
participate/Pages/Storage/Default.aspx (accessed on 2 November 2021).
37. Sidewalk Infrastructure Partners. SIP Invests $100M to Make California’s Grid More Resilient via 550-MW VPP. 2020. Available
online: https://www.power-grid.com/smart-grid/sip-invests-100m-to-make-californias-grid-more-resilient-via-550-mw-vpp/
#gref (accessed on 6 January 2022).
38. NREL. LA100: The Los Angeles 100% Renewable Energy Study. 2021. Available online: https://www.nrel.gov/docs/fy21osti/79
444-ES.pdf (accessed on 6 December 2021).Appl. Sci. 2022, 12, 2187 11 of 11
39. Panagiotidis, P.; Effraimis, A.; Xydis, G.A. An R-based forecasting approach for efficient demand response strategies in au-
tonomous micro-grids. Energy Environ. 2019, 30, 63–80. [CrossRef]
40. Williams, A.P.; Abatzoglou, J.T.; Gershunov, A.; Guzman-Morales, J.; Bishop, D.A.; Balch, J.K.; Lettenmaier, D.P. Observed impacts
of anthropogenic climate change on wildfire in California. Earth’s Future 2019, 7, 892–910. [CrossRef]
41. Ossenbrink, J.; Finnsson, S.; Bening, C.R.; Hoffmann, V.H. Delineating policy mixes: Contrasting top-down and bottom-up
approaches to the case of energy-storage policy in California. Res. Policy 2019, 48, 103582. [CrossRef]
42. Sioshansi, F. The evolution of California’s variable renewable generation. In Variable Generation, Flexible Demand; Academic Press:
Cambridge, MA, USA, 2021; pp. 3–24.You can also read


