India-Macro Headwinds, Still a Preferred Investment Destination - Anand Singh, Head (Sales), Prime Brokerage, Edelweiss Financial Services Ltd ...
←
→
Page content transcription
If your browser does not render page correctly, please read the page content below

India- Macro Headwinds, Still a Preferred Investment Destination

  Anand Singh, Head (Sales), Prime Brokerage, Edelweiss Financial Services Ltd, India

SGX The Asian Gateway

Despite the slowdown, India has still managed to grow above par & figures amongst top 15
nations in terms of GDP at constant price
Eleventh Largest in the world by Nominal GDP
Third Largest by Purchasing Power Parity (PPP)
Second fastest growing economy after China
India ranks 42nd in the World Economic Forum’s
Global Competitiveness Index for 2011, ahead of Russia
& South Africa.
Attractive destination for business & investments,
huge manpower base of 1.3 Billion people, diversified
natural resources & strong socio-economic culture
Goldman Sachs predicts India to be the second largest
economy in the world by 2050 after China.
SGX The Asian Gateway 1
Among emerging markets, India is next only to China with respect to share in world GDP
  Share in world GDP (PPP),2011

                                                 Goldman pegs India economy to be second largest by 2050, second
  .. and it has been increasing steadily         to China

SGX The Asian Gateway                                                                                        2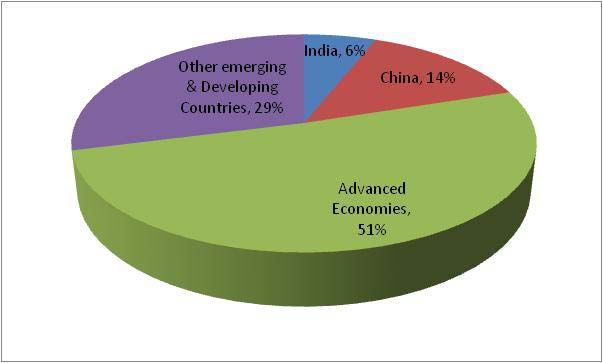
Savings & Investments rates are among highest in the world

   SGX The Asian Gateway

Savings led, domestic consumption driven economy

SGX The Asian Gateway                              4
Among emerging markets, India has one of the most favorable tax regimes, a very crucial factor
for attracting foreign investment
The GAAR Effect – Although investments & business sentiment have taken a hit due to the uncertainty surrounding the
introduction of GAAR in Budget 2012, the new FM is likely to defer it by 3 years to FY 17, as per the recommendations of the Shome
committee.
India has comprehensive Double Tax Avoidance Agreements (DTAAs) with as many as 79 countries in the world. Mauritius still being
the preferred route for India-bound investments, both into public & private markets, followed by Cyprus, Cayman, Singapore amongst
others.
SGX The Asian Gateway 5Well developed financial markets
In terms of financial market development India ranks much better than most EMs
Source- World Economic Forum- Global Competitiveness Report 2011-2012
SGX The Asian Gateway 6High yielding equity market
USD 100 invested in Dec 2001 would have yielded USD 325 by July 2011 !
SGX The Asian Gateway 7FIIs flows continue to be strong
•2012 Data is up to 31st August 2012 Source- SEBI
• Figure in USD Million
SGX The Asian Gateway 8Key Challenges to Growth
While on a relative basis, inflation
25% has moved from high and volatile …to lower levels over the
levels of 60s and 70s… last 10 years
Inflation
20% …on an absolute basis,
inflation levels of close to
10% are still quite high
15%
10%
5%
0%
FY12
FY54
FY57
FY60
FY63
FY66
FY69
FY72
FY75
FY78
FY81
FY84
FY87
FY90
FY93
FY96
FY99
FY02
FY05
FY08
FY11
-5%
-10%
In response, the Indian central bank has raised rates 12 times in
the last 21 months, which has slowed down growth
SGX The Asian Gateway 9Continued..
Currency devaluation is a prominent threat to overall growth. Rupee touched life lows and is still stubbornly
Rupee Devaluation trading at close to 56/$. This has resulted in higher import bill, BOP problems, lesser realization for Indian
exports, chances of FCCB defaults by Corporates & inflation.
SGX The Asian Gateway 10Continued… Regulatory Arbitrariness • Introduction of General Anti Avoidance Rule (GAAR) – Investor sentiment took a hit, especially on funds coming from Mauritius as India threatened to retrospectively tax Investments that that took tax benefit & failed to establish commercial substance. However the recent recommendations by the Shome committee has proposed to defer it by FY 2017. We hope the sentiments to get better post new FM taking Office. • Federal policy has been unclear/slow in certain sectors - Retail - Insurance - Land & Labour reforms • Implementation of reforms has slowed down in sector like - Infrastructure - Education • Slow at privatizing some sectors like Defence, etc. SGX The Asian Gateway 11
All is not over yet… Despite Macro level Challenges, India still is attractive from a long term perspective given the scope of improvement in Federal & Corporate governance. Followings are the positives- India’s core domestic consumption growth continues to growth at a decent pace, though has come off from the highs, but still better than other developed markets in the world Inflation & interest rate have started beginning to peak out. India is expected to return to core growth of over 6.5% & more The new FM promises to significantly improve business & investment sentiment. Few steps taken in that direction is the proposed deferment of GAAR by FY 17 & recommendation to abolish the Capital gains, to be offset by a marginal increase in STT Indian Corporates, despite the slowdown, have managed to grow at a decent pace, thanks to the inherent nature of domestic consumption, thereby reducing overseas dependence. Despite the slowdown, Foreign Direct Investments is at a record high. Big ticket investments into hospitality, infrastructure & reality are at a high. High interest rates have attracted huge NRE deposits which have, to some extent, offset the FII outflow. Ceiling raised for FII investments in Government & Corporate Bonds, thus attracting long term sustainable money in Debt. SGX The Asian Gateway 12
Changing electoral mindset.. Promises
   1990 – 1995
                                            a better & Prosperous India
                                       1995 – 2005                                        2005 - Present

   Politics of Heart                           The Lost Decade                            Politics of Mind

   Communal Politics                           Anti-incumbency                            Reward performance

 Electoral Mindset                             Electoral Mindset                         Electoral Mindset
 “Only a leader from my                        “The incumbent leader is no               “I will elect those who deliver
 community will take care of my                good, maybe the new one will              performance”
 needs”                                        be better”

                                               The two mindsets were unaligned with
          The two mindsets were aligned to
                                               each other, with citizens seeking        The two mindsets are aligned to each
          each other but both were unaligned
                                               performance and politicians delivering   other and also to development &
          to development & performance
                                               communal linkages                        performance

 Political Mindset                             Political Mindset
                                                                                         Political Mindset
 “Development is not getting                   “Focus on the short term as
                                                                                         “Development is key to political
 rewarded, hence align with                    every election would result in
                                                                                         success”
 citizens’ hearts, and not minds”              defeat of the ruling party”

SGX The Asian Gateway                                                                                                          13
Thanks SGX The Asian Gateway 14
Application of SGX Nifty futures
Geoff Howie
Markets Strategist
13 September 2012

SGX The Asian Gateway
SGX Product Application
As the Asian Gateway, SGX products provide access to a wide span of Asian
markets to global participants.
The range of Asian index futures offered for trading on SGX enable investors to
execute views based on one part of Asia or multiple parts of Asia.
As demonstrated in the following examples, application can be based on relative
performance or mean reversion of two Asian indices based on economic
fundamentals or quantitative observations.
The two Index futures covered S&P CNX Nifty, MSCI Taiwan are all USD based,
while the ishares MSCI India ETF is also USD based which mitigates against
embedded currency risks.
SGX The Asian Gateway 16Index Introductions
The S&P CNX Nifty Index captures the price performance of a market capitalisation weighted
index that comprises 50 component stocks representing 53.75% of the total market
capitalisation of the Indian bourse.
– The top 3 sectors of the Index are similar to that of MSCI India Index with Financials (26%), Information
Technology (14%) and Energy (13%).
The MSCI Taiwan Index is a free-float adjusted market capitalisation weighted index designed
to capture the equity market performance of Taiwanese securities listed on the Taiwan Stock
Exchange and the GreTai Securities Market.
– Composed of 114 constituents; largest sectors Information Technology (54.94%) and Financials
(15.04%). Note Taiwan Semiconductor Manufacturing Company Limited (18.02%), Hon Hai Precision
Industry Co Ltd (7.97%).
The ishares MSCI India ETF consists of approximately 70 stock holdings that are weighted to
track the MSCI India Index and a relative small amount of cash and cash equivalents. This
method of ETF construction is referred to as representative sampling. In this particular case,
the ETF invests indirectly into the Indian market through a wholly owned subsidiary
incorporated in Mauritius.
– The top 3 sectors of the MSCI India Index are Financials (26%), Information Technology (17%) and Energy (12%),
together accounting for 55% of the total index.
SGX The Asian Gateway 17Contract Notional Values
Index Last Price Contract Notional YTD 2011
06 Sep 2012 Value Value Change INDEX Change
MSCI Indonesia 4875 US$2 US$9,750 -18.5%
MSCI Taiwan 263.2 US$100 $263.2 +3.8% -20.4%
Nikkei 225 8,690 ¥500 ¥4,345,000 -15.4%
S&P CNX Nifty 5,270 US$2 US$10,540 +13.9% -24.6%
FTSE China A50 7,040 US$1 US$7,040 -5.1% -15.0%
MSCI Singapore 342.5 SG$200 S$68,500 +14.0% -20.0%
Contract Delta Ratio
Inter-Commodity Margins Credit Delta Spread Ratio
Spread Rate
Initial Maint.
Nifty vs MSCI Taiwan US$1,500 US$1,200 0.50 3 Nifty vs 1 MSCI Taiwan
SGX The Asian Gateway 18Relative Value
Price Ratio: SGX Nifty Futures / SGX MSCI Taiwan Futures
21.5
21
20.5
20 Nifty Futures
outperformance
19.5
19
Nifty Futures
18.5
underperformance
IH1 Index / TW1 Index
18
Sep-11 Oct-11 Nov-11 Dec-11 Jan-12 Feb-12 Mar-12 Apr-12 May-12 Jun-12 Jul-12 Aug-12 Sep-12
SGX The Asian Gateway 19Example 1: Buy 3 Nifty & Sell 1 MSCI Taiwan in July 2012
21.5 Outperformance of India versus Taiwan:
21
02 Jul Bought 3 Nifty Futures @ 5290.0
Sold 1 MSCI Taiwan @ 254.0
20.5
Notional Values = US$31,740/US$25,400
20
Price Ratio = 20.83
19.5
13 Jul Sold 3 Nifty Futures @ 5242
Bought 1 MSCI Taiwan @ 249.4
19
Notional Values = US$31,452/US$24,940
18.5
Price Ratio = 21.02
18
Return = (US$288)+US$460=US$172
Please note transaction costs not taken into account.
Past results do not guarantee future results
Trading involves potential for returns and losses
SGX The Asian Gateway 20Nifty Index vs MSCI India
5700 740
720
5500
700
5300
680
5100 660
640
4900
620
4700
600
4500 580
Sep-11 Oct-11 Nov-11 Dec-11 Jan-12 Feb-12 Mar-12 Apr-12 May-12 Jun-12 Jul-12 Aug-12 Sep-12
NIFTYS Index (L1) MXIN Index (R1)
SGX The Asian Gateway 21Arbitrage & Mean Reversion
Price Ratio: SGX Nifty Futures/ ishares MSCI India ETF Mean Reversion
990
Mean reversion is a pair trading strategy that
is based on the expectation that the two
980 futures contracts, in this case the SGX Nifty
5351.5/5.58 = 959.05 futures Index and ishares MSCI India ETF,
970 will revert to the mean price ratio based on
historical prices.
960
The risk associated with this strategy is that
950 a change in significant fundamentals can
negate the previous reversion relationship.
940
When the current ratio is above the historical
930 mean, assuming market fundamentals
remain in check, the mean reversion
920 strategy is to structure a trade that provides
returns with the ratio falling back to the
910 mean.
900 When the current ratio is below the historical
mean, and again, assuming market
890 fundamentals remain in check, the mean
02-Jul 09-Jul 16-Jul 23-Jul 30-Jul 06-Aug 13-Aug 20-Aug 27-Aug 03-Sep reversion strategy is to structure a trade that
provides returns with the ratio rising back to
IH1 Index / INDIA SP Equity MEAN the mean.
SGX The Asian Gateway 22Example 2: Sell 6 Nifty & Buy 12 lots ishares MSCI India ETF
990
15 Aug Price Ratio = 982.27 and Mean = 939.60
980
Sold 6 Nifty Futures @ 5402.5
970
Bought 12 ishares MSCI India ETF @ 5.50
960 Notional Values = US$64,830/US$66,000
950
940
27 Aug Price Ratio = 955.87 and Mean = 945.32
930
Bought 6 Nifty Futures @ 5372
920 Sold 12 ishares MSCI India ETF @ 5.62
Notional Values = US$64,464/US$67,440
IH1 Index / INDIA SP Equity MEAN
Return = US$366+US$1,440=US$1,806
Please note transaction costs not taken into account.
Past results do not guarantee future results
Trading involves potential for returns and losses
SGX The Asian Gateway 23Nifty Options
SGX S&P CNX Nifty Index Puts and Calls have a US$2 .00 multiplier and follow the
same settlement as the SGX S&P CNX Nifty Index futures. At a price of 100.0
points, the notional value of an Sep 5200 call option with a Sep 2012 expiry would
be USD$200.
Nifty options provide an access market that provides a cost efficient alternative to
investing in the onshore market. For that reason, the market will price in the
application that Nifty Call options have to investors looking for an alternative market
to capture the performances of the Indian stock market.
An equity investor has an access advantage from trading the offshore SGX S&P
CNX Nifty Index. This access advantage can also be priced into options, resulting in
a smirk in the implied volatility curve, implying that in-the-money calls are generally
more expensive than out-of-the-money calls.
SGX The Asian Gateway 24Investment channels across Developing Asia
Region IMF 2013 GDP
Growth Estimate
China (July 2012)
ADRs
ETFs World 3.9%
Futures Advanced Economies 1.9%
Stocks
REITs NIE Asia 4.2%
India
ETFs Developing Asia 7.5%
Futures
Stocks China 8.5%
ASEAN Indonesia
ETFs Malaysia
Futures Philippines 6.1%
Stocks Thailand
REITs Vietnam
India 6.5%
SGX The Asian Gateway 25Thank you
Singapore Exchange • London • Tokyo • Beijing
2 Shenton Way, #19-00 SGX Centre 1, Singapore 068804
Main: (65) 6236 8888 Fax: (65) 6535 6994
This presentation is not intended for distribution to, or for use by or to be acted on by any person or entity located in any jurisdiction where such distribution, use or action would be contrary to applicable laws or
regulations or would subject SGX to any registration or licensing requirement.
This presentation is not an offer or solicitation to buy or sell, nor financial advice or recommendation for any investment product. This presentation is for general circulation only. It does not address the specific
investment objectives, financial situation or particular needs of any person. Advice should be sought from a financial adviser regarding the suitability of any investment product before investing or adopting any
investment strategies. Further information on investment products may be obtained from www.sgx.com.
Investment products are subject to significant investment risks, including the possible loss of the principal amount invested. Past performance of investment products is not indicative of their future performance.
Examples provided are for illustrative purposes only.
While SGX and its affiliates have taken reasonable care to ensure the accuracy and completeness of the information provided in this presentation, they will not be liable for any loss or damage of any kind (whether
direct, indirect or consequential losses or other economic loss of any kind) suffered due to any omission, error, inaccuracy, incompleteness, or otherwise, any reliance on such information. Neither SGX nor any of
its affiliates shall be liable for the content of information provided by or quoted from third parties.
SGX and its affiliates may deal in investment products in the usual course of their business, and may be on the opposite side of any trades.
SGX is an exempt financial adviser under the Financial Advisers Act (Cap. 110) of Singapore.
The information in this presentation is subject to change without notice.
Any recirculation, transmission or distribution of this presentation or any part thereof by any third party requires the prior written permission of SGX. SGX and its affiliates disclaim all responsibility and liability
arising in connection with any unauthorised recirculation, transmission or distribution of this presentation or any part thereof.
© SGX Ltd, November 2010
www.sgx.com
SGX The Asian Gateway 26Strictly Private and Confidential Investment Strategies
Investment Strategies

                        Investment
                         Strategies

             Passive      Active      Long / Short

                                           Low Risk

                                           Mid Risk

                                           High Risk
Investment Strategies
Passive Active Long / Short
Efficient market hypothesis – In the Long run performance is equal to
market returns
No attempt to distinguish attractive from unattractive securities, or
forecast securities prices, or time markets and market sectors
Tracking the Index - Indexes may be based on stocks, bonds,
commodities, or currencies
Non Leveraged in Nature
ETFs – Exchange traded funds provide broad market exposure
As of June 2012, in the United States, about 1200 index ETFs exist,
with about 50 actively managed ETFs.Investment Strategies
Passive Active Long / Short
The goal is to outperform an investment benchmark index
The active manager exploits market inefficiencies
Research-based approach focusing on Valuation and Asset allocation
The most obvious disadvantage of active management is that the
fund manager may make bad investment choices or follow an unsound
theory in managing the portfolio
Over a long run it has been established that Fund managers fail to beat
the market on a consistent basisInvestment Strategies
Passive Active Long / Short
Used primarily by hedge funds, Proprietary desk, Delta One Desk
Focus to generate high returns using Leverage
Can be divided in three broad categories:
1. Low Risk – Arbitrage (between different segments or different exchanges
or geographies in asset classes like Index, Stock, Commodities)
2. Mid Risk – Pair trading, Stat Arb, Option Arb (Skew trading)
3. High Risk – Technical trading, Directional trading, Option trading (Volatility
trading, Directional Spread)Investment Strategies
Thank youDisclaimer This Information Package is distributed by Edelweiss Capital Limited (hereinafter “Edelweiss”) on a strictly private and confidential and on a need to know basis exclusively to intended recipient. This Information Package and the information and projections contained herein may not be disclosed, reproduced or used in whole or in part for any purpose or furnished to any other person or persons. The Persons who are in possession of this Information package or may come in possession at a later day, hereby undertakes to observe the restrictions contained herein. The information contained herein is of a general nature and is not intended to address the facts and figures of any particular individual or entity. The content provided here treats the subjects covered here in condensed form. It is intended to provide a general guide to the subject matter and should not be relied on as a basis for business decisions. No one should act upon such information without making appropriate additional professional advice after a thorough examination of the particular situation. This Information Package is distributed by Edelweiss upon the express understanding that no information herein contained has been independently verified. Further, no representation or warranty expressed or implied is made nor is any responsibility of any kind accepted with respect to the completeness or accuracy of any information as may be contained herein. Also no representation or warranty expressed or implied is made that such information remains unchanged in any respect as of any date or dates after those stated herein with respect to any matter concerning any statement made in this Information Package. Edelweiss and its directors, employees, agents and consultants shall have no liability (including liability to any person by reason of negligence or negligent misstatement) for any statements, opinions, information or matters (express or implied) arising out of, contained in or derived from, or for any omissions from the Information Package and any liability whatsoever for any direct, indirect, consequential or other loss arising from any use of this information package and/or further communication in relation to this information package. All recipients of the Information Package should make their own independent evaluations and should conduct their own investigation and analysis and should check the accuracy, reliability and completeness of the Information and obtain independent and specific advice from appropriate professional advisers, as they deem necessary. Where this Information Package summarizes the provisions of any other document, that summary should not be relied upon and the relevant. The information contained in this document is confidential in nature and the recipient is receiving all such information on the express condition of confidentiality unless expressly authorized in writing by Edelweiss. If you are not the intended recipient, you must not disclose or use the information in this document in any way whatsoever. If you received it in error, please inform us immediately by return e-mail and delete the document with no intention of its being retrieved by you. We do not guarantee the integrity of any e- mails or attached files and are not responsible for any changes made to them by any other person.
You can also read