2021 Capital Market Assumptions - March 2021 - Sellwood Consulting LLC
←
→
Page content transcription
If your browser does not render page correctly, please read the page content below
2021 Capital Market
Assumptions
March 2021
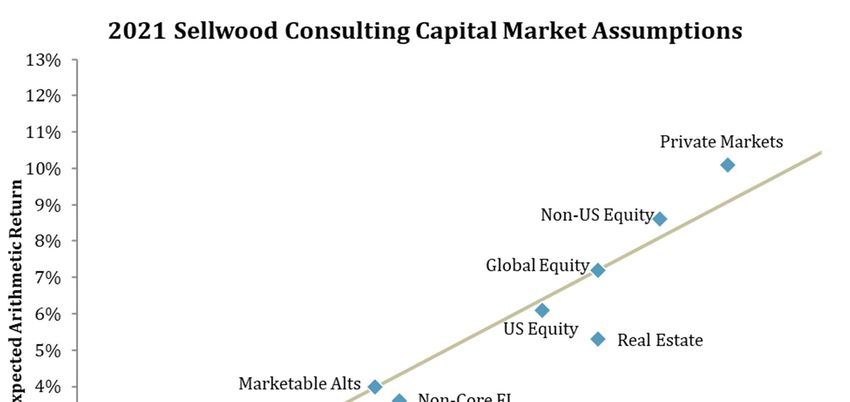
TABLE OF CONTENTS

Table of Contents ..................................................................................................................................................................... 1
INTRODUCTION ....................................................................................................................................................................... 2
INFLATION ................................................................................................................................................................................. 6
FIXED INCOME.......................................................................................................................................................................... 7
 Cash Equivalents ................................................................................................................................................................. 8
 Short-Term US Treasury Inflation Protected Securities (TIPS) ...................................................................... 8
 Low-Duration Fixed Income .......................................................................................................................................... 9
 Intermediate Fixed Income ............................................................................................................................................ 9
 Non-Core Fixed Income.................................................................................................................................................. 10
 Long-Duration Treasurys .............................................................................................................................................. 11
EQUITY ....................................................................................................................................................................................... 12
 US Equity .............................................................................................................................................................................. 13
 Non-US Equity .................................................................................................................................................................... 18
 Global Equity ...................................................................................................................................................................... 20
ALTERNATIVES & DIVERSIFIERS ................................................................................................................................... 21
 Real Estate ........................................................................................................................................................................... 21
 Diversified Inflation-Related Assets ......................................................................................................................... 22
 Marketable Alternatives ................................................................................................................................................ 23
 Private Markets ................................................................................................................................................................. 23
 Managed Futures .............................................................................................................................................................. 24
RISK ............................................................................................................................................................................................. 25
CORRELATION COEFFICIENTS ........................................................................................................................................ 29
APPENDIX: SOURCES ........................................................................................................................................................... 30

 1
Sellwood Consulting LLC 2021 Capital Market Assumptions
INTRODUCTION

Sellwood Consulting updates its capital markets assumptions on an annual basis. Our 2021
assumptions reflect information as of December 31, 2020, unless otherwise noted.

This report documents our process for creating these capital markets assumptions, and we provide
detailed methodology for each. Several over-arching principles, however, inform all of our analysis:

 1. We believe that forward-looking capital market assumptions are an important, but far from
 the only important, input for properly constructing portfolios. Great care should be taken
 not to rely only on mean-variance analysis when constructing portfolios. An analysis that
 relies only on mean-variance analysis will over-allocate to assets with infinitesimally
 superior risk/return estimates, and assets that are less liquid or less frequently priced,
 resulting in inferior diversification and the assumption of unintended risks.

 2. Our assumptions are forward-looking in nature and reflect a ten-year horizon. They are
 most appropriate for analysis of portfolios with long-term (10 year or greater) horizons.
 For portfolios with shorter horizons, alternate methods of analysis should be employed.

 3. We purposefully use different methods to separately estimate return and risk. The first part
 of this paper explains the different methods we employ to estimate the future return of each
 individual asset class. Later in the paper, we explain a more standardized approach to
 estimating future risk of the same asset classes.

 4. Our return assumptions utilize a build-up approach based on the current values of the
 individual drivers of expected return that are unique to each asset class.

 5. For asset classes where the market provides a current view of forward-looking returns, our
 assumptions reflect the market view. Additional complexity would be unhelpful.

 6. Where possible, all of our return assumptions incorporate current valuations. Where we
 have identified a current valuation and its long-term mean, our estimates consider a 50%
 reversion from the current valuation level to its long-term mean over the next ten years.

 7. Our assumptions are presented in nominal terms. Where we have used historical returns in
 our input analysis, we have always transformed them to real, after-inflation, returns, to
 strip out the influence of historical inflation. At the end of the build-up process, where
 appropriate, we add the market’s current measure of forward-looking inflation back to the
 assumptions to create forward-looking nominal return assumptions.

 8. We calculate compound returns. After calculating a compound return and a risk
 assumption, we combine the two mathematically to calculate an arithmetic average
 expected return, which is a necessary input for mean-variance analysis.

 2
Sellwood Consulting LLC 2021 Capital Market Assumptions

9. Our assumptions are passive in nature and assume no active management. 10. Our approach to modeling the expected risk of each asset category is multi-faceted. First, we examine the historical standard deviation of the returns for a proxy index for the asset category (both the full history and most recent 10 years). Next, we examine the historical worst-case annual return experience (or in the case of asset categories that are not priced to market, the worst two years) for the asset class. If necessary, we adjust our risk estimates upward to ensure that the actual worst-case experience had at least a 1% probability of occurring (once every 100 years) under our assumed return and risk distribution parameters. Finally, for asset classes where our confidence in the data available for examination is limited, we qualitatively adjust our risk assumption to reflect this uncertainty. 11. Our correlation coefficient assumptions are mostly derived from history, with an emphasis on the recent past. We seek a proxy for each asset category we have modeled with as long a history as possible, and then calculate our correlation assumptions using a simple average of the following, for each pair of asset categories: Longest-term correlation 10-year correlation 5-year correlation 3-year correlation This approach purposefully overweights the recent past, while acknowledging the long- term past. It is also a more conservative measure for correlation benefit to a portfolio, because recent correlations have been higher than they have been historically. 12. We round our assumptions to the nearest 10 basis points, in the case of arithmetic average return, and nearest 25 basis points, in the case of risk. 13. Our assumptions are applicable to US-based, non-taxable investors. For taxable clients located in the United States, we maintain a separate methodology that considers the effects of taxes on expected returns and risk. 14. We purposefully design a limited set of mostly non-overlapping assumptions for major asset categories. By focusing on major asset classes, with the most data available for examination, we can develop the most robust assumptions. Asset allocation analysis is a blunt tool, and we believe that input assumptions should not be more granular than the methodology can support. Using a more limited set of assumptions reduces the risk of false precision when implementing them. 15. We strive to construct a set of assumptions that is straightforward, explainable, fully documented, and replicable by other researchers. Our assumptions are as complex as necessary but no more complex than necessary. They have no hidden constraints. We could make them more complicated, but we do not believe that doing so would make them better. In summary form, our 2021 capital market assumptions follow on the next page. 3 Sellwood Consulting LLC 2021 Capital Market Assumptions

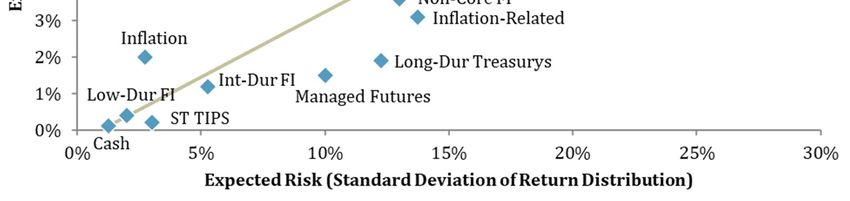
Nominal Nominal
 Compound Arithmetic Sharpe
 Return Risk Return Ratio
 Inflation 1.99% 2.75% 2.00% ---
 Cash Equivalents 0.09% 1.25% 0.10% ---
 Fixed Income

 Short-Term TIPS 0.18% 3.00% 0.20% 0.03
 Low-Duration Fixed Income 0.37% 2.00% 0.40% 0.14
 Intermediate Fixed Income 1.11% 5.25% 1.20% 0.19
 Long-Duration Treasurys 1.20% 12.25% 1.90% 0.09
 Non-Core Fixed Income 2.76% 13.00% 3.60% 0.21
 Global Equity 5.24% 21.00% 7.20% 0.25
 Equity

 US Equity 4.49% 18.75% 6.10% 0.23
 Non-US Equity 6.20% 23.50% 8.60% 0.26
 Real Estate 3.29% 21.00% 5.30% 0.15
 Alternatives

 Diversified Inflation-Related 2.17% 13.75% 3.10% 0.15
 Marketable Alternatives 3.30% 12.00% 4.00% 0.27
 Private Markets 7.15% 26.25% 10.10% 0.27
 Managed Futures 1.06% 10.00% 1.50% 0.10

 4
Sellwood Consulting LLC 2021 Capital Market Assumptions
Historical one-year return distributions (historical real returns, plus our assumed future inflation)
are depicted below in blue, and our forward-looking assumed return distributions are shown in
tan:

 5
Sellwood Consulting LLC 2021 Capital Market Assumptions
INFLATION
 Modeled: US CPI-U Inflation
 Compound Return: 1.99%
 Arithmetic Average Return: 2.00%
 Risk: 2.75%

The market tells us its expectation for forward-looking ten-year inflation, and our assumption
reflects that market assumption.

On December 31, 2020, the market’s yield for a 10-Year US Treasury Bond was 0.93%, and the real
yield for a 10-Year TIPS security was -1.06%. The difference between the two approximates the
market’s inflation expectation over the next ten years, 1.99%.

The Federal Reserve has published this inflation approximation – the so-called “TIPS breakeven
spread” – since 2003. The following chart depicts the full history of this measure, laid against the
actual subsequent inflation (as measured by the Consumer Price Index, “CPI”) that occurred over
the following five years. Although we use 10-year values to create our assumptions, our chart
depicts the five-year TIPS breakeven spread and subsequent five-year inflation, because the 10-
year values do not yet offer sufficient data for evaluation (TIPS have only existed since 1997). With
the exception of especially illiquid market periods, which distort the measure because of liquidity
differences between TIPS and nominal Treasury Bonds, the measure has done a fair job of
predicting subsequent inflation and does not appear to be biased positively or negatively.

 TIPS Breakeven Spread and Subsequent CPI - 5 Years
 4.0%

 3.0%

 2.0%

 1.0%

 0.0%

 -1.0%

 -2.0%

 Subsequent 5-Year CPI 5-Year Breakeven Spread

 6
Sellwood Consulting LLC 2021 Capital Market Assumptions
FIXED INCOME

Fixed income returns are dependent on entry yields. For the BloombergBarclays Aggregate Index,
since 1976, going-in yields have explained 87% of subsequent 10-year returns:

 20% BloombergBarclays Aggregate Yield & Subsequent 10-Year Return

 15%

 10%
 2
 R = 0.87

 5%

 0%
 1976
 1978
 1980
 1982
 1984
 1986
 1988
 1990
 1992
 1994
 1996
 1998
 2000
 2002
 2004
 2006
 2008
 2010
 2012
 2014
 2016
 2018
 2020
 Barclays Aggregate Yield Subsequent 10-Year Return

Given the high degree of certainty of future returns stemming from the entry yield, our fixed income
process lets the market be our guide. For each fixed income assumption, the return is simply the
current yield, adjusted by a default and recovery rate depending on the quality of the asset class.
One reason why current yields do not predict 100% of future returns is that some of the bonds in
the index default. Our assumption reflects this reality.

 7
Sellwood Consulting LLC 2021 Capital Market Assumptions
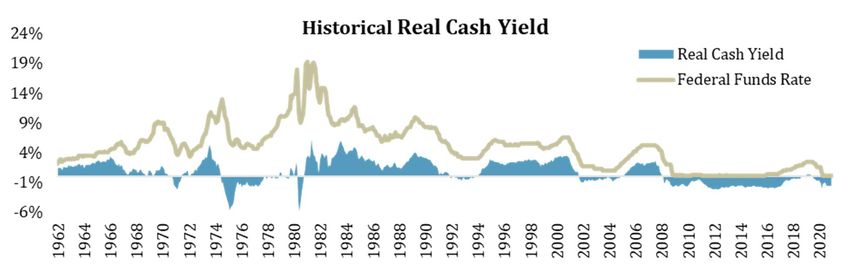
Cash Equivalents
 Modeled: 91-Day T-Bills
 Compound Return: 0.09%
 Arithmetic Average Return: 0.10%
 Risk:1.25%

We use the 91-Day T-Bill yield as the basis of our assumption. As of December 31, 2020, the yield
was 0.09%.

We caution that there is an inherent problem with forecasting a 10-year return for an asset that
matures every 91 days. Nominal cash returns are highly sensitive to nominal short-term interest
rates, which we expect to be as variable over the next decade as they have been historically. As
illustrated in the chart below, while investors typically demand a positive real yield from cash,
periods of negative real return to cash have existed for considerable periods of time – including
most of the time since February 2008. Our risk assumption reflects an appropriate range of
uncertainty around our return projection for cash equivalents.

Short-Term US Treasury Inflation Protected Securities (TIPS)
 Modeled: Short-Term US TIPS
 Compound Return: 0.18%
 Arithmetic Average Return: 0.20%
 Risk: 3.00%

For our Short-Term TIPS assumption, we model a proxy for the BloombergBarclays US 0-5 Year
TIPS Index, which currently has a maturity of 2.5 years. A portfolio of 80% 2-year Treasury Bonds
and 20% 5-year Treasury bonds results in a synthetic Treasury bond with 2.5-year maturity. The
expected Short-Term TIPS return is simply a weighted average of our return expectations for the
nominal 2-year and 5-year Treasury bonds.

Applying these weights to our return projections for those bonds results in a Short-Term TIPS
nominal return assumption of 0.18%:

 (80% x 0.13%) + (20% x 0.36%) = 0.18%.

 8
Sellwood Consulting LLC 2021 Capital Market Assumptions
Low-Duration Fixed Income
 Modeled: 1-5 Year Aggregate Fixed Income
 Compound Return: 0.37%
 Arithmetic Average Return: 0.40%
 Risk: 3.00%

For our Low-Duration Fixed Income assumption, we model the BloombergBarclays US 1-5 Year
Government/Credit Index, which currently has a maturity of 2.9 years and is comprised of 73%
short-term government bonds and 27% corporate bonds. We adjust the current yield with expected
default rate and recovery rates for non-Treasury securities using historical averages for them.

 Starting Yield: 0.38%
 Expected Default Rate: 0.09%
 Expected Default Recovery Rate: 44%
 Default Effect (27% Corporate): 0.01%
 Return Assumption: 0.37%

Intermediate Fixed Income
 Modeled: US Investment-Grade Aggregate and Hedged Non-US Aggregate Fixed Income
 Compound Return: 1.11%
 Arithmetic Average Return: 1.20%
 Risk: 5.25%

For our Intermediate Fixed Income assumption, we model the BloombergBarclays US Aggregate
Bond Index, which currently has a duration of 6 years and is comprised of 47% US Treasury Bonds,
29% corporate bonds, and 24% securitized bonds. We adjust the current yield with expected
default rate and recovery rates for non-Treasury securities using historical averages.

 Starting Yield: 1.14%
 Expected Default Rate: 0.09%
 Expected Default Recovery Rate: 44%
 Default Effect (53% Corp & Securitized): 0.03%
 Return Assumption: 1.11%

We believe that this approach works equally well for US Aggregate fixed income and for Non-US
Aggregate fixed income where the currency exposure is hedged back to the US dollar. By stripping
out currency exposure, the Non-US fixed income investor is left with a portfolio of fixed income
securities expecting similar underlying characteristics to the US fixed income portfolio.

 9
Sellwood Consulting LLC 2021 Capital Market Assumptions
Non-Core Fixed Income
 Modeled: US and Non-US Below-Investment-Grade & Emerging Markets Fixed Income
 Compound Return: 2.76%
 Arithmetic Average Return: 3.60%
 Risk: 13.00%

For our Non-Core Fixed Income assumption, we model the BloombergBarclays Global High Yield
Index with a similar approach as described above, with one adjustment. Expected default and
recovery rates have a meaningful effect on below investment-grade bonds returns, our approach
accordingly adjusts projected future default rates based on current spreads.

As shown below, higher than average spreads have historically corresponded to higher-than-
average default rates.

 High Yield Spreads versus Annual Default Rates
 14.0 Moody's Global: Annual Default Study (1986 to 2019)
 12.0
 Annual Default Rate

 10.0

 8.0

 6.0
 R² = 0.7175
 4.0
 y = 1.141x - 2.0407
 2.0

 0.0
 0.0 2.0 4.0 6.0 8.0 10.0 12.0
 Avg Yearly Spreads

 Current spread: 3.9%
 Projected Default Rate: 2.4%
 Historical Default Rate: 4.3%
 Assumption Default Rate: 3.3%

Given current spreads, the predicted model default rate for high-yield default is 2.4%. We average
that predicted number with the long-term average high-yield default rate since 1983, which is
4.3%, to come up with the combined default assumption of 3.3%.

 Starting Yield: 4.78%
 Expected Default Rate: 3.30%
 Expected Default Recovery Rate: 39%
 Default Effect: (2.02%)
 Return Assumption: 2.76%
 10
Sellwood Consulting LLC 2021 Capital Market Assumptions
Long-Duration Treasurys
 Modeled: US Long-Term Treasury Bonds
 Compound Return: 1.20%
 Arithmetic Average Return: 1.90%
 Risk: 12.25%

For the Long-Duration Treasury assumption, we use our basic model, outlined above, to average the
expected returns for 10- and 20-year Treasury Bonds to approximate the return of a 15-year
Treasury Bond. This average expected return for the Treasury bond is 1.20%.

 (50% x 0.93%) + (50% x 1.47%) = 1.20%

 11
Sellwood Consulting LLC 2021 Capital Market Assumptions
EQUITY

To derive our equity return assumptions, we use two methodologies:
 (i) a building-block approach using the Shiller price-to-earnings (P/E) measure; and
 (ii) an equity risk premium estimate that averages the current implied equity risk premium
 based on a free cash flow to equity model and the historical average equity risk premium.

 Equity Risk Premium /
 Building Block Approach Free Cash Flow to Equity Model

 Inflation

 Capitalization Premium
 Implied Equity Risk Premium
 Expected Real Earnings Growth Equity
 Security Return

 Current Dividend Yield
 Expected 10-Year
 Treasury Return
 (+/-) P/E Reversion Effect

Where our building blocks call for a P/E measure, we assume that this current valuation metric will
revert fully over the prospective ten-year period. Our approach employs “Shiller earnings,” which
represent a ten-year average of them, adjusted for inflation. We prefer this method because it
incorporates a fuller market cycle, aligns with our ten-year forecast period, and has shown a better
empirical track record of predicting future return than other approaches. Research shows that of all
the varied ways to calculate a P/E ratio, the Shiller P/E measure (Cyclically Adjusted Price to
Earnings or “CAPE”) has historically shown the highest predictive power over future 10-year
returns.1

Our building block approach is consistent across equity categories:

 Assumed (Expected) US Inflation
 + Current Dividend Yield
 + Expected Real Earnings Growth
 + Reversion effect of P/E (to average of the 20-year CAPE mean & a justified CAPE 2)

1 Vanguard. Forecasting stock returns: What signals matter, and what do they say now?
2 The Justified Cyclically Adjusted Price to Earnings ratio takes into account the current level of interest rates (r), the long-
term growth in earnings (g), and the historical equity risk-premium (ERP) to approximate a fair-value cyclically adjusted
price to earnings ratio according to the following formula.
Justified CAPE = (1 + g) / ((ERP + r) – g)
 12
Sellwood Consulting LLC 2021 Capital Market Assumptions
US Equity
 Modeled: US Equities, All Capitalizations
 Compound Return: 4.49%
 Arithmetic Average Return: 6.10%
 Risk: 18.75%

We create a return assumption for the entire US market by calculating return estimates for large-
and small-cap equity and applying those returns to the current market capitalization weights. The
current weights, 92% large, and 8% small3, yield a US Equity assumption of 4.49% in compound
terms:
 (92% x 4.47%) + (8% x 4.73%) = 4.49%.

Our calculation methodologies of the US large- and small-cap assumptions are explained below.

US Large-Cap Equity
Our return assumption for the US large-cap equity portion of the US Equity assumption is the
average of two separate approaches:
 (i) a valuation-based building-block approach and;
 (ii) a free cash flow to equity model.

Building Block Approach

We find the Shiller P/E metric to be the most useful of various valuation metrics from the
perspective of utility in forecasting returns. The following chart depicts the Shiller P/E metric for
the US market, since 1951 (the post-WWII period). The Shiller P/E at a given point in time is
depicted on the horizontal axis, and the subsequent 10-year inflation-adjusted return is depicted on
the vertical axis. We have decomposed the data array into three economic regimes – the post-war
boom (in blue; 1951-1965); the great inflationary period (in tan; 1966-1984); and the great
moderation (in grey; 1985-2020). Examining the data this way yields useful insights and,
importantly, high predictive power for the Shiller P/E metric over subsequent real return. The S&P
500’s current position on the chart is indicated by the bold vertical line.

3 FTSE/Russell.
 13
Sellwood Consulting LLC 2021 Capital Market Assumptions
Long-Term Shiller P/E versus 10-yr Inflation-Adjusted Returns
 By Economic Regime, Since 1951 (Postwar period)
 20%
Subsequent 10-Year Real Return

 15%

 10%

 5%
 R² = 0.88
 0%

 -5% R² = 0.88
 R² = 0.88
 -10%
 0 5 10 15 20 25 30 35 40 45 50
 Starting-Point Shiller P/E Valuation
 Current Value Postwar Boom Great Inflation Great Moderation

For the valuation-based building block component of the US large-cap return, we create our
building blocks from the S&P 500 Index:

 1.99% Inflation
 1.99% Current Dividend Yield
 1.95% Long-Term Compound Average Real Earnings Growth (Since 1950)

For the valuation building block, we assume that the current Shiller P/E will revert to a different
level over the next decade. We don’t know what that level will be, but we assume that it will revert
to the average of the simple 20-year historical average level, and the level that would be justified
based on long-term growth rate, the current risk-free rate, and the historical equity risk premium.
We call this latter level the “Justified CAPE.” Using this approach, we assume that valuation
reversion will subtract 2.81% per year, on average, from future equity returns:

 Shiller P/E
 Current 30.9
 20-Year Average 24.8
 Justified CAPE 26.8
 Average 25.8
 Annual Reversion Effect -2.81%

The building blocks approach results in an expected compound return for US large-cap equity of
3.13%. This approach represents half of our calculation for US large-cap equity:

 Inflation 1.99%
 Current Dividend Yield 1.99%
 Average Real Earnings Growth 1.95%
 P/E Reversion -2.81%
 Building Block Assumption 3.13%

 14
Sellwood Consulting LLC 2021 Capital Market Assumptions
Equity Risk Premium / Discounted Free Cash Flow Model

For the implied equity risk premium, we reference and modify a discounted free cash flow model
created by Professor Aswath Damodaran of the Stern School of Business4 that uses a free cash flow
to equity approach to account for dividends as well as stock buybacks.

Our modified free-cash-flow-to-equity model employs several input variables and uses I/B/E/S
earnings projections for the next two years. Earnings are then assumed to linearly revert to the
long-term risk-free rate in years three to five. We assume the risk-free rate to be the 10-year
Treasury bond return.

Beginning (current) S&P 500 level = $3,230.78
Base year free cash flow to equity, S&P 500 = $127.785
Expected S&P 500 earnings growth over next 5 years6 = 21.4% in year 1
 14.7% in year 2
 10.1% in year 3
 5.5% in year 4
 0.9% in year 5
Expected S&P 500 earnings growth past year 5= 0.93%7

We apply a standard discounted cash flow methodology to these variables and solve for the rate of
growth that makes the discounted forecasted value of the S&P 500 identical to today’s value.

 127.78(1.214) 151.46(1.127) 170.72(1.0875) 185.66(1.048) 194.52(1.009) 194.52(1.0093)
 3,756.07 = + + + + +
 (1 + ) (1 + ) (1 + ) (1 + ) (1 + ) ( − 0.0093)(1 + )

Solving for r yields the expected nominal return for the S&P 500 over the next 10 years, under these
assumptions. That rate of return is 5.88%. Subtracting our assumed 10-Year Treasury return of
0.93% results in an expected equity risk premium of 4.95%.

This implied equity risk premium is higher than what history has delivered. To moderate this, we
average the current implied forward-looking equity risk premium (4.93%) and the long-term
historical geometric average realized equity risk premium (4.83%) to derive an equity risk
premium estimate of 4.83% for US large-cap equity. Substituting this assumed equity risk premium
into the model results in a return estimate of 5.82%.

Combining the Two Approaches

Averaging the expected returns generated by the building-blocks approach and the discounted free
cash flow model yields an expected compound return of 4.47% for US large-cap equity.

4 http://pages.stern.nyu.edu/~adamodar/
5 2020 S&P 500 Dividends = $58.89 + buybacks = $68.89
6 Given the projected rebound in earnings expected following 2020, we use individual year growth rates. Historically, the

 I/B/E/S consensus analyst forecast has overstated subsequent actual earnings growth by 15.6%. We reduce our
 assumption for earnings growth by 13.5% (1-(1/1.156)) accordingly.
7 Our forecasted return for the 10-year Treasury Bond, as a proxy for the ten-year risk-free rate.

 15
Sellwood Consulting LLC 2021 Capital Market Assumptions
US-Small Cap Equity

Our return assumption for the US small-cap equity portion of the US Equity assumption uses a
similar building blocks approach as our approach for US large-cap. Because data is much more
limited for small-cap equities than for large-cap equities, we evaluate small-cap equities relative to
large-cap equities rather than relative to their own history. For US small-cap equity, we compare
the build-up method for the Russell 2000 Index and S&P 500 Index over the longest common time
period for the two indexes (1979-2020). The build-up method is only half of our US large-cap equity
assumed return, so we divide the premium in half and add or subtract it from our final US large-cap
equity return.

While our assumption models the full universe of small-cap stocks, the data we use excludes
companies with negative earnings. Our analysis has shown that, as compared to using the data from
the full universe of small-cap stocks, using the dataset that excludes negative earners has yielded
higher predictive power over future returns of the full index, which includes the negative earners.
Our building blocks for US small-cap equity are as follows:

 1.99% Inflation
 1.20% Current Dividend Yield
 2.57% Long-Term Real Earnings Growth

We measure expected P/E reversion halfway to long-term mean:

 Shiller P/E
Current 31.4
Long-Term Average 22.2
Annual Reversion Effect -1.70% (halfway to long-term average)

The build-up approach results in an expected compound return for US small-cap equity of 2.71%, a
negative premium of 0.43% relative to US large-cap equity using a similar methodology over the
longest common time period (1988-2019) for which we have reliable data.

 US Large-Cap Implied Build-up 2.36%
 US Small-Cap Build-up 2.07%
 Small-Cap Premium -0.43%

Since 1994, however, this approach has systematically understated subsequent 10-year relative
returns to small-cap versus large-cap US stocks, by 0.30% per year:

 16
Sellwood Consulting LLC 2021 Capital Market Assumptions
6%
 Predicted vs Actual Small-Cap Premium Over Large-Cap
 5%
 Predicted (Small Cap - Large Cap)
 4%
 Actual (Small - Large)
 3%
 2% Predicted (Small Cap - Large Cap)
 Average Since 94
 1%
 0%
-1%
-2%
 1993
 1994
 1995
 1996
 1997
 1998
 1999
 2000
 2001
 2002
 2003
 2004
 2005
 2006
 2007
 2008
 2009
 2010
 2011
 2012
 2013
 2014
 2015
 2016
 2017
 2018
 2019
 2020
To account for this bias, we take the difference between the model’s current predicted premium
(-0.29%) and the long-term average predicted premium (-0.30%) and apply only the differential.
Then, we add only half of that differential to our assumption for US large-cap equities, because the
building-blocks calculation itself represented only half of our calculation of US large-cap equity
return.

 US Large-Cap Assumed Return: 4.47%
 Assumed Small Cap Premium: 0.25%
 ½ Calculated Small-Cap Premium: +0.01%
 Return Assumption: 4.73%

 17
Sellwood Consulting LLC 2021 Capital Market Assumptions
Non-US Equity
 Modeled: Non-US Equities, All Regions & Capitalizations
 Compound Return: 6.20%
 Arithmetic Average Return: 8.60%
 Risk: 23.50%

Our return assumption for Non-US Equity is intended to model the entire non-US equity market. It
assumes the current weighting of large-cap and small-cap equities in the international equity
market – 87% large-cap and 13% small-cap8. These weights are applied to underlying non-US large-
cap equity and non-US small-cap equity assumptions. This weighting yields a compound return
assumption of 6.20%:

 (87% x 6.17%) + (13% x 6.43%) = 6.20%.

The calculation methodologies of Non-US large- and small-capitalization equities are explained
below.

Non-US Large Cap Equity
We build separate assumptions for developed and emerging non-US markets, and then weigh them
according to current market weights to construct our non-US large-cap equity assumption, which is
intended to model equities of both developed and emerging markets. Just as on the US side, we
combine a Shiller-based building block approach with an equity risk premium estimate.

Building Block Approach

Over the longest common period for which we have both US (S&P 500 Index) and non-US
developed markets (MSCI EAFE Index – “EAFE”) earnings data (since 1977), non-US developed
markets have grown at only 72% times the rate of US large-capitalization stocks, in real terms. We
apply this proportion to our assumed long-term earnings growth rate for US large-capitalization
stocks (1.95%) to yield an assumed non-US developed markets earnings growth rate of 1.62%.

Over the longest common period for which we have both US (S&P 500 Index) and emerging (MSCI
EM Index – “EM”) markets earnings (1995), emerging market earnings have grown at 2.33 times
the rate of US large-capitalization stocks. Going forward, we do not expect this growth rate to
continue indefinitely and have cut the long-term ratio in half to 1.12 times long-term U.S. earnings
growth. We apply this proportion to our assumed long-term earnings growth rate for US large-
capitalization stocks to yield an assumed emerging markets earnings growth rate of 2.18%.

For developed and emerging markets, our assumed building blocks are as follows:

8 MSCI, Morningstar Direct
 18
Sellwood Consulting LLC 2021 Capital Market Assumptions
EAFE EM
 Inflation 1.99% 1.99%
 Current Dividend Yield 2.36% 1.97%
 Adjusted Compound Average Real Earnings Growth 1.62% 2.18%

We measure expected Shiller P/E reversion to mean based on two methods:

 EAFE EM
 Current 17.9 15.8
 20-Year Average 17.9 20.0
 Justified CAPE 20.6 15.8
 Average 19.3 20.0
 Annual Reversion Effect +0.74% +1.28%

This approach yields an expected compound return for of 6.50% developed-markets Non-US Large-
Capitalization Equities and 7.42% for Emerging Market Equities using the build-up methodology.

Equity Risk Premium / Discounted Free Cash Flow Model

Our modified free-cash-flow-to-equity model employs several input variables:

 EAFE EM
Beginning (current) level = $2,147.53 $1,291.26
Base year free cash flow to equity= $63.35 $29.93
Expected earnings growth over next 5 years9 =
 Year 1 37.2% 35.3%
 Year 2 15.2% 16.1%
 Year 3 10.4% 11.0%
 Year 4 5.7% 6.0%
 Year 5 0.9% 0.9%
Expected earnings growth past year 5= 0.93% 0.93%

Just as before, we solve for to find the equity risk premium. That rate of return is 5.76% for
Developed Markets and 4.74% for Emerging Markets. As above, we subtract the ten-year Treasury
rate and average with the long-term historical geometric average realized equity risk premium
(4.83%).

The result is an estimated equity risk premium of 5.76% for Developed Markets and 5.25% for
Emerging Markets using the discounted free cash flow model.

9 Given the projected rebound in earnings expected following 2020, we use individual year growth rates. Historically, the
 I/B/E/S consensus analyst forecast has overstated subsequent actual earnings growth by 15.6%. We reduce our
 assumption for earnings growth by 13.5% (1-(1/1.156)) accordingly.
 19
Sellwood Consulting LLC 2021 Capital Market Assumptions
Combining the Two Approaches
 EAFE EM
 Building Block Approach 6.50% 7.42%
 Equity Risk Premium 5.76% 5.25%
 Average 6.13% 6.33%

Developed markets currently comprise 81%, and emerging markets 19%, of the non-US total equity
market. Applying those weights to our developed and emerging markets assumptions yields a non-
US large-capitalization compound return assumption of 6.17%.

Non-US Small Cap Equity
Due to lack of data availability in the non-us small-cap equity space, we assume the same small-cap
premium for non-US small cap-equity as our assumption for US small-cap equity. We calculated a
US small-cap equity premium of 0.26%, which yields a compound assumption of 6.43%.

Global Equity
 Modeled: World Equities, All Capitalizations
 Compound Return: 5.24%
 Arithmetic Average Return: 7.20%
 Risk: 21.00%

We create a return assumption for the global equity market by applying our US and Non-US Equity
return estimates to the total world market capitalization weights. The current weights, 56% US, and
44% Non-US, yielding a Global Equity assumption of 5.24% in compound terms:

 (56% x 4.49%) + (44% x 6.20%) = 5.24%

 20
Sellwood Consulting LLC 2021 Capital Market Assumptions
ALTERNATIVES & DIVERSIFIERS

Alternative assets are not easily modeled with public-market index proxies. As well, we are more
reluctant to rely on their long-term history, given growth in assets allocated to such strategies over
the last several decades and the dynamic nature of strategies employed. Instead, we employ a build-
up approach to identify and model their sources of return.

Real Estate
 Modeled: Public (US Equity REITs)
 Compound Return: 3.29%
 Arithmetic Average Return: 5.30%
 Risk: 21.00%

Our expected return reflects going-in cap rates for public real estate. We calculate the current cap
rate, defined as income divided by price, of the FTSE NAREIT All Equity REITS Index: 3.29%.

The following chart depicts the inverse of the cap rate for the equity REIT benchmark: its historical
price-to-income ratio. The present low cap rate is explained by high valuations relative to the
index’s own history.

 NAREIT All Equity REITS
 35 Valuation: Price / 12-Month Trailing Income
 30
 25
 20
 15
 10
 5
 0
 1973
 1975
 1977
 1979
 1981
 1983
 1985
 1987
 1989
 1991
 1993
 1995
 1997
 1999
 2001
 2003
 2005
 2007
 2009
 2011
 2013
 2015
 2017
 2019

 Price / 12-Month Trailing Income Average

We note that the primary driver of return for core real estate over the long term has been income,
not appreciation. For equity REITS, in real terms since 1973, historical price appreciation has
averaged 0.27% per year, and income has averaged 3.15% per year. Our compound return
assumption is very close to the historical income return for the asset class.

 21
Sellwood Consulting LLC 2021 Capital Market Assumptions
Diversified Inflation-Related Assets
 Modeled: Diversified portfolio containing 1/3 each: Real Estate, Commodities, and US TIPS
 Compound Return: 2.17%
 Arithmetic Average Return: 3.10%
 Risk: 13.75%

We assume a diversified portfolio containing 1/3 each in US TIPS, Real Estate, and Commodities.

The US TIPS component is the expected return for US TIPS, which we model using the same
methodology as our Short-Term TIPS assumption outlined above, except for the entire US TIPS
market instead of just the short-duration segment: 0.74%, in compound terms.

The Real Estate component is our Real Estate Assumption: 3.29% in compound terms.

For the Commodities component, we build a model assuming that commodity return can be
decomposed into three sources: collateral reinvestment yield, commodity spot return, and roll
yield.

We assume 0% for roll yield, knowing that it has been positive and negative over various historical
periods, as the buying and selling balance between commodity investors and commodity
consumers has shifted. Over the last decade, roll yield has been negative.

For spot return, we calculate a series of the last 10 years of real prices for the Bloomberg
Commodity Index and assume that the current real price of the index will revert halfway to its 10-
year average, in even increments over each of the next 10 years. The current real spot price for the
Bloomberg Commodity Index is 72.57, and its 10-year average real price is 115.8. Reverting
halfway to this average real price implies a compound real spot return of 2.48% per year.

In summary, for the Commodities component:

 Collateral: 0.09% (our assumed nominal return for Cash Equivalents)
 Spot return: 2.48% (halfway to long-term average)
 Roll yield: 0.00%
 Commodity return: 2.48%

For the Diversified Inflation-Related assumption, we assume a compound return of:

 1/3 (TIPS) + 1/3 (Real Estate) + 1/3 (Commodities)
 = 1/3 (0.74%) + 1/3 (3.29%) + 1/3 (2.48%) = 2.17%

 22
Sellwood Consulting LLC 2021 Capital Market Assumptions
Marketable Alternatives
 Modeled: Hedge Funds of Funds, Global GTAA, & Multi-Asset Alternative Strategies
 Compound Return: 3.30%
 Arithmetic Average Return: 4.00%
 Risk: 12.00%

We assume a diversified portfolio that will tend to approximate the following market exposures
over time:

 40% Global Equity
 30% Intermediate Fixed Income
 30% Non-Core Fixed Income

Weighting those assumptions accordingly results in a compound return assumption of 3.34%.

Given that our assumption set is intended to be passive in nature and not reflect active
management, for hedge funds, we are assuming an industry average hedge fund of funds.

Private Markets
 Modeled: Buyouts, Venture Capital, & Distressed Investments, in Lockup Vehicles
 Compound Return: 7.15%
 Arithmetic Average Return: 10.10%
 Risk: 26.25%

We assume a diversified portfolio will tend to approximate the market exposure of US-Small Cap
Equity over time, with a multiplication factor to account for the additional leverage, illiquidity, and
risk premium:

 (US-Small Cap Equity Arithmetic Average) x (1.5 Illiquidity/Leverage/Risk Premium)

Weighting those assumptions accordingly results in a compound return assumption of 7.15%.

Given that our assumption set is intended to be passive in nature and not reflect active
management, we are assuming an industry-average active manager or collection of active
managers.

 23
Sellwood Consulting LLC 2021 Capital Market Assumptions
Managed Futures
 Modeled: Managed Futures Strategies Targeting 10% Volatility
 Compound Return: 1.06%
 Arithmetic Average Return: 1.50%
 Risk: 10.00%

Using the SG Trend Index, an index of actual, “live” managed futures strategies, we calculate the
excess return to cash that managed futures strategies have returned since January 1, 2000 (the
index’s inception date). We scale that premium based on a targeted 10% volatility level and arrive
at a historical annualized arithmetic average premium over cash of 1.93%. Recognizing that this
premium benefited from a very favorable start date for the index (the beginning of a protracted,
trending bear market, followed by a protracted, trending bull market until 2007), we cut this
historical premium in half for forward-looking purposes.

We then add back our Cash Equivalent return assumption of 0.09% to come up with a 1.06% return
assumption for Managed Futures.

 0.97% + 0.09% = 1.06%

 24
Sellwood Consulting LLC 2021 Capital Market Assumptions
RISK

Our risk assumptions are mostly derived from history, but we have enhanced historical metrics
with qualitative overlays in several asset categories.

For each asset category, we began by examining the following historical annual returns:

Inflation US CPI
Cash Equivalents 91-Day T-Bills
Low-Duration Fixed Income BloombergBarclays 1-5 Year Government/Credit
Intermediate Fixed Income BloombergBarclays US Aggregate
Non-Core Fixed Income BloombergBarclays Global High Yield back to 1988;
 ICE BofA High Yield Master II before 1998
Long-Duration Treasurys BloombergBarclays Long Treasurys
Short-Term TIPS BloombergBarclays US 0-5 Year TIPS
Global Equity MSCI ACWI IMI back to 1994; MSCI ACWI before 1994
US Equity Russell 3000 back to 1979; S&P 500 before 1979
Non-US Equity MSCI ACWI ex US IMI back to 1994; MSCI EAFE before 1994
Real Estate FTSE NAREIT
Diversified Inflation-Related 1/3 each: FTSE NAREIT, BloombergBarclays US TIPS, Bloomberg
 Commodity
Marketable Alternatives 40% our Global Equity series, 30% our Intermediate Fixed Income
 series, and 30% our Non-Core Fixed Income series
Non-Marketable Alternatives 1.5x our US-Small Cap Equity series
Managed Futures SG Trend Index

In each case, we calculated the longest-term standard deviation of returns possible for the category.
Then, we calculated the standard deviation of annual returns over the last ten years. The average of
these two figures represents our base-case risk assumption.

Next, we examined the worst annual return for each proxy index, going back as far as possible into
history. We assumed this return as the worst-case scenario. In some cases, the normal return
distribution implied by our return and risk assumptions suggested that the actual worst-case
scenario had less than a 1% probability (1 in 100 years) of occurring. Because we are
uncomfortable assuming that observed reality – what has actually happened in the real world – is
extremely unlikely, we adjusted our risk assumption upward until the actual, real-world worst-case
scenario had at least a 1% probability of occurring under our assumed normal return distribution.

Finally, based on this analysis and our qualitative assessment of the quality and longevity of our
return data, we made several qualitative adjustments, where noted. The results of this risk analysis
follow.

The following table depicts actual standard deviations of annual return, measured in the long term
(as far back as history will allow), for the last ten years, and the average of those two figures.
 25
Sellwood Consulting LLC 2021 Capital Market Assumptions
Adding or subtracting our qualitative adjustment results in the Risk Assumption at the far right.

 Standard Deviation of Returns
 Risk
 Qualitative Assumption
 10-Years Long-Term Average Adjustment (Rounded)
Cash Equivalents 0.83% 3.29% 2.06% -0.75% 1.25%
Short-Term TIPS 2.46% 3.53% 2.99% 0.00% 3.00%
Low-Duration Fixed Income 1.17% 4.54% 2.85% -0.75% 2.00%
Intermediate Fixed Income 3.64% 6.66% 5.15% 0.00% 5.25%
Long-Duration Treasurys 13.26% 11.30% 12.28% 0.00% 12.25%
Non-Core Fixed Income 7.71% 14.36% 11.03% 2.00% 13.00%
Global Equity 13.56% 18.07% 15.82% 5.25% 21.00%
US Equity 12.90% 17.02% 14.96% 3.75% 18.75%
Non-US Equity 14.99% 22.30% 18.64% 4.75% 23.50%
Real Estate 11.96% 19.96% 15.96% 5.00% 21.00%
Diversified Inflation-Related 7.33% 11.99% 9.66% 4.00% 13.75%
Marketable Alternatives 7.52% 11.08% 9.30% 2.70% 12.00%
Private Markets 23.39% 28.07% 25.73% 0.50% 26.25%
Managed Futures 8.71% 9.57% 9.14% 0.86% 10.00%

 26
Sellwood Consulting LLC 2021 Capital Market Assumptions
The following table examines the probability of the actual experienced worst case occurring under
our assumed normal distribution of returns, as implied by our expected return and standard
deviation of returns, after accounting for qualitative adjustments to risk.

We measure the actual worst-case scenario in “sigmas,” or standard deviations from our assumed
mean return. Measuring this way, we ask, “How likely was the actual experienced worst case,
according to the distribution parameters we have assumed?” We have qualitatively adjusted several
asset classes to ensure that the probability of the actually experienced worst case is always greater
than 1%, meaning we assume that the experienced worst case has at least a one-in-a-hundred-year
chance of happening under our assumptions.

 Actual Worst Implied
 Case, in Sigmas Probability of
 from Actual Worst
 Worst Year Assumption Case Occurring
Cash Equivalents 0.02% 2014 0.06 47.7%
Short-Term TIPS -2.03% 2008 0.74 22.8%
Low-Duration Fixed Income 0.55% 1994 0.07 47.2%
Intermediate Fixed Income -2.92% 1994 0.80 21.2%
Long-Duration Treasurys -12.92% 2009 1.21 11.4%
Non-Core Fixed Income -26.89% 2008 2.34 1.0%
Global Equity -42.01% 2008 2.34 1.0%
US Equity -37.31% 2008 2.32 1.0%
Non-US Equity -45.99% 2008 2.33 1.0%
Real Estate -42.24% 1974 2.27 1.2%
Diversified Inflation-Related -28.61% 2008 2.32 1.0%
Marketable Alternatives -23.30% 2008 2.27 1.1%
Private Markets -50.68% 2008 2.32 1.0%
Managed Futures -8.11% 2018 0.96 16.8%

 27
Sellwood Consulting LLC 2021 Capital Market Assumptions
Our qualitative adjustments to Risk were as follows:

Cash Equivalents (-0.75%) and Low-Duration Fixed Income (-0.75%)

 While the long-term standard deviation of returns to cash and short-term bonds have been
 greater than 3%, that volatility was experienced at higher levels of cash return. We believe it is
 unlikely for the distribution of returns to these assets to be as wide as historically observed,
 given its current low level of return. We qualitatively adjust their risk downward by 75 basis
 points.

Global Equity (+5.25%), US Equity (+3.75%), Non-US Equity (+4.75%), Real Estate (+5.00%),
Diversified Inflation-Related (+4.00%), Non-Core Fixed Income (+2.00%), Private Markets
(+0.50%)

 These categories were adjusted upward to make their actual worst-case experience greater
 than a 1% probability of occurring under the assumed return distribution.

Marketable Alternatives (+2.70%)

 We apply the same adjustments from above at the target underlying asset class weights.

Managed Futures (+0.86%)

 This adjustment adds or subtracts to achieve a 10.00% target volatility target.

 28
Sellwood Consulting LLC 2021 Capital Market Assumptions
CORRELATION COEFFICIENTS

Our forward-looking correlation assumptions are mostly derived from long-term history but
emphasize the recent past. The indices used for each asset class match what has been used above
for our risk analysis.

Using those streams, we constructed a correlation matrix that takes the simple average of four
other correlation matrices – constructed with 3 years, 5 years, and 10 years of data, and one with as
much data as possible going back to each series’ inception. Averaging these four measures gives
acknowledgement to the long-term history while emphasizing the recent past, when correlations
have been higher than long-term history has delivered. This approach is therefore conservative in
assuming the diversification benefit that will appear from correlation in our modeling.

Our assumed return correlation matrix follows:

 Sellwood Consulting 2021 Correlation Coefficient Assumptions

 Diversified Inflation-Related
 Low-Duration Fixed Income

 Intermediate Fixed Income

 Long-Duration Treasurys

 Marketable Alternatives
 Non-Core Fixed Income

 Managed Futures
 Short-Term TIPS
 Cash Equivalents

 Private Markets
 Non-US Equity
 Global Equity

 Real Estate
 US Equity
 Inflation

Inflation 1.00 0.01 0.18 -0.11 -0.11 -0.14 0.12 0.02 0.00 0.03 0.02 0.15 0.11 0.00 -0.11
Cash Equivalents 0.01 1.00 -0.15 0.33 0.09 0.19 -0.32 -0.27 -0.25 -0.28 -0.19 -0.23 -0.32 -0.31 0.06
Short-Term TIPS 0.18 -0.15 1.00 0.51 0.54 0.17 0.61 0.43 0.40 0.45 0.53 0.68 0.51 0.39 0.17
Low-Duration Fixed Income -0.11 0.33 0.51 1.00 0.83 0.67 0.11 -0.13 -0.15 -0.11 0.12 0.11 -0.08 -0.19 0.22
Intermediate Fixed Income -0.11 0.09 0.54 0.83 1.00 0.85 0.33 0.01 -0.01 0.03 0.33 0.28 0.08 -0.06 0.32
Long-Duration Treasurys -0.14 0.19 0.17 0.67 0.85 1.00 -0.11 -0.35 -0.34 -0.34 0.00 -0.10 -0.29 -0.39 0.35
Non-Core Fixed Income 0.12 -0.32 0.61 0.11 0.33 -0.11 1.00 0.77 0.71 0.78 0.73 0.80 0.78 0.70 0.03
Global Equity 0.02 -0.27 0.43 -0.13 0.01 -0.35 0.77 1.00 0.97 0.97 0.72 0.77 0.87 0.92 0.06
US Equity 0.00 -0.25 0.40 -0.15 -0.01 -0.34 0.71 0.97 1.00 0.89 0.72 0.73 0.83 0.93 0.07
Non-US Equity 0.03 -0.28 0.45 -0.11 0.03 -0.34 0.78 0.97 0.89 1.00 0.67 0.76 0.86 0.85 0.05
Real Estate 0.02 -0.19 0.53 0.12 0.33 0.00 0.73 0.72 0.72 0.67 1.00 0.89 0.63 0.73 0.09
Diversified Inflation-Related 0.15 -0.23 0.68 0.11 0.28 -0.10 0.80 0.77 0.73 0.76 0.89 1.00 0.72 0.74 0.11
Marketable Alternatives 0.11 -0.32 0.51 -0.08 0.08 -0.29 0.78 0.87 0.83 0.86 0.63 0.72 1.00 0.83 0.17
Private Markets 0.00 -0.31 0.39 -0.19 -0.06 -0.39 0.70 0.92 0.93 0.85 0.73 0.74 0.83 1.00 0.00

Managed Futures -0.11 0.06 0.17 0.22 0.32 0.35 0.03 0.06 0.07 0.05 0.09 0.11 0.17 0.00 1.00

 29
Sellwood Consulting LLC 2021 Capital Market Assumptions
APPENDIX: SOURCES

We are grateful to several data sources for our analysis. They were:

FRED, The St. Louis Fed Federal Reserve Economic Data
 https://fred.stlouisfed.org/

FTSE NAREIT
 https://www.reit.com/data-research/reit-indexes/ftse-nareit-us-real-estate-index-historical-values-returns
 http://www.ftse.com/products/indices/russell-us

Professor Aswath Damodaran, Stern School of Business
 http://pages.stern.nyu.edu/~adamodar/New_Home_Page/datafile/implpr.html
 http://papers.ssrn.com/sol3/papers.cfm?abstract_id=2581517

Research Affiliates
 http://www.researchaffiliates.com

Blackrock
 http://www.blackrock.com

Standard & Poors
 http://www.standardandpoors.com

Morgan Stanley Capital International
 http://www.msci.com/

Moodys
 https://www.moodys.com/researchdocumentcontentpage.aspx?docid=PBC_151031
 https://www.moodys.com/researchdocumentcontentpage.aspx?docid=PBC_154805

Professor Robert Shiller
 http://www.econ.yale.edu/~shiller/data.htm

Vanguard
 https://personal.vanguard.com/pdf/s338.pdf

 This work is licensed under a Creative Commons Attribution-NoDerivatives 4.0 International
 License. To view a copy of this license, visit http://creativecommons.org/licenses/by-nd/4.0/.

 30
Sellwood Consulting LLC 2021 Capital Market Assumptions
You can also read