Results Briefing Materials - for FY2021/2Q
←
→
Page content transcription
If your browser does not render page correctly, please read the page content below
Results Briefing Materials
                                             for FY2021/2Q

                                                                        Kagome Co., Ltd.
                                                                           Securities code: 2811
Figures in these materials
- Amounts are rounded down to the nearest 100 million yen. Part of amounts for core operating income are rounded down to the nearest 10 million yen.
- Percentages are rounded to one decimal place.
                                                                                                                                                       1
1. Summary of Business Results for
          FY2021/2Q

                                     2
FY2021/2Q Consolidated Results
Achieved gains in revenue and profit due to rising health consciousness, continued stay-at-home demand
and measures to stimulate demand for vegetables such as the “Let’s Eat Vegetables” campaign

                                                             Results              YoY
               Unit: 100 million yen                                                    Rate of    FY2020/1H   FY2019/1H
                                                                 Margin
                                                                                        change

             Revenue                                  919                 -     +31        +3.5%         888         885
             Core Operating
                                                         71            7.7%      +7       +11.9%          63          54
             Income
             Operating Income                            69            7.6%      +0        +1.0%          68          71

             Net Income*                                 47            5.2%      +1        +3.6%          45          54

             ROE                                    4.2%           -              0        -            4.2%        5.4%

             ROA                                    3.3%           -          +0.3pt       -            3.0%        2.8%

             EPS (yen)                             53.05           -          +1.39        -           51.66       61.53
             * Net income attributable to owners of parent

                                                                                                                           3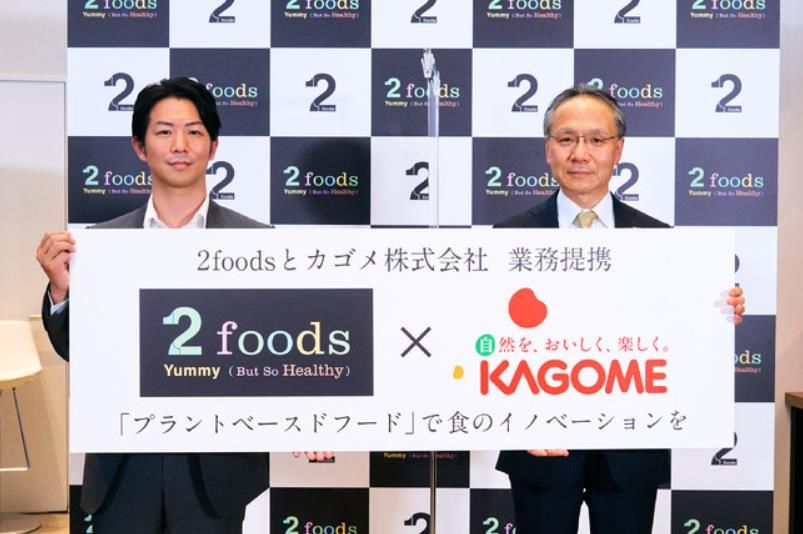
FY2021/2Q Results by Segment
Achieved gains in revenue in all segments except domestic agriculture business
Achieved higher profit overall given a strong performance in international business,
which offset lower profit in domestic businesses
Revenue                                                                                 Core Operating Income
                           FY2021                                                       FY2021
                                                                    FY2020/ FY2019/                                       FY2020/     FY2019/
   Unit: 100 million yen                             Rate of                                                  Rate of
                                         YoY                          1H      1H                   YoY                      1H          1H
                                                     change                                                   change
Beverages                      371             +7           +2.0%        364     352        35.1      (0.4)      (1.3)%        35.6          25.7

Direct marketing                60             +4           +8.0%        55       51         3.9      +0.3       +9.7%          3.6           4.0

Food and others                217             +1           +0.6%        216     225        13.5      (2.6)     (16.4)%        16.2          16.8

Domestic processed
                               649             +13          +2.0%        636     629        52.7      (2.7)      (5.0)%        55.4          46.6
food business
Domestic agriculture
                                    49         (3)      (6.8)%           53       51         1.0      (1.3)     (58.0)%         2.3           0.0
business
International business         257             +31     +13.9%            225     232        17.2     +13.4     +363.3%          3.7           5.6

Other/adjustments              (37)            (9)      -               (27)     (28)        0.2      (1.7)     (88.6)%         2.0           1.9

Total                          919             +31          +3.5%        888     885        71.1      +7.5      +11.9%         63.5          54.2

                                                                                                                                         4
FY2021/2Q Topics

Domestic processed food business               Beverages
Achieved a year-on-year increase in revenue due to the release of new products and proactive promotions

Domestic processed food business Direct marketing
Positioned as a business expected to drive growth and disclosed as a separate segment following a change in segmentation
from this fiscal year
Posted gains in revenue and profit due to growing use of the direct marketing channel and rising health consciousness

Domestic processed food business              Food and others
Products for household use: Revenue fell due to the recoil from special demand for eating at home caused by COVID-19
but exceeded 2019 levels
Products for Institutional and industrial use: Showed signs of recovery from 2020 but failed to recover to 2019 levels due to
protracted slump of food service industry

Domestic agriculture business
Reported declines in revenue and profit due to a downturn in market conditions for fresh tomatoes

International business
Posted gains in revenue and profit due to recovery of food service demand and lower costs due to increased productivity

                                                                                                                         5
Monthly Revenue Compared with 2020 and 2019
Revenue from beverages and products for household use in domestic business exceeded 2019 levels
Revenue from products for institutional and industry use fell far below 2019 levels in domestic business and almost
recovered to 2019 levels in the U.S.
* 29 days for February 2020
                                               Domestic: Beverages                                        Domestic: Products for household use
                                                                                        130%
                 115%                                                                                                                     Vs. 2020
                                                                     Vs. 2020
                 110%                                                                   120%                                              Vs. 2019
                                                                     Vs. 2019
                 105%                                                                   110%
                 100%
                                                                                        100%
                   95%
                                                                                        90%
                   90%

                   85%                                                                  80%
                               Jan.     Feb.      Mar.      Apr.      May       Jun.           Jan.        Feb.      Mar.       Apr.      May        Jun.

                              Domestic: Products for institutional and industrial use                 U.S.: Products for institutional and industrial use
                140%                                                                    200%
                                                                     Vs. 2020                                                             Vs. 2020
                120%
                                                                     Vs. 2019                                                             Vs. 2019
                                                                                        150%

                100%
                                                                                        100%

                 80%
                                                                                        50%

                 60%
                              Jan.     Feb.       Mar.      Apr.      May       Jun.     0%
                                                                                               Jan.        Feb.       Mar.      Apr.      May        Jun.   6
Domestic Processed Food Business
Beverages
Achieved year-on-year increase in revenue due to the release of new products and energetic promotions
Revenue reached 37.1 billion yen (up 700 million yen year on year) and core operating income was 3.51 billion yen
(down 40 million yen year on year).
Year-on-year comparison of revenue by                                         Sales by sales channel and by container size
sales channel and container size                                              (i) Sales through mass retailers and EC remained strong
Sales channel     1Q         2Q       1H
                                                                              (ii) Second-quarter sales through convenience stores exceeded the level a year earlier
Convenience store       94% (2) 101%        98%
                                       (1)                                          despite the long-lasting impact of COVID-19
Mass retailer          105%      101%      103%
                                                                              (iii) Compared with the previous year, demand for beverages in large containers for
EC                     119%      114%      116%
                                                                                    consumption at home sold through mass retailers settled down and sales of
Total                  103%      102%      102%
                                                                                    beverages in personal-size containers showed a tendency to pick up
Container size            1Q               2Q              1H
Personal-size                                                                 Revenue by core brand
                                   102% (3)        105%            104%
container                                                                     Yasai Seikatsu 100 Series 20.8 billion yen (102% year-on-year)
Large container                    106%             95%            102%       - A new Vitamin Smoothie product drove growth
Total                              103%            102%            102%       Yasai Ichinichi Kore-Ippon 6.2 billion yen (106% year-on-year)
The personal-size container is 265g PET bottle or 330 ml or smaller carton.
                                                                              - A new light product (50% less sugar) sold well
The large container is 720 ml PET bottle or 1L carton.
                                                                              Tomato juice 5.4 billion yen (97% year-on-year)
                                                                              - Revenue fell year on year mainly due to sluggish sales of 265g container size
                                                                                products which account for a large share of convenience store sales

                                                                              Promotion expenses, advertising expenses, etc.
                                                                              Both increased, reflecting proactive promotions and the inability to conduct promotions
                                                                              the previous year
                                                                              Promotion expenses rose 430 million yen year on year and advertising expenses
                                                                              increased 140 million yen year on year
                                                                                                                                                                7
Domestic Processed Food Business
Direct marketing
Revenue increased due to growing use of the direct marketing channel and rising health-consciousness
Revenue reached 6.0 billion yen (an increase of 400 million yen year on year), and core operating income was
390 million yen (rising 30 million yen year on year)
                                                Direct marketing business
                                                - Entered direct marketing business in 1998
                                                - Handling high value-added products based on the concept of special Kagome
                                                  products which cannot be purchased in-store
                                                - Manufacturing and selling mainly vegetable beverages, supplements and soups
                                                  through the Kenko Chokusobin direct marketing service

                                                Revenue by core product
                                                Vegetable beverages 3.9 billion yen (103% year-on-year)
                                                - Gained new customers by stepping up advertising from the spring
                                                Supplements 1.0 billion yen (118% year on year)
                                                - Sales grew as a result of investment in advertising to increase recognition and the
                                                  acquisition of regular customers
                                                Soups 500 million yen (115% year-on-year)

                                                Advertising expenses, etc.
                                                Increased due to proactive advertising campaigns
                                                Advertising expenses rose 150 million yen year on year

                                                                                                                                8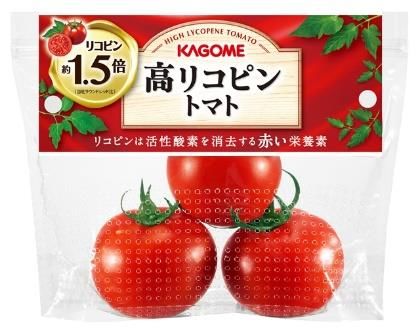
Domestic Processed Food Business
Food and others
Revenue from products for household use fell in the absence of the previous year’s demand while revenue from products
for institutional and industrial use increased
Revenue reached 21.7 billion yen (up 100 million yen year on year), and core operating income was 1.35 billion yen (dalling
→ falling 260 million yen year on year)
                                                 Products for household use
                                                 Revenue of 9.0 billion yen(95% compared with 2020 level and 105%
                                                 compared with 2019 level)
                                                 - Result reflects the absence of the previous year’s surge in demand but was still
                                                   higher than the FY2019 level
                                                 Revenue by core product
                                                 Tomato ketchup: 4.5 billion yen (95% compared with 2020 level and 104%
                                                 compared with 2019 level)
                                                 - Exceeded 2019 level due to increased promotions related to Napolitan Stadium

                                                 Products for institutional and industrial use
                                                 Revenue of 8.8 billion yen (102% compared with 2020 level and 82%
                                                 compared with 2019 level)
                                                 - Showed signs of recovery from FY2020 but failed to reach 2019 level
                                                 - Food processing industry sales (sales to food manufacturers, etc.) were solid,
                                                   exceeding the 2019 level

                                                 Promotion expenses, advertising expenses, etc.
                                                 Increased due to proactive promotions including Napolitan Stadium
                                                 Advertising expenses rose 160 million yen year on year

                                                                                                                                    9
Domestic Agriculture Business
    Revenue and core operating income both declined year on year due to weaker selling prices of fresh tomatoes caused
    by the downturn in market conditions from January to April
    Revenue was 4.9 billion yen (a drop of 300 million yen year on year) and core operating income was 100 million yen (a
    decrease of 130 million yen year on year)
                                                                                        Trends in fresh tomato sales
                                                                                        - Selling price fell after prices reached a five-year low in January-April
                                                                                        - Sales volume increased but revenue and core operating income both declined due to
                                                                                          lower selling prices
                                                                                        Revenue by core product
                                                                                        Fresh tomatoes 4.0 billion yen (95% year-on-year)

            Trend in Market Price of Fresh Tomatoes
      500

      450

                                                                                        Status of fresh tomato market
      400
                                                                           2018         - Prices reached a five-year low in January-April due to oversupply as a result of
Yen/㎏ 350                                                                                 unusually abundant harvests amid favorable weather conditions from the start of the
                                                                           2019
                                                                                          year
      300
                                                                           2020         - Tomato prices recovered from May due to an earlier-than-usual rainy season
                                                                           2021
      250

      200
             Jan.      Feb.      Mar.     Apr.      May      Jun.
                    Source: Created based on market statistics data obtained from the                                                                                 10
                            Tokyo Metropolitan Central Wholesale Market website
Domestic Business
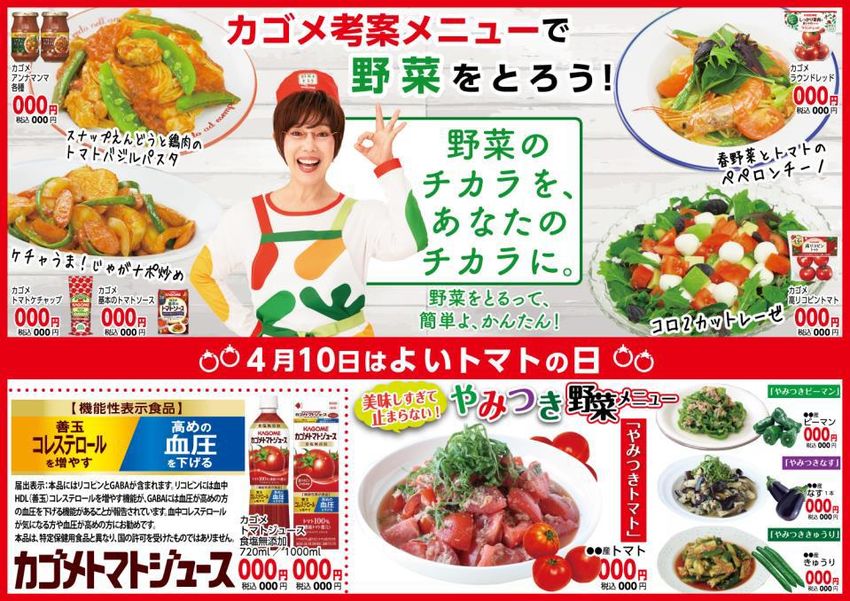
Implementation of “Let’s Eat Vegetables” campaign
In some cases, the dissemination of information via media such as TV commercials, newspaper ads and social media
encouraging people to increase their vegetable intake by 60g has increased purchase intentions among consumers aware
of the campaign and prompted them to actually cook with Kagome products at home
(i) Consumers who answered that they had purchased products in (ii) In some cases, the dissemination of information via handouts
the past and intended to purchase them again in the future was in supermarkets and social media linked to the recipes of
10 percentage points higher for all products among consumers Remi Hirano used in TV commercials has prompted
aware of the campaign than among consumers not aware of the consumers to actually cook with Kagome products at home
campaign
Q14.Tell us about your purchase experiences and intentions with regard to these Kagome products.
Consumers
aware of
Kagome Tomato campaign
Ketchup Consumers
not aware of
campaign
Yasai Seikatsu Consumers
CP認知者
aware of
Original
campaign
Consumers
CP非認知者
not aware of
campaign
Yasai Ichinichi Consumers
Kore Ippon CP認知者
aware of
campaign
Consumers
not aware of
CP非認知者
campaign
Consumers
Kagome Round
aware of
CP認知者
Red
campaign
Consumers
CP非認知者
not aware of
campaign
* Example of a handoutDomestic Business
Implementation of “Let’s Eat Vegetables” campaign
Implemented various collaborations as part of the vegetable promotion project from January to
August 2021
Example (1) Vegetable-themed Example (2) Cooking classes Example (3) Promotion internally Example (4) Production of
collaboration at YANMAR teaching delicious, fun vegetable and dissemination of information cooking program promoting
MUSEUM recipes with Mini Mouse as a externally through interview with vegetables
motif ABC Cooking Studio President
Example (5) Collaborative Example (6) “Veggie Challenge” Example (7) Vegetable promotion
product planning by ABC at ROHTO RECIPE, a restaurant project Part 2 by Hoshino
Cooking Studio, Kagome and directly operated by Rohto Resorts and Kagome
Asahi Kasei Home Products Pharmaceutical @RISONARE YatsugatakeInternational Business
Revenue and core operating income both increased as a recovery of demand in the food service market was steadily turned
into revenue and the effects of structural reforms initiated the previous year also became evident
Revenue reached 25.7 billion yen (increasing 3.1 billion yen year on year) and core operating income was 1.72 billion yen
(rising 1.34 billion yen year on year)
Revenue Core Operating Income
FY2021 FY2021
YoY FY2020/ FY2019/ YoY FY2020/ FY2019/
Unit: 100 million yen (excl. (excl.
YoY 1H 1H YoY 1H 1H
exchange exchange
rate impact) rate impact)
U.S.: Kagome Inc. 105 +13 +14 92 110 6.0 +5.7 +5.7 0.3 3.7
Portugal: HIT 49 (5) (9) 54 46 2.8 +3.3 +3.2 (0.4) 0.4
Kagome Australia Pty Ltd. 44 +13 +6 31 32 3.4 +2.1 +1.9 1.2 1.7
U.S.: UG 26 +4 +4 22 21 4.4 +0.7 +0.8 3.6 1.6
Others 30 +5 +3 25 21 0.5 +1.5 +1.5 (1.0) (1.8)
International Business total 257 +31 +19 225 232 17.2 +13.4 +13.3 3.7 5.6
Summary by company (local currency basis)
Kagome Inc.: Revenue and profit both increased, reflecting success tapping into the recovery of food sector
demand leading to higher sales and increased productivity leading to lower costs
Portugal: HIT: Although revenue fell in the absence of strong sales to food manufacturers the previous year,
profit increased through improvement in profitability
Kagome Australia Pty Ltd.:
Revenue and profit both increased mainly due to rising demand for tomato paste and growth
in sales to Kagome Japan
U.S.: UG: Revenue and profit both increased, reflecting strong sales of seeds mainly in Europe and the
13
Middle EastFactors Contributing to Core Operating Income Changes
Increases in advertising expenses and promotion expenses in the Domestic Processed Food Business and
lower profit in the Domestic Agriculture Business were offset by higher profit in the International Business
Unit: 100 million yen
20年度上期
1H FY2020 63.5
Increase in profit accompanying
+5.7
Decrease in income in the
increase in sales
domestic processed food
Improvement in ratio of
logistics expenses
+2.1
business
Cost reduction +0.9
Increase in advertising
(1) expenses
(4.6)
Increase in promotion
(2) expenses
(3.9)
Others (4.8)
Decrease in profit of the
agriculture business (1.3)
Increase in profit of the
international business +13.4
1H FY2021 71.1
50 60 70
Main Factors Contributing to Changes
(1) Increase in advertising expenses: Mainly newspaper ads and TV commercials linked to the “Let’s Eat Vegetables” campaign
(2) Increase in promotion expenses…Promotion of new products mainly in the beverages
14Factors Contributing to
Operating Income and Profit Changes
Increase in operating income and profit before income tax were smaller, reflecting the recording of gain on
sales of non-current assets the previous year
Unit: 100 million yen FY2021 FY2020 Change
Core operating income 71.1 63.5 +7.5
Other income 2.2 10.5 (1) (8.2)
Other expenses 3.9 5.3 (1.4)
Operating income 69.4 68.7 +0.6
Profit before income tax 69.8 68.8 +0.9
Income tax expense 20.1 22.6 (2) (2.4)
Net income 47.3 45.7 +1.6
Factors Contributing to Changes
(1) Other income (8.2)…Recorded gain on sales of non-current assets of 700 million yen due to
the sale of leased real estate in FY2020
(2) Income tax expense (2.4)…Due to fall in effective tax rate (FY2020:32.8%, FY2021:28.9%)
15Changes to Statement of Financial Position
Balance sheet shrank due to repayment of borrowings in preparation for tightness of financing conditions due
to COVID-19
Assets/liabilities and equity Factors Contributing Unit: 100 million yen
¥204.9 B (down ¥20 B from the end of FY2020) to Changes
Equity attributable to owners of parent to total
assets: 56.2% (up 6.9 points)
Current assets: 1,159 (down 256)
Quarterly Consolidated Statement of Financial Position Cash and cash equivalents (264) (mainly
(As of June 30, 2021) repayments of borrowings)
Unit: 100 million yen Trade and other receivables +18
Inventories (18), etc.
Liabilities 877 (down 245)
Non-current assets: 889 (up 56)
Total assets 2,049 (down 200) Property, plant and equipment +44
Current assets 1,159 (down 256)
Other financial assets +15, etc.
Non-current assets 889 (up 56)
Liabilities: 877 (down 245)
Mainly repayments of borrowings
Equity 1,171 (up 45)
Equity: 1,171 (up 45)
Net income +47, Other comprehensive income +28
Dividends paid (32), etc.
16Changes in Cash Flow
Unit: 100 million yen FY2021* FY2020* Change
Cash flows from operating activities (A) 89 73 15
Cash flows from investing activities (B) (58) 1 (59)
Free cash flows (A+B) 31 75 (43)
Cash flows from financing activities (308) 105 (414)
* For first six months of each fiscal year respectively
Key Components of FY2021 Cash Flows (Unit: billion yen)
Cash flows from operating activities
Profit before income taxes +6.9, Depreciation and amortization +3.5, Income taxes paid (2.2), etc.
Cash flows from investing activities
Purchase of non-current assets (5.9), etc.
Cash flows from financing activities
Repayments of borrowings (27.3), Dividends paid (3.2), etc.
172. Second-Half Initiatives/Direction
18Domestic Processed Food Business:
Second-half Initiatives
Implement initiatives to encourage the intake of vegetables from multiple perspectives through the
“Let’s Eat vegetables” campaign and seek to expand sales by steadily tapping into the continually
growing interest in health and immunity
10.29 million friends
In-store
230,000 followers
promotions
170,000 followers
Dissemination
of information Campaigns
via social
media
Newspaper Vegetable
promotion
ads and TV
project
commercials activities
19Domestic Processed Food Business:
Second-half Initiatives
Implement initiatives to encourage the intake of vegetables from multiple perspectives through the
“Let’s Eat vegetables” campaign and seek to expand sales by steadily tapping into the continually
growing interest in health and immunity
Second-half initiatives in the beverages category Second-half initiatives in the food, etc. category
(1) Strengthen promotion of vegetable beverages (1) Promote Western-style food and dishes
- Disseminate information about vitamins via the WEB, social media and other - Step up ongoing efforts to promote Western-style dishes
media to increase recognition of the value of vegetables since Neapolitan Stadium
- Continue to conduct a campaign based on a popular character, which was well - Reboot the Western-style dishes support team for the food
received last year service industry
(2) Conduct promotions to raise awareness of vegetable intake and cooking with
vegetables
- Disseminate menu information through Remi Hirano
- Expand ingredients for institutional and industrial products used for processing and in
ready-to-eat dishes
- Hold Vegetable Solution 2021 (exhibition of products of institutional and industrial use)
online
(2) Strengthen plant-based domain
- Expand Yasai Seikatsu Soy+ products
- Release Oats+ to expand plant-based milk products
Market together with Soy+ as plant-based products (3) Tap into new demand with plant-based food
- First company which comes to mind for plant-based products
(according to our WEB survey)
- Market products for institutional and industrial use as products
for household use from this second half
Release of Yasai
Release of Yasai
Seikatsu
Seikatsu Oats+
Soy+
in September
Tounyu Banana Mix
in September
20Domestic Agriculture Business:
Second-half Initiatives
Ensure profitability on a full-year basis by stepping up promotions linked to the “Let’s Eat Vegetables” campaign
and increasing productivity
Second-half initiatives
(1) Increase product exposure opportunities by planning appearances of
Remi Hirano
- Disseminate information about “Remi Hirano Recommended Dishes” on
packaging and conduct a gift campaign
(2) Stabilize earnings through price control
- Increase selling prices during the off-season by ensuring crops of summer-
autumn tomatoes
- Secure sales promotion according to procurement volume
(3) Encourage more stores to stock high lycopene tomatoes for longer
- Increase stores stocking high lycopene tomatoes among CVS and small
supermarkets which are less sensitive to changes in market conditions
- Expand market for products for institutional and industrial use including
八ヶ岳みらい菜園(長野県)
CVS-ready-to-eat meals
Increase productivity at plantation sites
- Make improvements through harvesting based on operations analysis,
standardization of tomato sorting operations and target setting
- Increase productivity by promoting the systemization of business processes
21International Business:
Second-half Initiatives
Steadily turn recovery of demand in food services market into revenue and seek sustainable
profit growth
Primary processing
- HIT aims for production of this season’s crop on an
appropriate scale
- Strengthen management of earnings by customer to
generate profit
- In Australia, tomato paste shipments were moved up to the
% first half and, as a result, second-half shipments are
Sales Trend of Major Customer Applebee’s
400 expected to fall year on year
Vs. 2020
20年比 Vs.
19年比2019
300
200 Secondary processing
100
- Food services demand in the U.S. has almost recovered to
2019 levels
0
Jan. Feb. Mar. Apr. - Seek to expand sales by steadily tapping into demand
Data for January-April 2021
Created based on data disclosed by Applebee’s
recovery
Vegetable beverages in Asia
- Continue exports and sales in 7 Asian regions
- Build business base using local distributors, etc.
223. Full-Year Consolidated
Results Forecasts for FY2021
23FY2021 Full-Year Results Forecasts
Raised results forecasts mainly due to recovery of food service demand in the U.S.
Revenue Core Operating Income
FY2021 Revised FY2021 Revised
FY2021 FY2020 FY2021 FY2020
Forecast Forecast
Unit: 100 million yen
Vs. Initial Initial Vs. Initial Initial
YoY Result YoY Result
Forecast Forecast Forecast Forecast
Domestic processed
1,377 - +32 1,377 1,344 110.0 +2.0 (18.0) 108.0 128.0
food business
Domestic
101 (8) (0) 109 101 2.0 (5.0) (0.7) 7.0 2.7
agriculture business
International
475 +36 +31 439 443 23.0 +7.0 +21.2 16.0 1.7
business
Other/adjustments (73) (8) (13) (65) (59) 2.0 +2.0 (1.4) 0.0 3.4
Total 1,880 +20 +49 1,860 1,830 137.0 +6.0 +1.0 131.0 135.9
Red text indicates revisions from initial forecasts
Factors for Revision from Initial Forecast
Domestic processed food business:
Raised forecast for core operating income due to reduction of business trip expenses and other costs. Plan to continue expanding revenue through proactive promotions.
Domestic agriculture business:
Lowered forecasts due to poor first-half performance, although profitability will be ensured by increasing the selling prices for summer-autumn production areas and
increasing share of high lycopene tomatoes.
International business:
Raised forecasts due to strong first-half performance.
244. Preparing for Third Mid-Term Management Plan
25Preparing for Third Mid-Term Management Plan
During the Second Mid-Term Management Plan Period, revenue and core operating income both
showed slower growth
Looking ahead to the Third Mid-Term Management Plan, revenue growth is an issue which needs
to be addressed
800 1,845 1,808 1,830 1,880 8.0%
Challenge under Third Mid-
700 7.4% Term Management Plan is to 7.5%
7.3%
600 achieve revenue growth while
6.8% maintaining profit rate 7.0%
500 6.7%
135 137
400 124 123 6.5%
300
6.0%
200
5.5%
100
0 5.0%
2018 2019 2020 2021 2022 2023 2024 2025
(Forecast)
Second Mid-Term Management Plan Third Mid-Term Management Plan
26Laying Foundations for Next Growth Phase (1)
DX is essential for the creation of new customer contact points and new business models
Defensive (Mode 1) phase is over Offensive (Mode 2)
DX initiatives to date Promotion of DX in preparation for Third Mid-Term
- Launched initiatives in 2016 with the aim of strengthening ability to Management Plan
adapt to digital transformation and market changes (1) Explore DX seeds in each business field
- Standardized core business processes with backbone system Think out of the box to create new businesses
renewal in 2020 Turn “exciting” ideas into projects
- Introduced cloud services - 5 businesses: retail distribution, institutional and industrial
- Introduced teleworking system products business, direct marketing business, health
business, agricultural business (including smart agriculture)
- Hold workshops with internally recruited members and
business division members
Presentation of Kagome’s DX Initiatives at AWS*
Summit (2) Design meetings to promote DX
• Amazon Web Service
- Verify group-wide progress and direction in relation to DX
✓Status quo = Decline issues
✓DX is important for increasing
touchpoints with new (3) Raise awareness of DX initiatives
customers and expand internally
revenue
- Regularly distribute videos
✓Combination of “top-down”
approach and “employee explaining DX projects internally
awareness” creates momentum for DX 27Laying Foundations for Next Growth Phase (2)
Actively pursue open innovation and use solutions to social problems as opportunities
for further growth
Agricultural
Realization of sustainable Expansion into plant-based
revitalization/Regional
agriculture food domain
revitalization
Sobetsu Agri-Foods Co., Ltd.
Screen for data comparative
During successful growth analysis between fields
AI farming advice service
applied in the field
Fruit sorting area using gymnasium Business alliance with TWO Inc., which
markets plant-based food brands
Creation of CropScope Agricultural ICT Platform Establishment of joint venture with - Leveraging the knowledge of the two
with NEC agricultural production corporation companies to plan and develop plant-based
- Service that uses sensors and satellite photographs - Meets growing demand for processed opinion food/beverages and services
to visualize the growth status of tomatoes and the products - Increasing recognition of plant-based food
condition of soils, as well as a service that provides - Built using disused school premises and site - Proposing products and exploring needs for
farming advice using artificial intelligence (AI). - Contributes to regional revitalization through the home-cooked food, meal replacements and
- Stabilizes harvests and reduces cultivation costs promotion of local employment food service users
- Implements environmentally friendly farming - Consider new brands and channel expansion
28Laying Foundations for Next Growth Phase (3)
Focus on environmental issues and pursue sustainable business, recognizing that since “nature” is
the source of Kagome's products, protection of the environment is essential for our business
survival
Revision of CO2 emissions goal Initiatives to reduce plastic in products
Revised medium-to-long term goal for reduction of CO2 Launched initiatives to reduce plastic in products
emissions set in 2018 in line with SBTi’s 1.5oC ambition in line with plastic policy
Previous goal New goal Example:
Reduction of 20% by 2030 and 50% Sale of seasonal special Yasai Seikatsu 100
by 2050, both compared to 2016 (in
line with 2oC target under Paris
Goal is in line with the SBTi's 1.5oC ambition products with eco-friendly paper straws
Agreement)
(Thousand tonnes)
(Thousand tonnes) - Sold as limited edition via Kagome
160
16
website shopping site (sold by the
140
130 14
case)
- More expensive (120 yen per unit)
than regular products but well
80
received
- Plan to continue balancing
environmental initiatives and
(FY)
business in the future
(Base year) (FY)
29Finally…
Growing consumer interest in a
healthy diet and increasing immunity
Survive in the “food and health” domain
through the power of vegetables
“Become a strong company
2025 Goal that can achieve sustainable growth
resolving social issues through foods.”
2025 Transform from a “tomato company”
Long-term Vision to a “vegetable company”
To be announced at the time of the
2025
announcement of the Third Mid-Term
Numerical Targets
Management Plan 30You can also read